

Authentication and access
Use a CoreWeave API access token for HTTP requests to the observability query endpoints. Pass the token in theAuthorization header as a Bearer token.
Replace [API-ACCESS-TOKEN] in the following examples with your API access token secret from the Access Tokens page in the Cloud Console.
CoreWeave evaluates authorization for observability data through IAM Access Policies. For read-only access to metrics and logs through the APIs and CoreWeave Grafana, principals typically need the Observability Viewer role. In the legacy group-based model, membership in the metrics group granted equivalent access. See Legacy User Permissions for details.
The secret for a CoreWeave API access token is the same value whether you pass it in
Authorization headers or embed it in a kubeconfig as users[].user.token for kubectl. The difference is which service you call: use observability hostnames such as observe.coreweave.com for metrics and logs APIs, and use your cluster Kubernetes API server URL from the kubeconfig for the Kubernetes API.Query metrics
You can query metrics through the Prometheus-compatible HTTP API. The following sections describe the available endpoints, the supported request paths, and example queries for both instant and range data.Global and Super Regional endpoints
Metrics are available from the Global hostname and from Super Regional hostnames. The endpoint you choose affects both query performance and the completeness of results. Super Regional endpoints can return more complete results for large or detailed queries and offer lower latency when your data is stored in that Super Region. For the authoritative list of metrics hostnames, see Metrics data locations on the Data sources page. The following examples use the Global hostnameobserve.coreweave.com. To send the same request to a Super Regional endpoint, swap the hostname and keep the path (for example, https://observe.us-east.coreweave.com/api/v1/query).
The following paths are supported:
Instant metric query
The following example usescurl to run an instant query that returns the total time GPUs spent in idle mode (in seconds):
Range metric query
For a time range, usequery_range with start, end, and step as Unix timestamps in seconds:
[START-TIMESTAMP] and [END-TIMESTAMP] with the range you need.
For more information about querying Prometheus metrics, see the Prometheus HTTP API documentation.
CoreWeave does not support the Prometheus Federation API.
Legacy metrics
If your queries cover dates before the October 2024 backend migration, query the Legacy Prometheus host to retrieve that historical data. CoreWeave migrated its metrics backend in October 2024, and the new backend reliably contains data from October 21, 2024 onward. For metrics collected before that date, query the Legacy Prometheus host in addition to the preceding primary endpoints. The Legacy service exposes the same Prometheus HTTP API paths (for example,/api/v1/query and /api/v1/query_range).
Query logs
You can query logs through the Loki-compatible HTTP API. The following sections cover the host matrix for each log type, the supported paths, and an example query.Global, Super Regional, and legacy log endpoints
At the Global host, application, platform, and audit logs share one Loki-compatible API. In Super Regions, application and platform logs useobserve.<super-region>.coreweave.com, and CKS audit logs use the dedicated audit host observe-audit.<super-region>.coreweave.com in that Super Region. For the full matrix and Grafana data source names, see Logs data locations. Some log types expire after two weeks.
The following paths are supported:
Log query format
The following example returns Kubernetes audit logs for a cluster:[CLUSTER-NAME] with your cluster name.
Legacy logs
In March 2025, CoreWeave introduced Super Regional log endpoints. If you need logs collected before that date, query the Legacy logs endpoint in addition to the preceding primary endpoints. The Legacy service exposes the same Loki API paths (for example,/loki/api/v1/query and /loki/api/v1/query_range).
For background, see Legacy logs on the Data sources page.
Grafana Explore
If you prefer an interactive UI to direct API calls, you can run the same kinds of ad hoc queries in Grafana. Grafana Explore is available in CoreWeave Grafana and supports the full range of PromQL and LogQL for ad hoc queries on metrics and logs. You can also view metadata such as which metrics are available or which labels you can use to filter PromQL queries. CoreWeave’s default dashboards offer curated views of specific logs and metrics, and you can use the Explore tab to investigate metrics in more detail.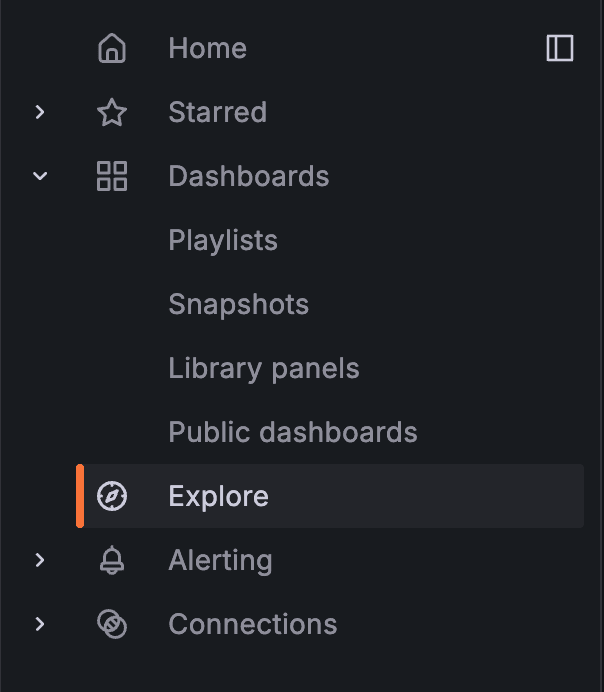
For more information, see Get started with Grafana Explore.