
Documentation Index

Fetch the complete documentation index at: https://docs.coreweave.com/llms.txt

Use this file to discover all available pages before exploring further.

To view the dashboard, go to the SUNK Global dashboard.
For accessing CoreWeave Grafana dashboards instructions, see Access and use CoreWeave Grafana dashboards.
The SUNK Global dashboard provides a high-level overview of SUNK infrastructure across all regions, cluster organizations, and clusters. It displays alerts, job distribution, software version information, and control plane health metrics.

Filters and parameters

Use these filters at the top of the page to choose the data you want to view:
FieldValue
Data SourceThe Prometheus data source selector.
RegionThe region(s) to view. Supports multi-select.
OrgThe cluster organization(s) to view. Supports multi-select.
ClusterThe specific Kubernetes cluster(s) to view. Supports multi-select.
Set the time range and refresh rate parameters at the top-right of the page. The default time range is 1 hour.

Panel descriptions

SUNK Alerts

The SUNK Alerts section displays active alerts across all monitored SUNK infrastructure.
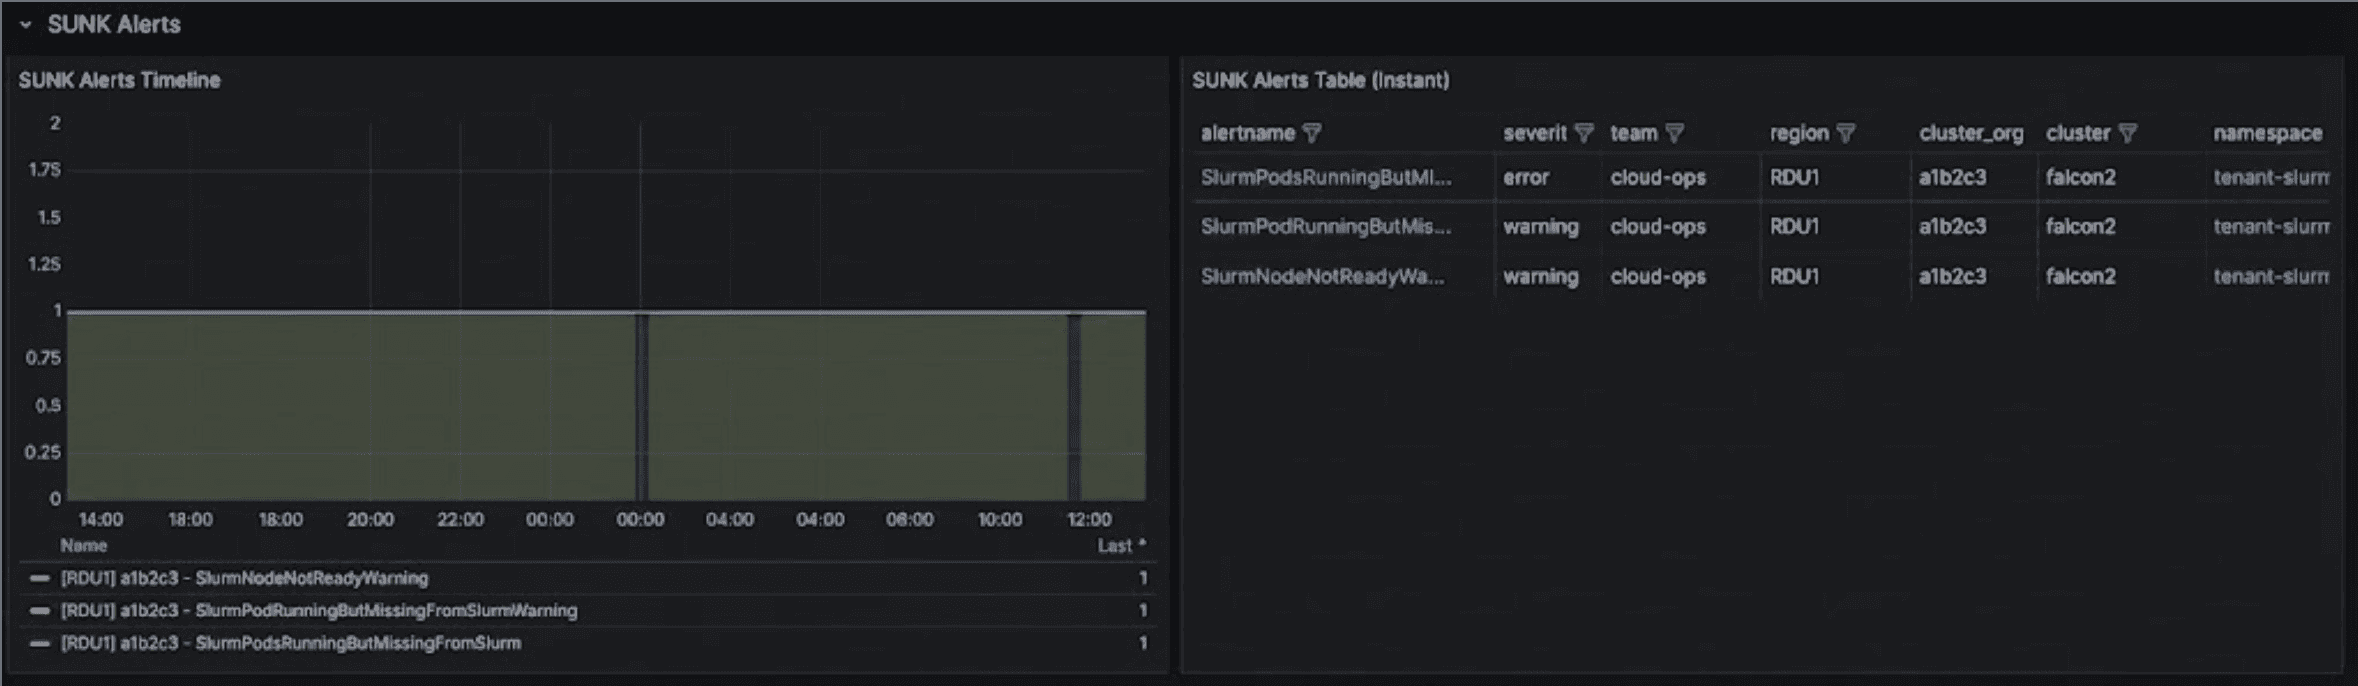
PanelDescription
SUNK Alerts TimelineA time-series graph showing when alerts fired. Each line represents an alert grouped by alertname, region, cluster_org, and cluster.
SUNK Alerts Table (Instant)A table showing all currently firing SUNK alerts. Includes alertname, severity, team, region, cluster_org, cluster, namespace, node, nodeset, and pod information. Namespace, node, and pod values link to detailed dashboards.
SUNK Alerts section showing timeline and table of firing alerts The SUNK Alerts Table provides clickable links to drill down into the specific Slurm Cluster Dashboard view for each alert, allowing you to investigate the context around firing alerts. You can also click node values to view Node Details or pod values to access the Pod Inspector for detailed troubleshooting.

Slurm Jobs

The Slurm Jobs section displays running Slurm job distribution.
PanelDescription
Largest Job by NodesA donut chart showing the top 10 largest running jobs by node count. Clicking on a slice navigates to the Slurm Job Metrics dashboard.

Software Versions

The Software Versions section displays version distribution across the SUNK infrastructure.
PanelDescription
SUNK Versions PiechartA donut chart showing SUNK version distribution across syncer containers.
SUNK Versions TableA table listing SUNK versions by region, cluster_org, cluster, and namespace with node counts.
SUNK Operator VersionsA donut chart showing SUNK Operator (controller-manager) version distribution.
SUNK Operator Versions TableA table listing SUNK Operator (controller-manager) versions by region, cluster_org, and cluster with node counts.
CUDA Versions PiechartA donut chart showing CUDA version distribution across slurmd containers.
CUDA Versions TableA table listing CUDA versions by region, cluster_org, cluster, and namespace with node counts.
OS Versions PiechartA donut chart showing Ubuntu OS version distribution across SUNK daemon containers.
OS Versions TableA table listing OS versions by region, cluster_org, cluster, and namespace with node counts.
SUNK Versions showing piechart and table of versions across infrastructure The SUNK Versions panels provide visibility into which version each cluster is using across your infrastructure. The piechart shows the distribution at a glance, while the table lets you see exactly which clusters are running specific versions, making it easier to plan and coordinate upgrades. CUDA Versions showing distribution across infrastructure The CUDA Versions panels display CUDA version distribution across all 
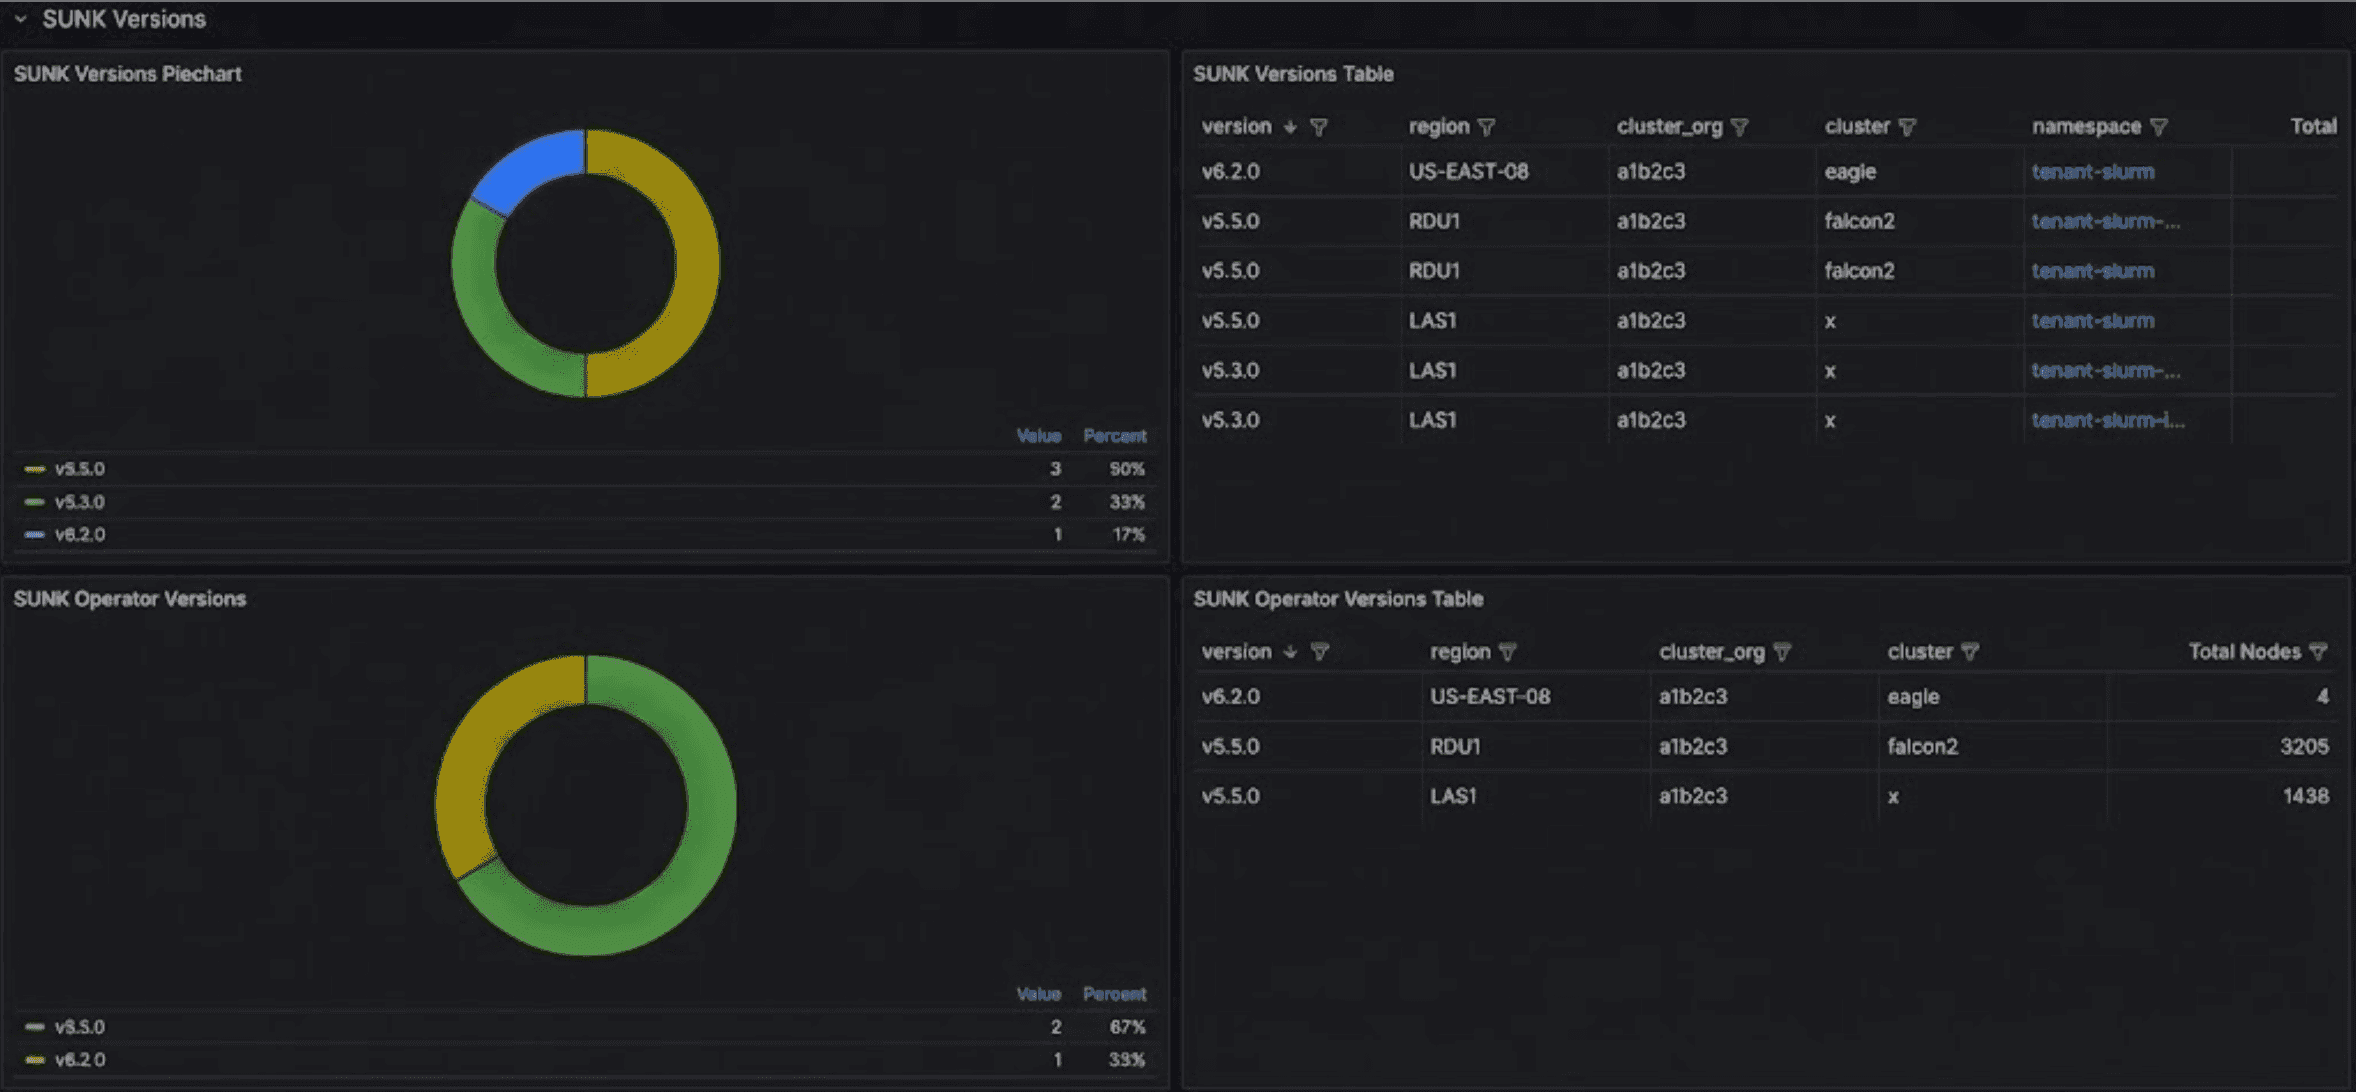
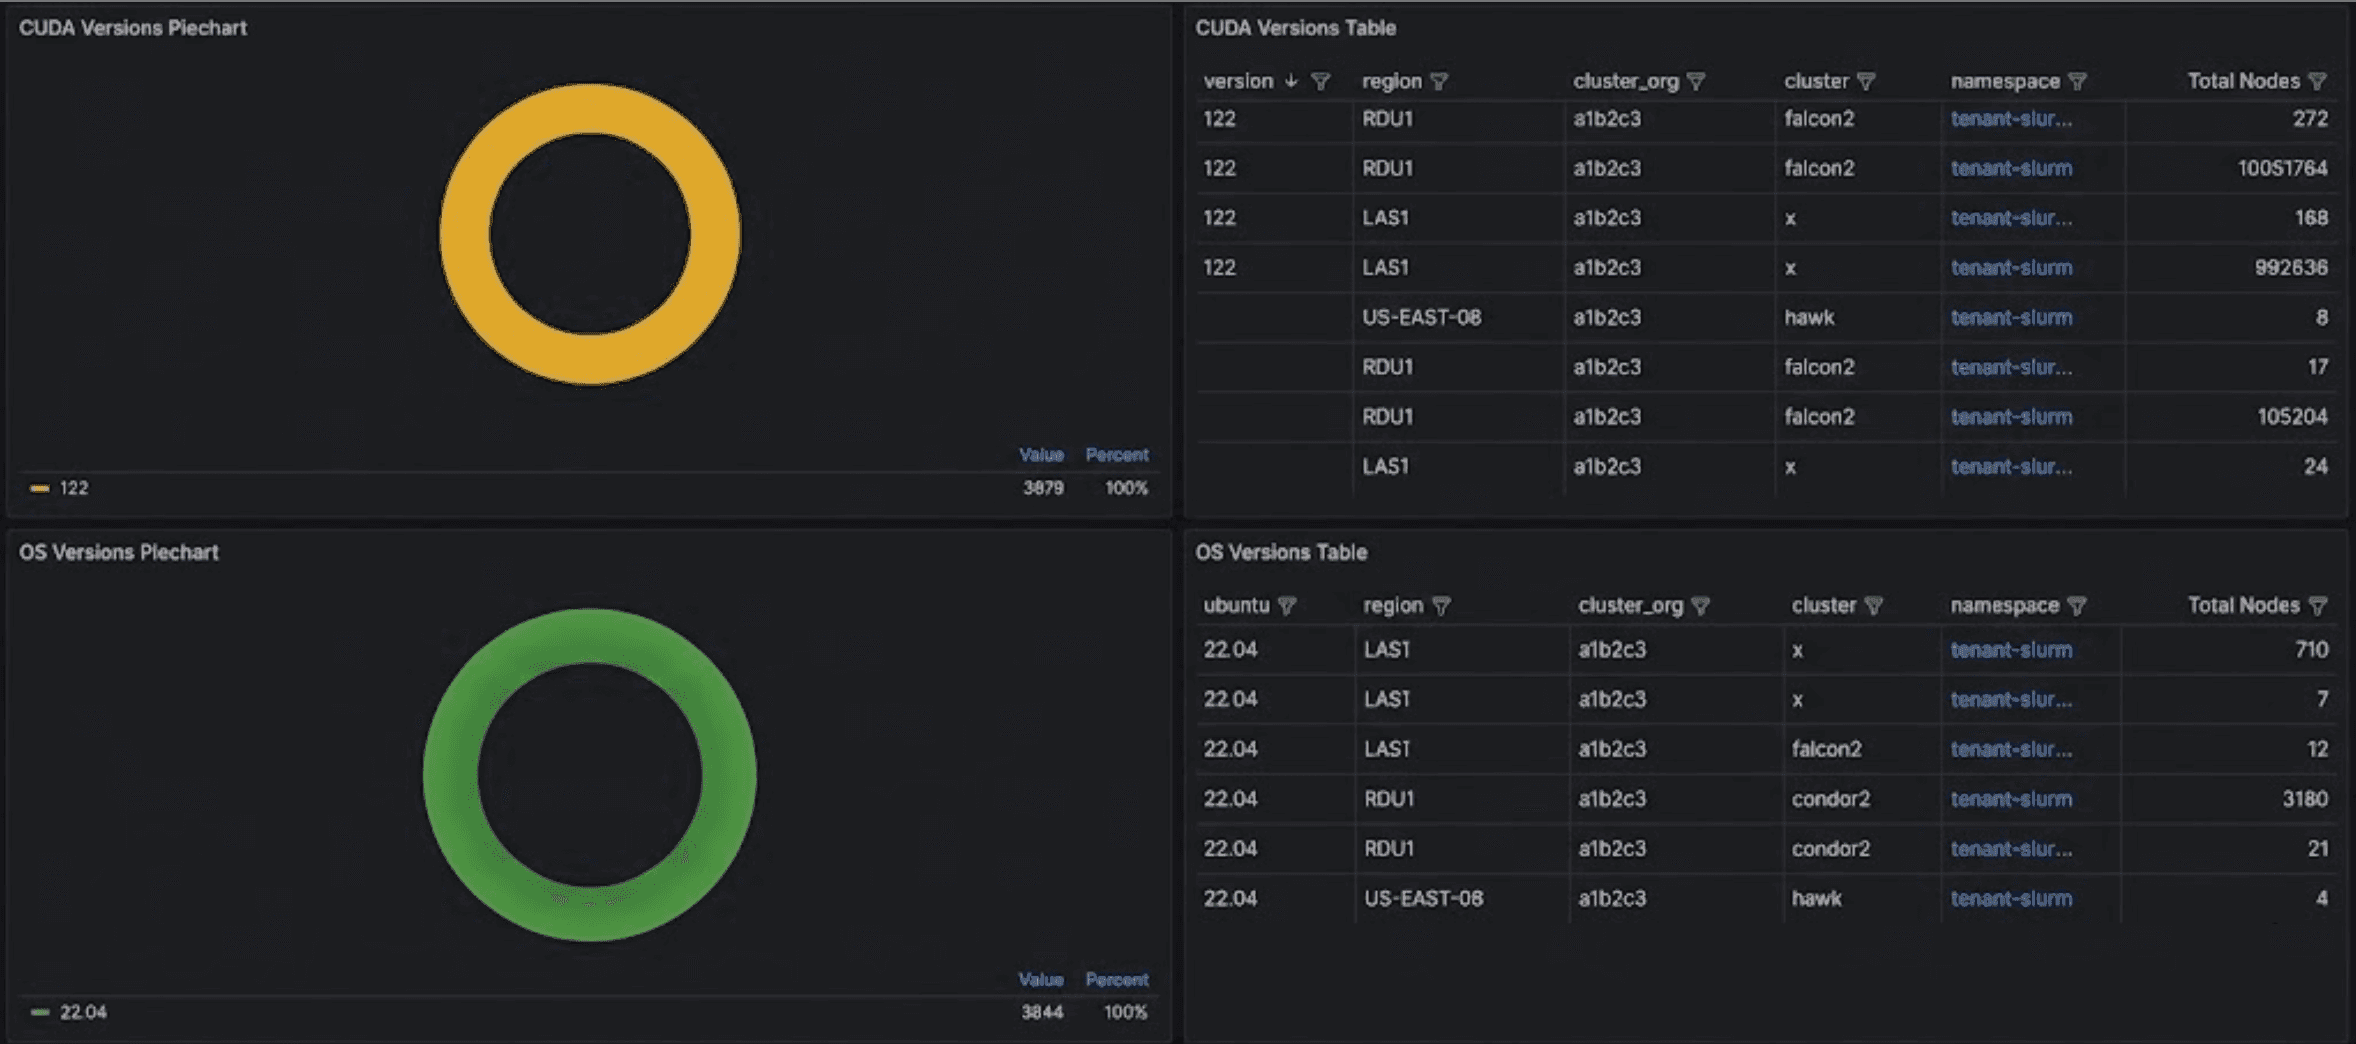
slurmd containers. Use these panels to track which CUDA versions your clusters are using and plan upgrades across your infrastructure.
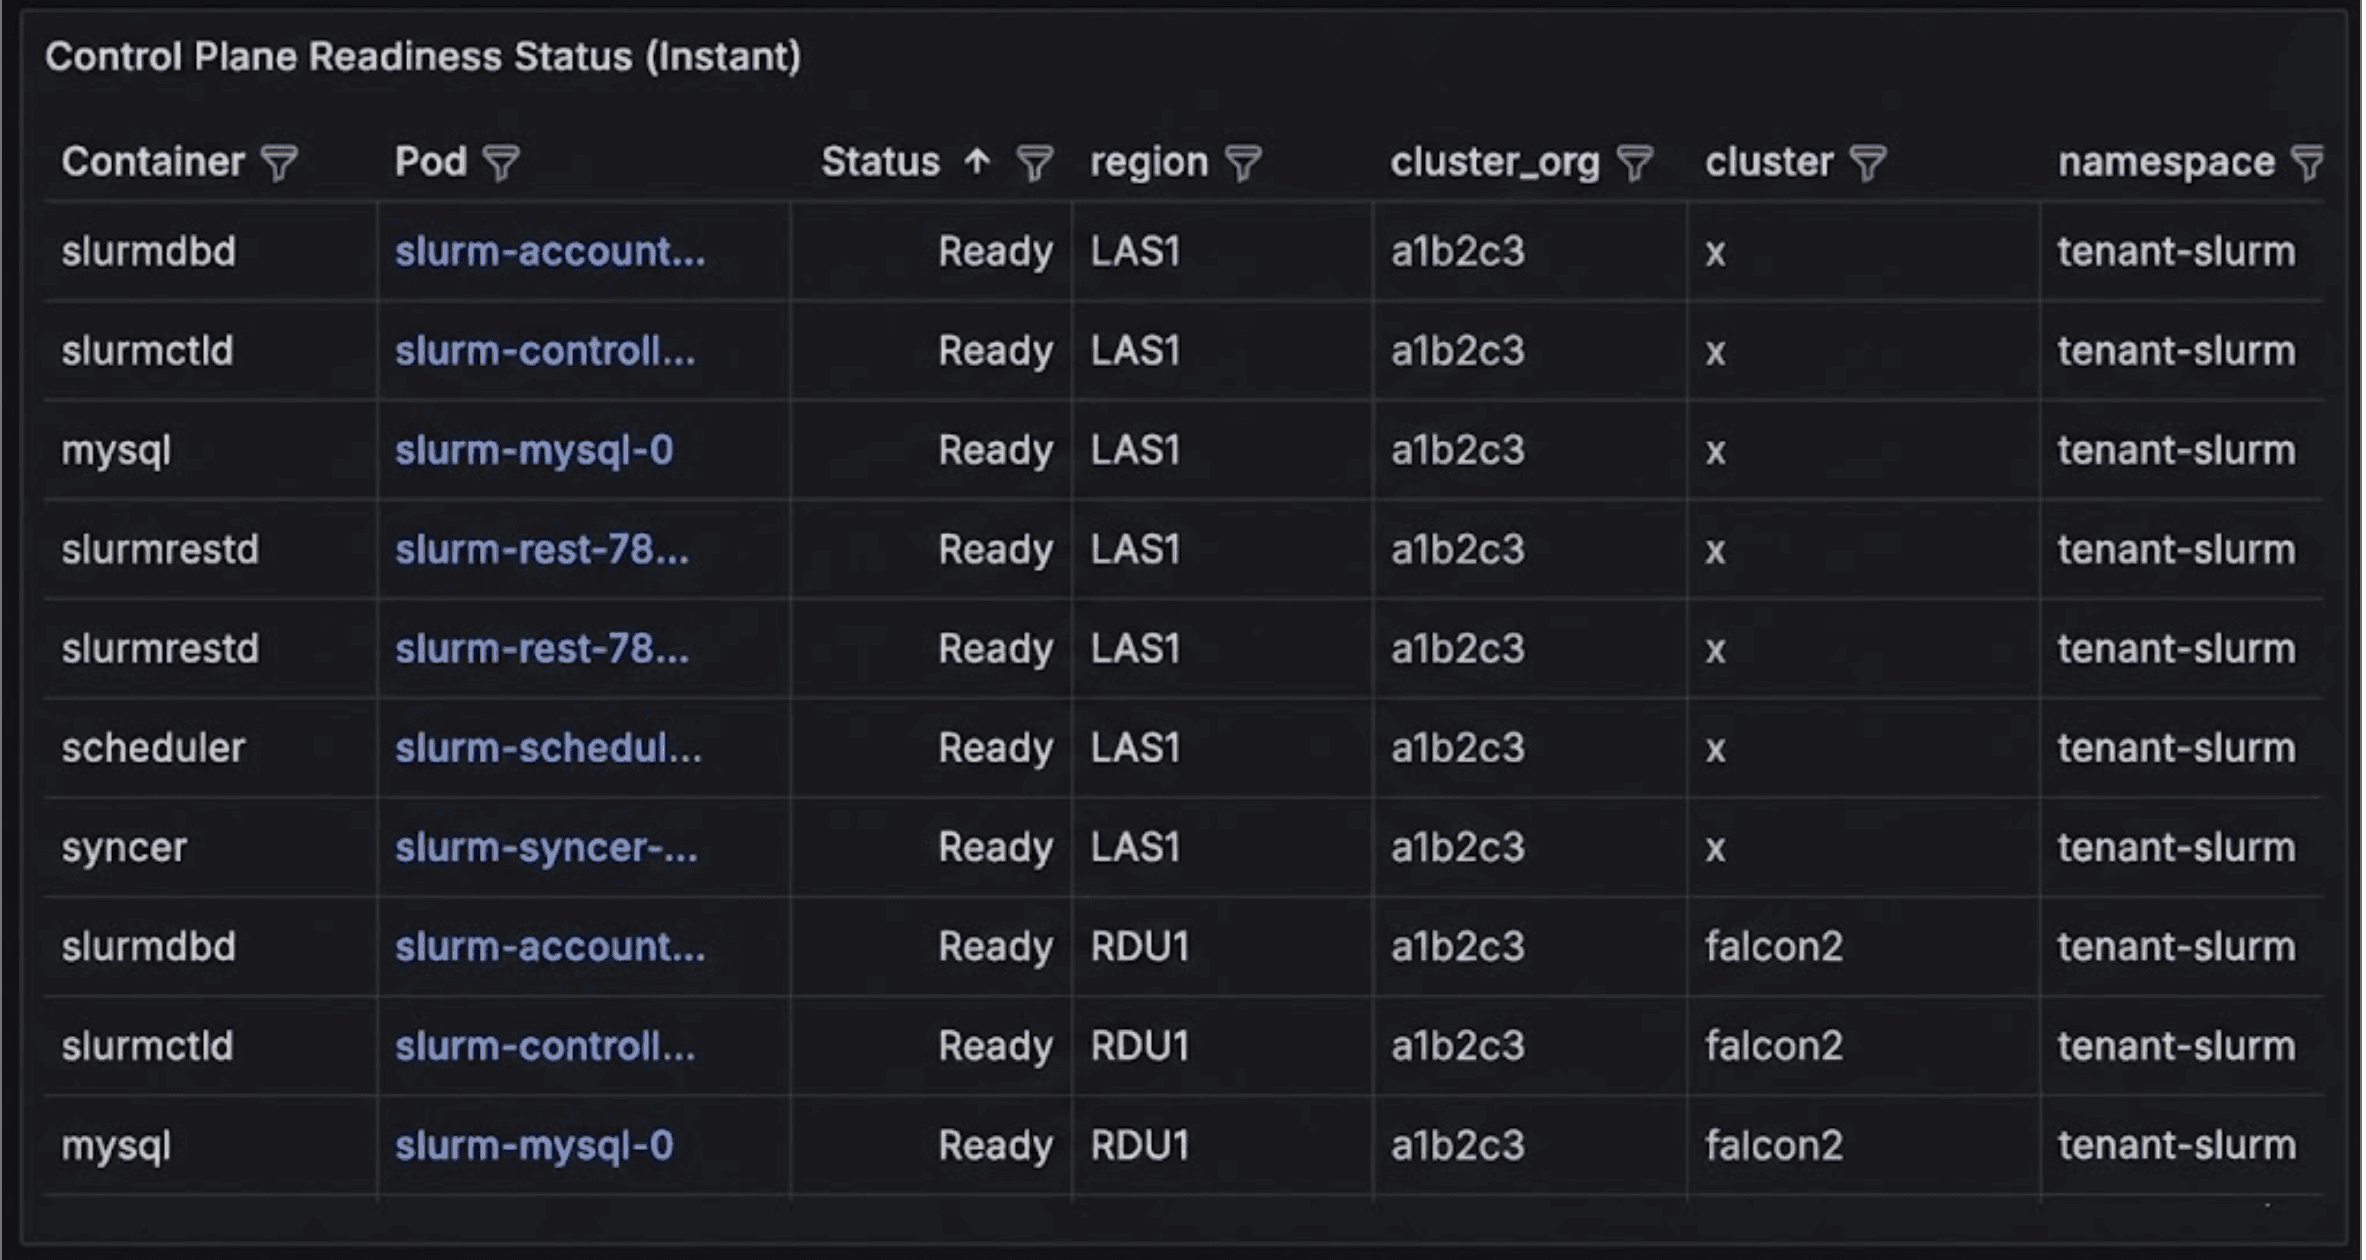
Control Plane Health

The Control Plane Health section displays SUNK control plane component status.
PanelDescription
Control Plane Restart CountersA time-series graph showing restart count increases for control plane containers (scheduler, slurmctld, slurmdbd, slurmrestd, syncer, mysql) over time.
Control Plane Readiness Status (Instant)A table showing the current ready state of control plane pods. Includes Container, Pod, Status (Ready/Not Ready), region, cluster_org, cluster, namespace, and a link to view pod logs in Loki.
Control Plane Readiness Status table showing pod status across infrastructure The Control Plane Readiness Status table displays the current ready state of all control plane components. You can drill down into individual pods via the Pod Inspector or access Loki logs directly from the table to troubleshoot any control plane components.
Last modified on April 13, 2026