

Prerequisites
To set up a self-hosted Grafana instance, you need the following:- A CoreWeave API Access Token for an active CKS account.
- A CKS cluster where you intend to self-host (deploy and manage) Grafana.
kubectlinstalled.helminstalled.
Install Grafana with CoreWeave Charts
This section installs the Grafana Helm chart into your cluster so the application is running and ready to configure.-
Add the CoreWeave Charts repository:
-
Install the
grafanachart:
Log in to Grafana with admin credentials
With Grafana installed, the next step is to reach the application in your browser and sign in as the administrator so you can finish configuration. Before you log in to Grafana, you must port forward your Grafana service.-
Port forward your Grafana service:
-
Navigate to
localhost:8900. You see a login page similar to the following: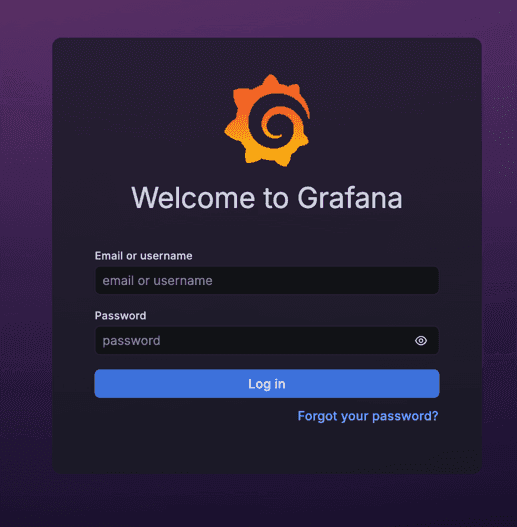
-
Obtain the admin password, which is required to log in to Grafana for the first time. This password is stored as a Kubernetes Secret. Retrieve the Secret value, replacing
[MY-NAMESPACE]with your namespace ID:Note: If you use a Mac, you might need to remove the trailing%. -
Use the returned value as your password when you log in to Grafana with the following credentials:
Configure CoreWeave Metrics data source credentials
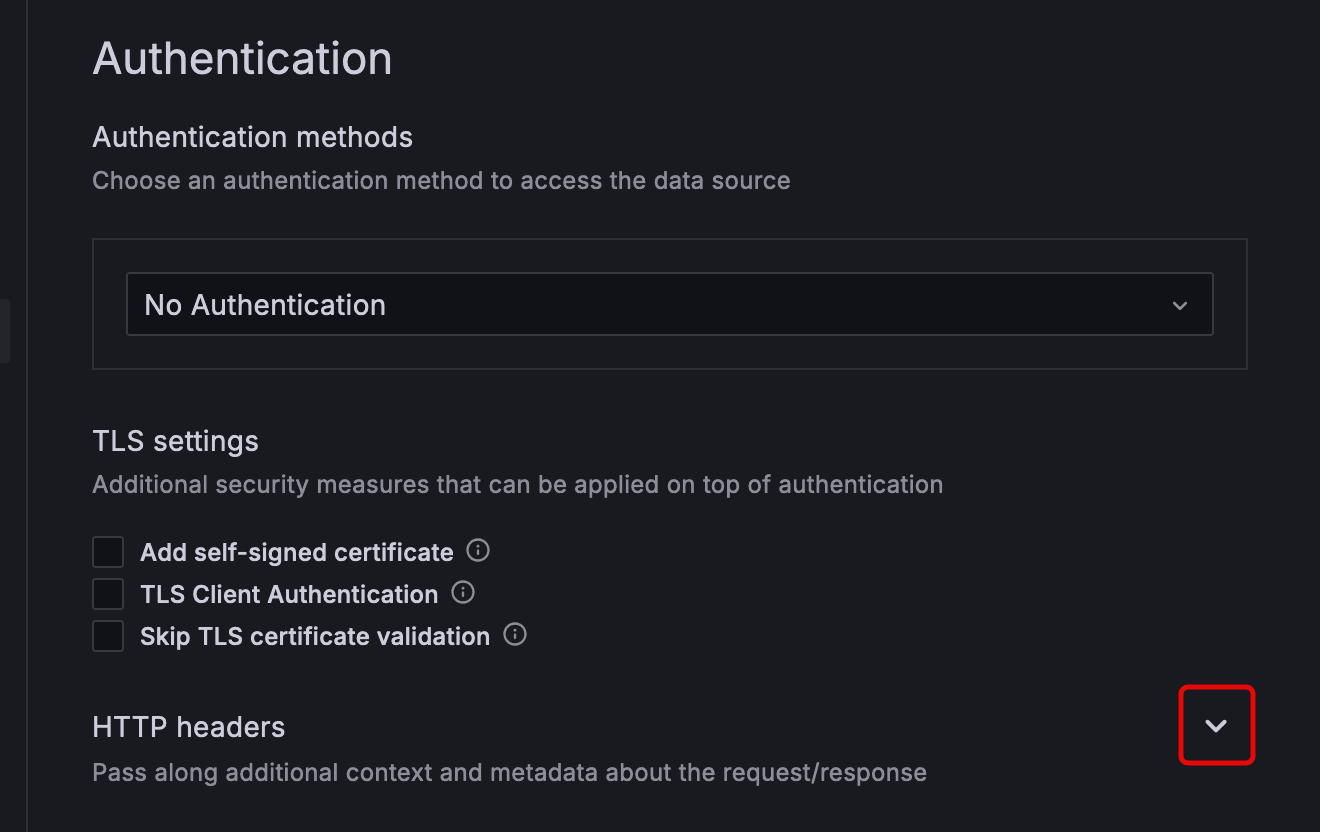
After you log in to Grafana with your admin credentials, you must configure credentials for the CoreWeave-provided data sources so Grafana can authenticate to the CoreWeave observability backend. First, configure the CoreWeave Metrics data source.Configure the data source HTTP headers
The following HTTP header values are required to connect to CoreWeave’s data sources, where[MY-TOKEN] is your CoreWeave API Access Token.
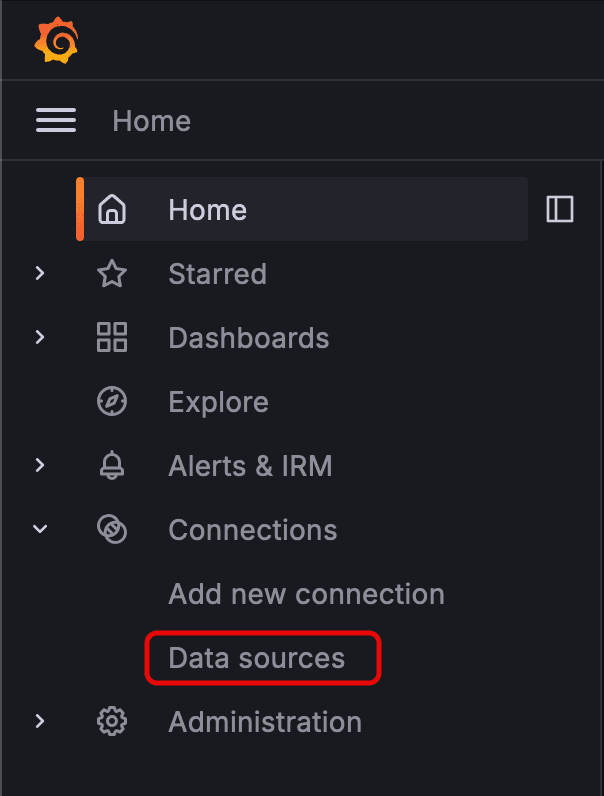
To configure these headers, navigate to Connections from Grafana’s left-hand menu to display the dropdown options. Then, click Data sources to proceed to the Data sources page. Select CoreWeave Metrics from the options listed to proceed to the Settings menu for the new data source.
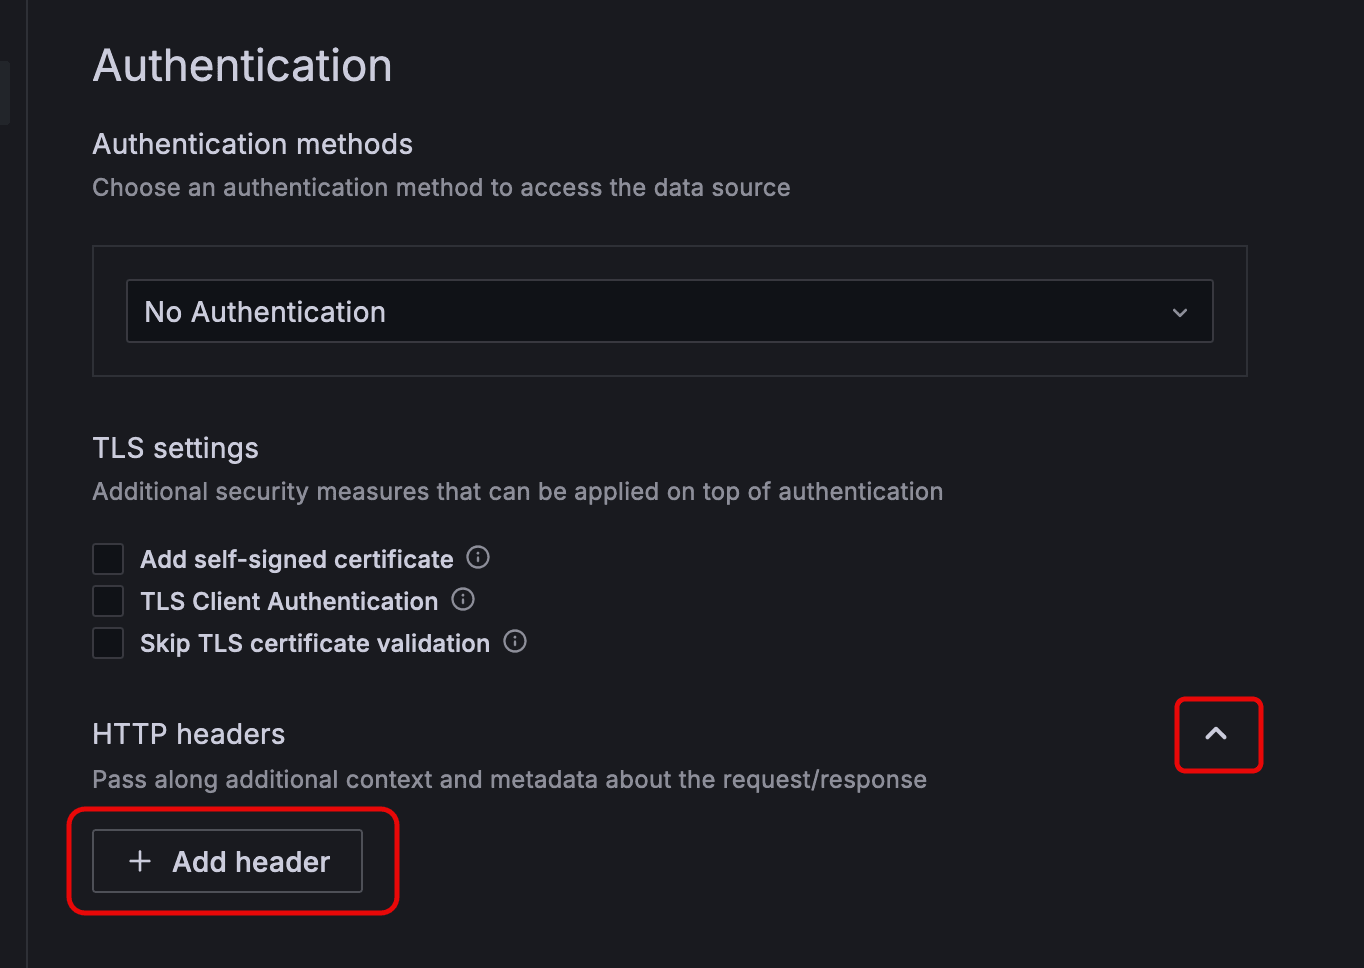
Authorization.
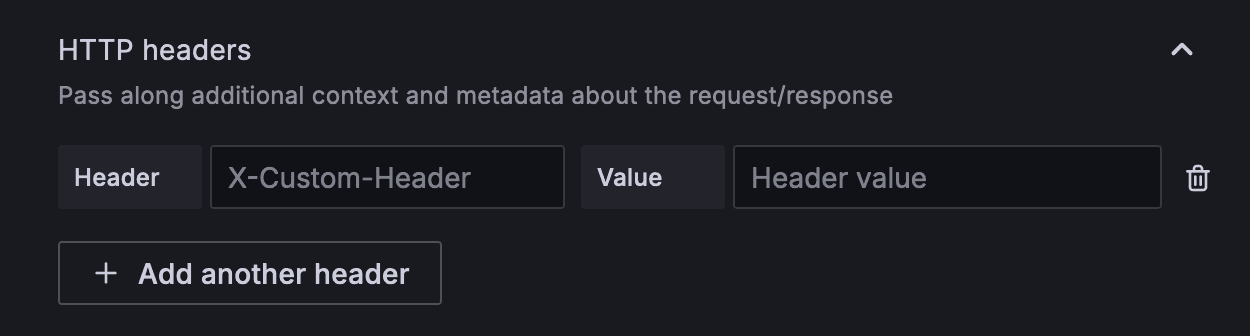
Bearer [MY-TOKEN], where [MY-TOKEN] is your CoreWeave API Access Token.
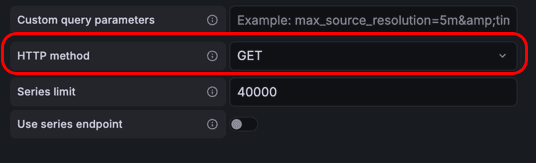
Configure the HTTP method to use GET by changing the HTTP dropdown method in the Other subsection to GET:
Configure the CoreWeave Logs data source
After the configuration for the CoreWeave Metrics data source is complete, repeat the preceding steps for the CoreWeave Logs data source. With both data sources configured, your self-hosted Grafana instance can query CoreWeave metrics and logs.Learn more
For more information, explore the following resources:- Custom GPU utilization alerts to create Grafana-managed alert rules that monitor GPU utilization across your cluster.
- Grafana documentation for guidance on tasks such as building dashboards, working with data sources, and exploring metrics.
- Prometheus Query Language (PromQL) documentation to learn how to query the CoreWeave Metrics data in both ad-hoc Explore queries and advanced dashboard panels.