

Healthy status, add a Node Pool to give it compute capacity. For a complete worked example that creates a cluster, adds a GPU Node Pool, and deploys a model, see Deploy an open source LLM on CKS.
Before you begin
Before you create your first cluster, confirm the following:- Your CoreWeave organization and team are set up, and your user has permission to create clusters. See Organizations and users.
- Your organization has cluster and GPU quota available in the Zone where you plan to deploy. See Resource quotas.
- You have chosen a Region and Zone for the cluster. See About Regions and Availability Zones.
Create a cluster using the Cloud Console
To create a new CKS cluster using the Cloud Console, open the Cluster Dashboard. From here, you can create new CKS clusters, or view and manage deployed ones. If you don’t yet have any clusters, this dashboard is empty: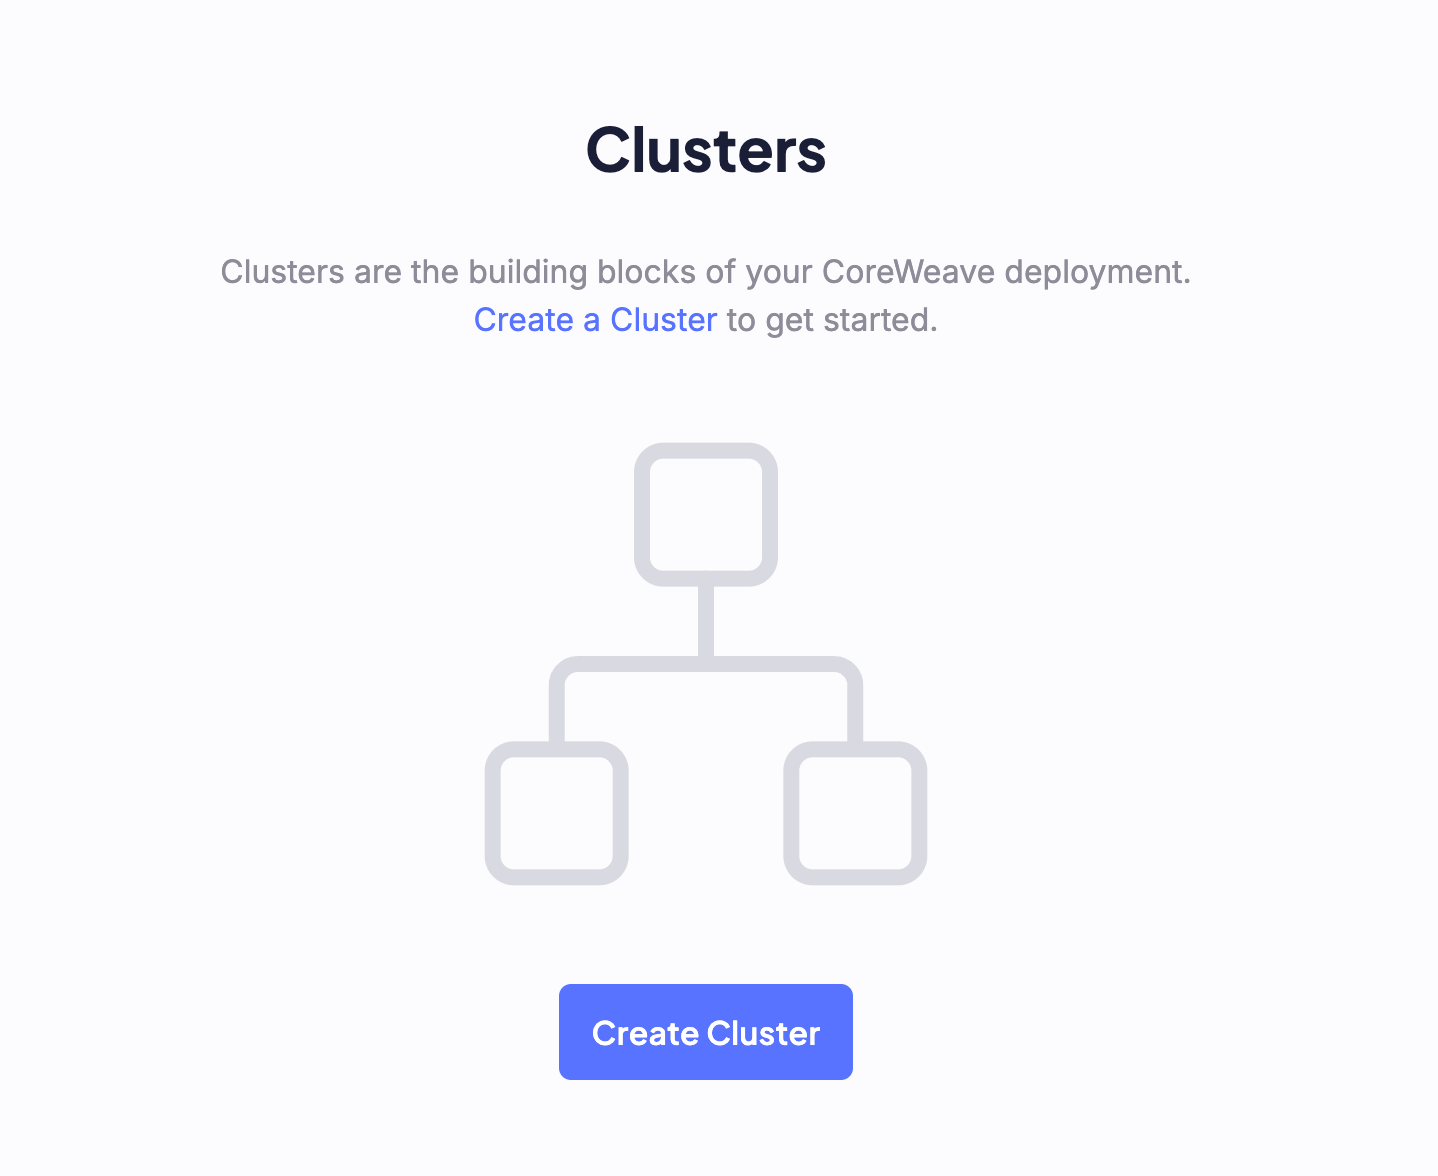
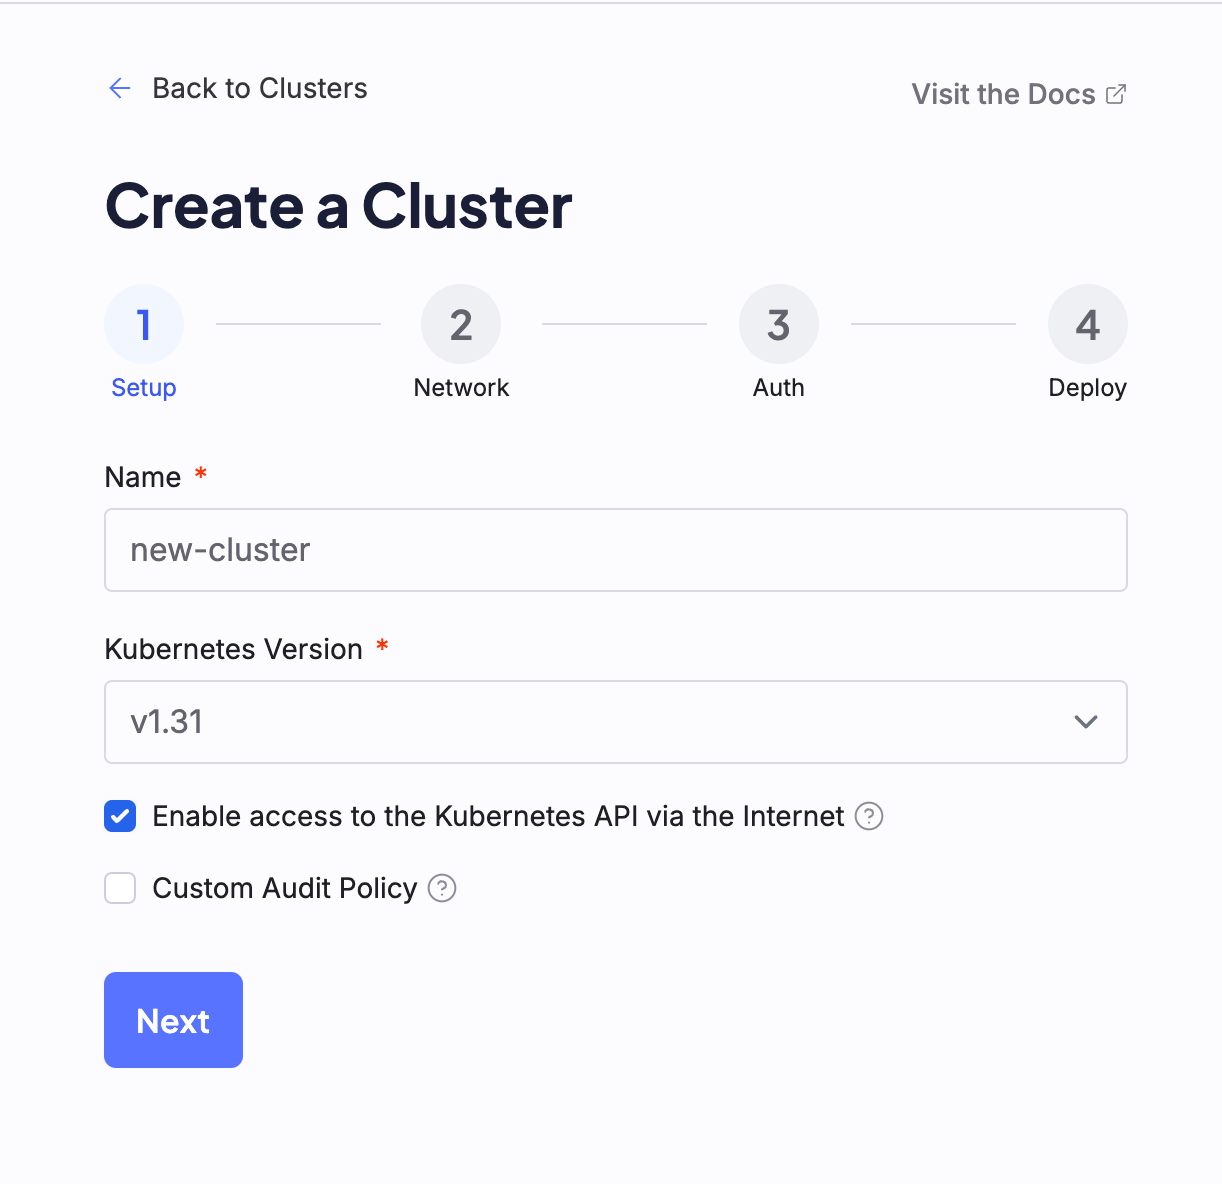
1. Setup
Give your cluster a name. Reflect the location in the name so clusters stay organized at scale. Here are some guidelines:- Keep names short and put the location first so that they group together naturally in reports.
- Use only lowercase letters, numbers, and hyphens to keep names compatible with URLs and automation.
- Avoid mutable details like Kubernetes version, Node Pool sizes, or temporary attributes that may change.
[short_name] is a concise descriptor of an environment, lifecycle, or workload:
use04a-[short_name], such asuse04a-prodoruse04a-stagingus-east-04a-[short_name], such asus-east-04a-prodorus-east-04a-staging
To learn more about cluster Audit Policies, see the official Kubernetes documentation.
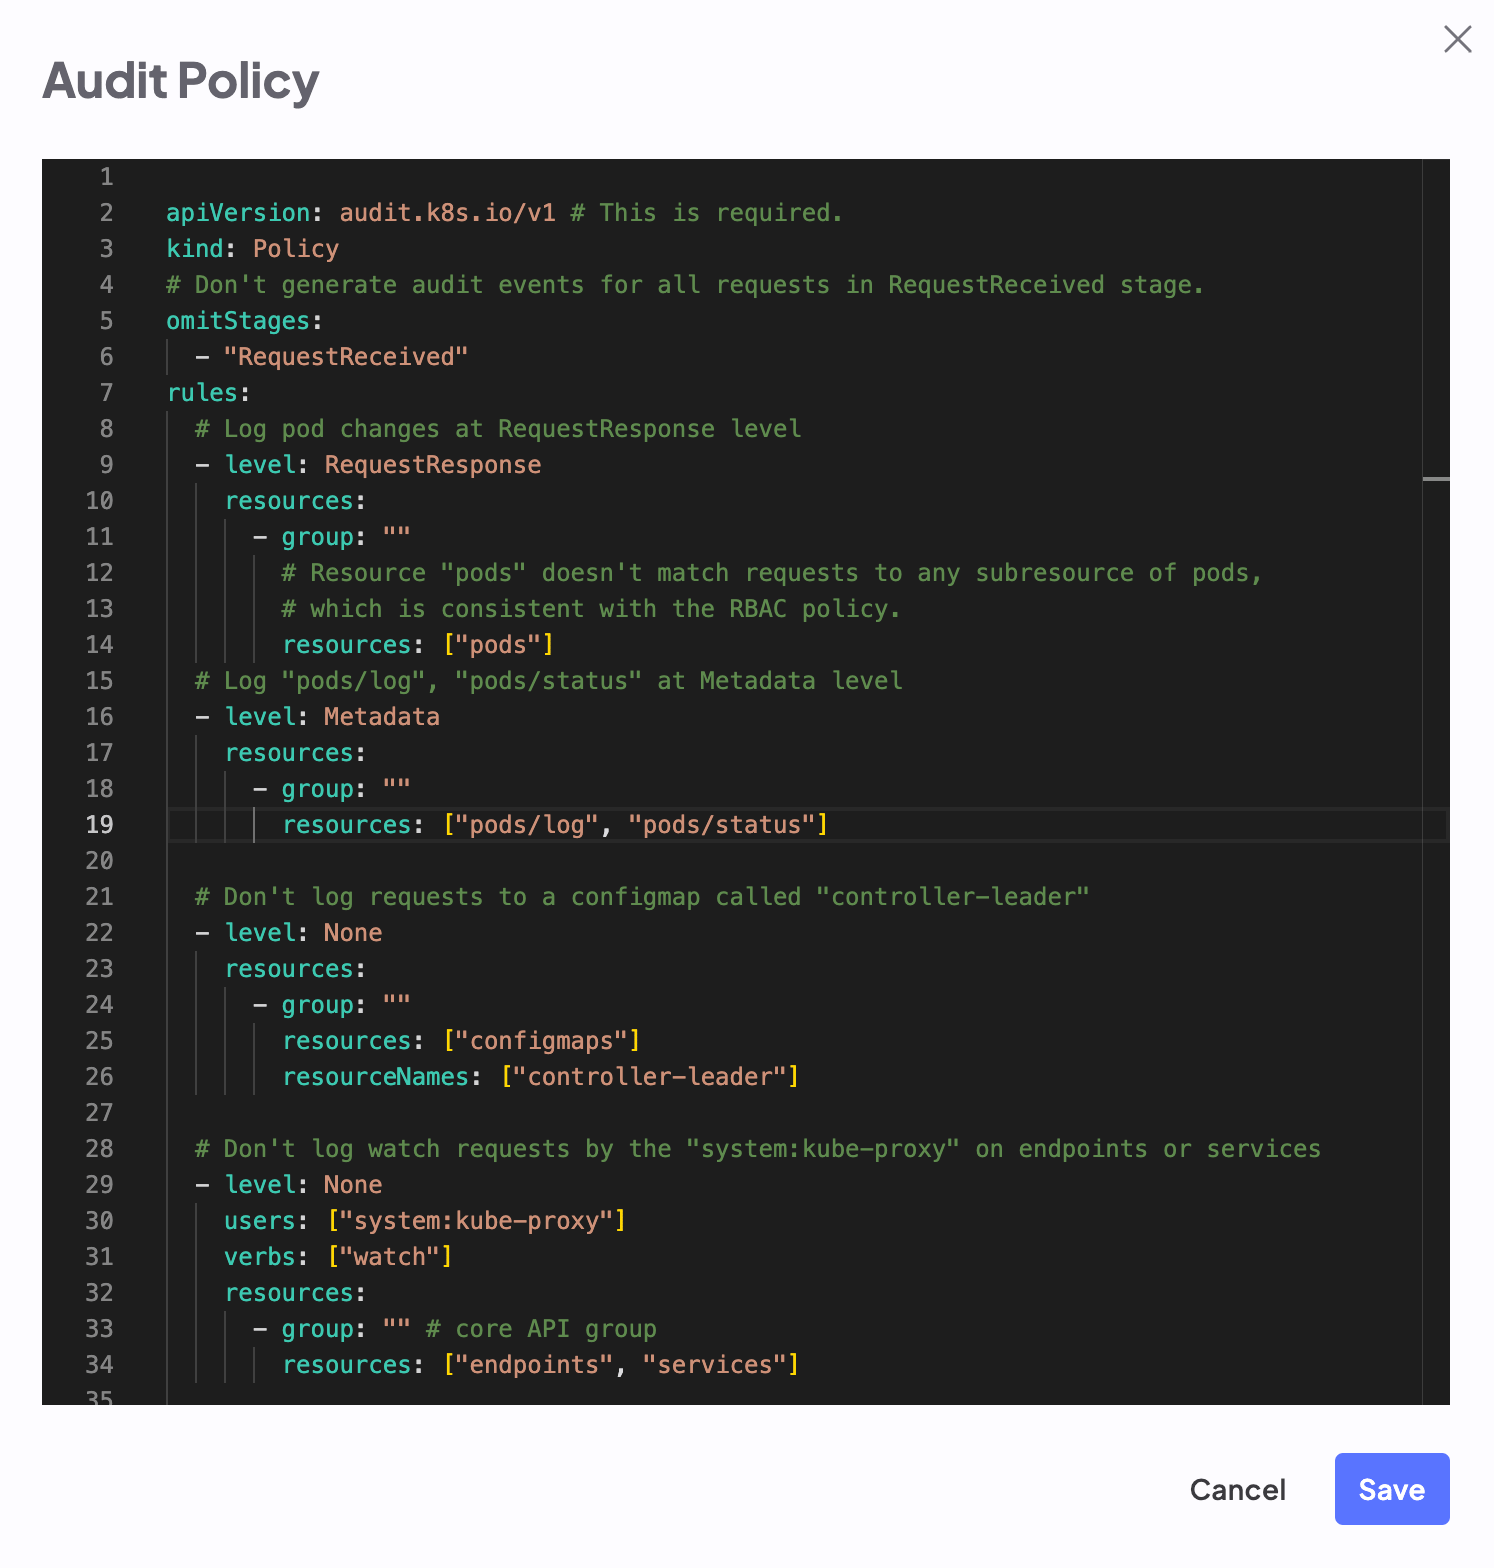
Default cluster audit policy
Default cluster audit policy
audit-policy.yaml
2. Network
Configure the network settings for the cluster. On the Network configuration page, first select the Super Region where you want to deploy the cluster. Then, select the Zone.Zone availability is subject to capacity.
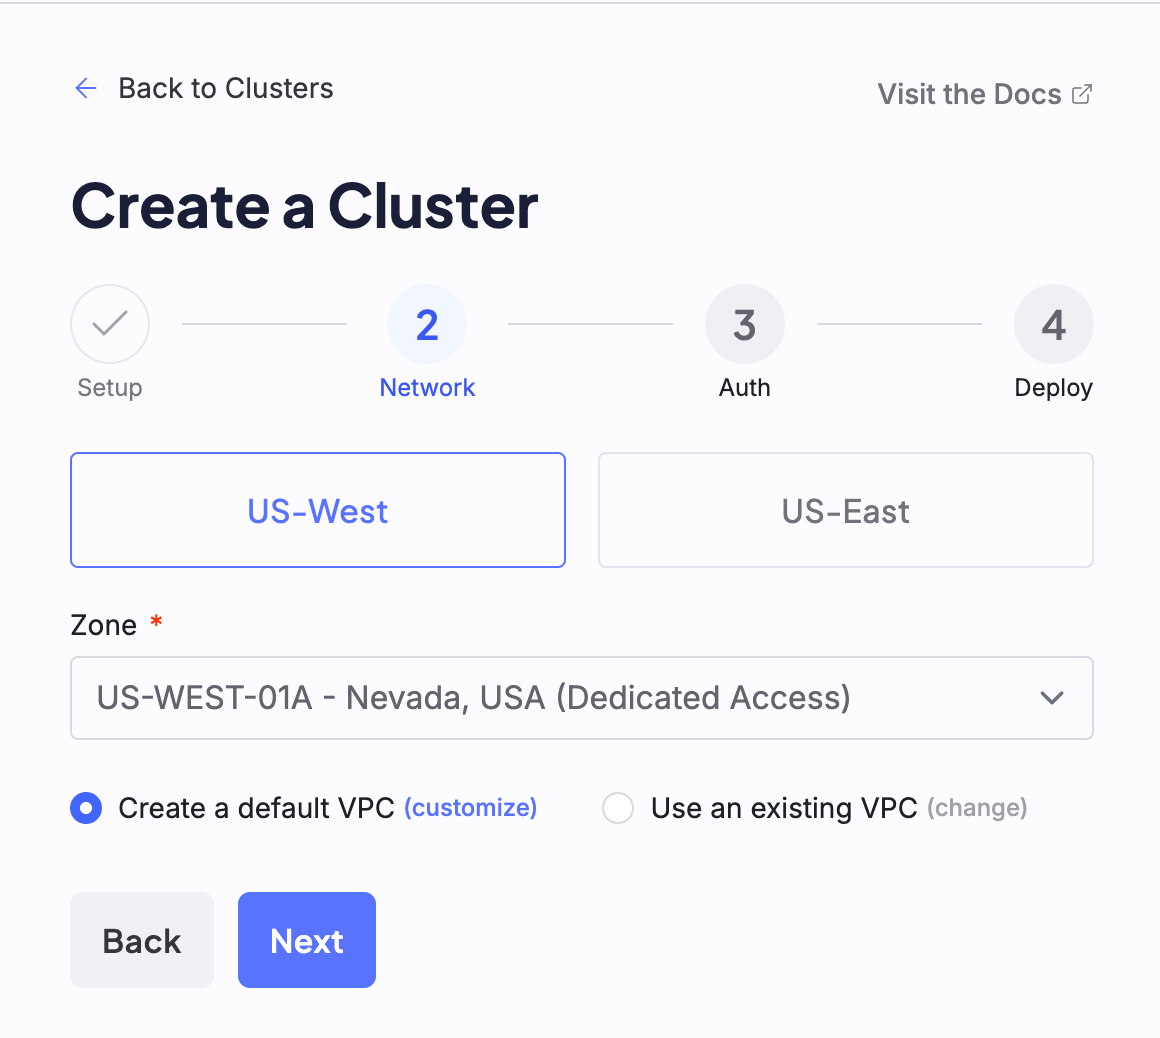
Select a VPC
If you already created a VPC to use with this cluster, select the same Zone where you deployed that VPC. Otherwise, you can either use a default VPC that CoreWeave creates for you during this process, or create a new custom VPC. You can still customize default VPCs from this page by clicking the Customize option beside the Create a default VPC radio button.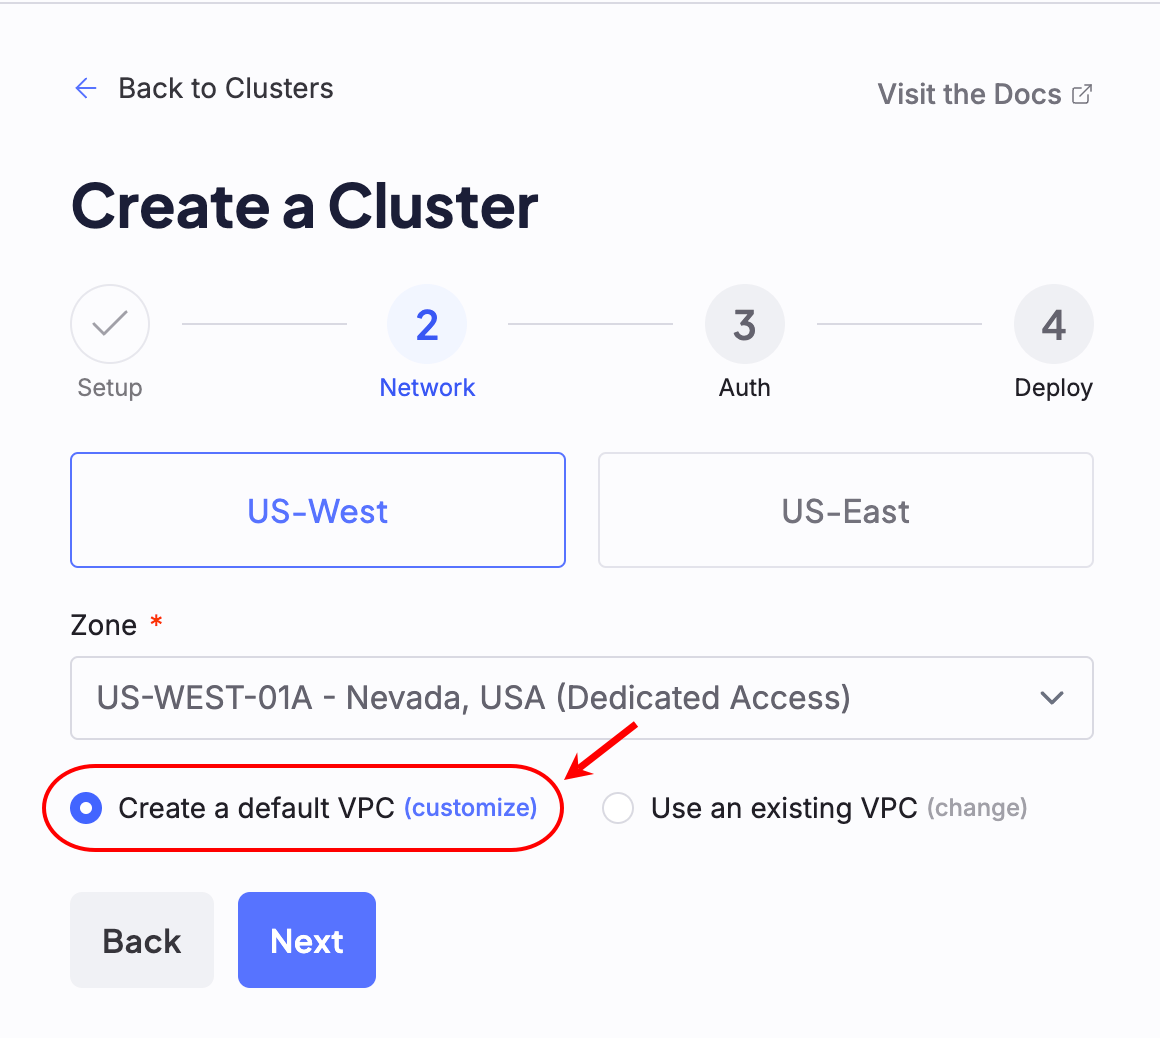
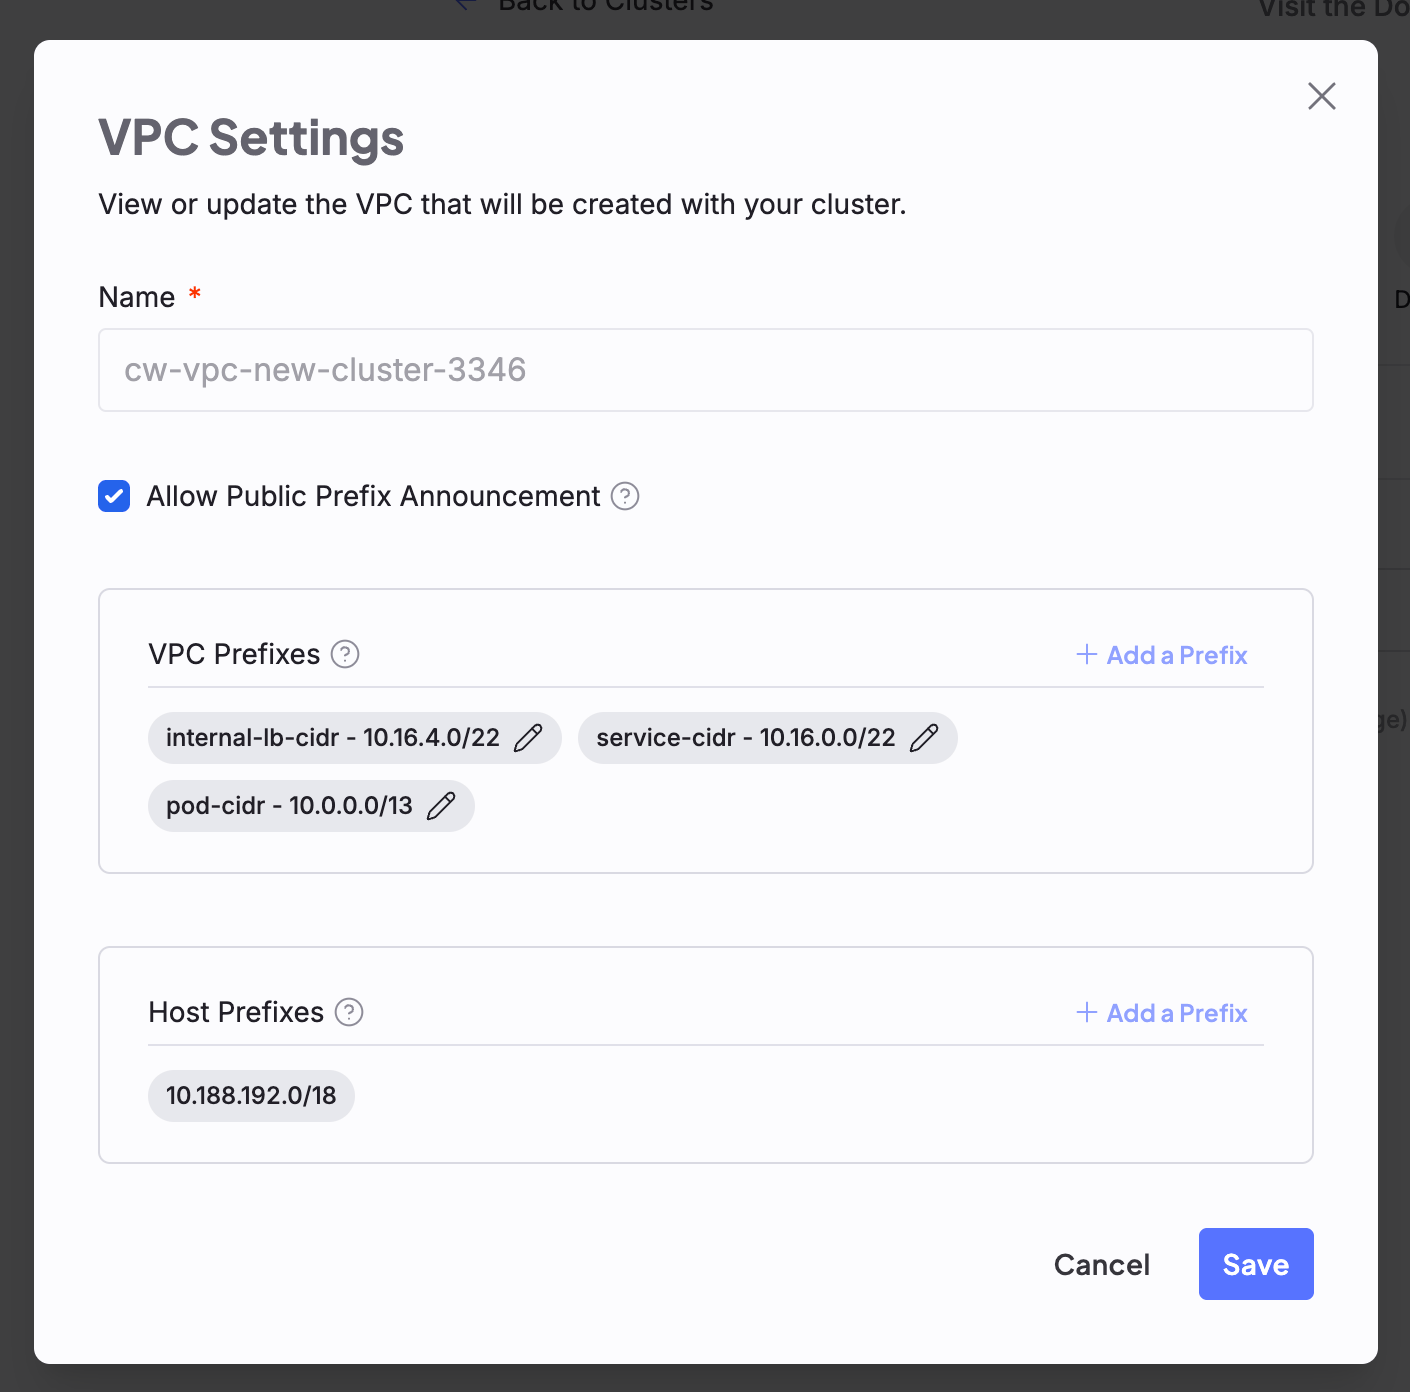
Each Zone has its own default prefixes, which populate default VPCs. You can change these. Refer to Regions to see each Zone’s default prefixes.
3. Auth
The Auth screen is where you configure how the cluster handles authentication and authorization. All settings on this screen are optional: you can add an authentication webhook, an authorization webhook, and OIDC, or skip them all and click the Next button to continue without changes. When you select any of these options, additional configuration fields appear.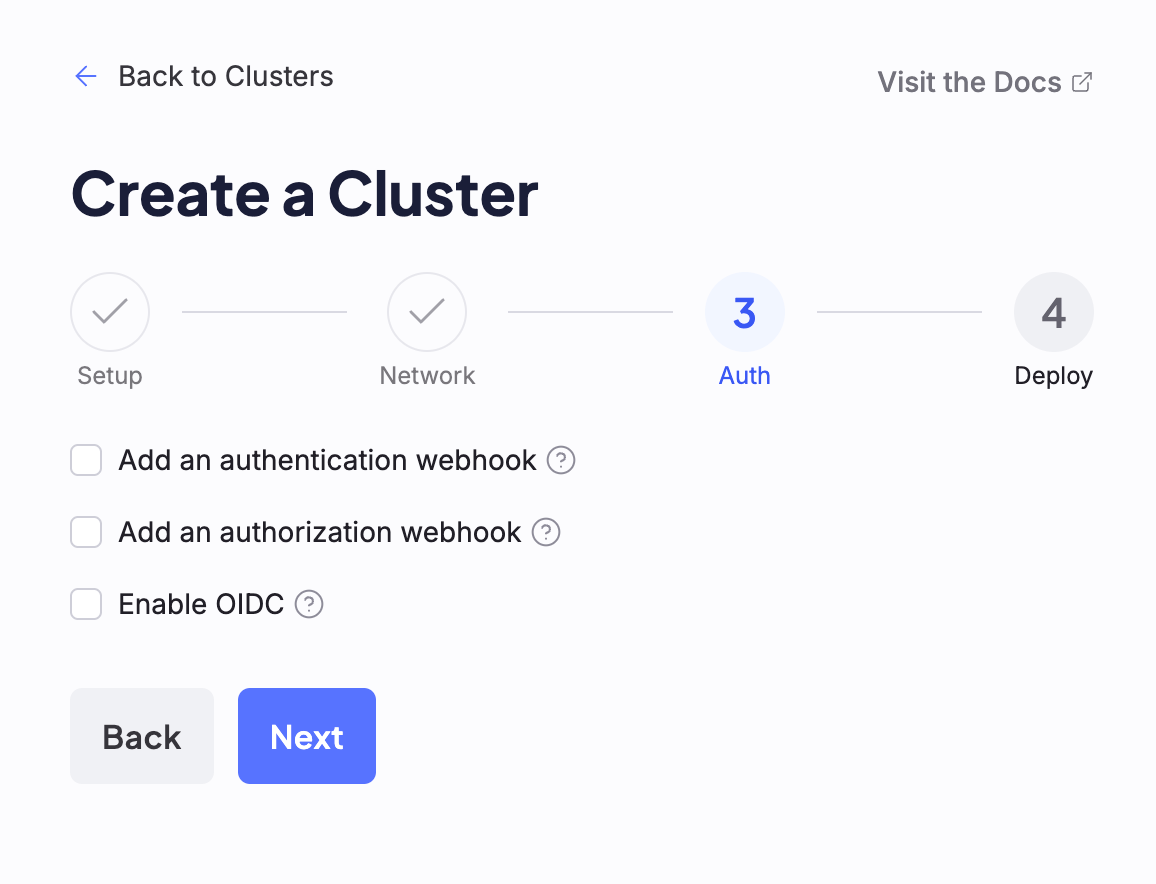
Add an authentication webhook
When you select the Add an authentication webhook checkbox, the Server and Certificate Authority fields appear. To configure the webhook, you must provide a URL in the Server input field, and can optionally include a Certificate Authority.To learn more about Webhook authentication in Kubernetes, see the official Kubernetes documentation.
Add an authorization webhook
When you select the Add an authorization webhook checkbox, the Server and Certificate Authority fields appear. To configure the webhook, you must provide a URL in the Server input field.To learn more about Webhook authorization in Kubernetes, see the official Kubernetes documentation.
Enable OIDC
To enable OIDC, the Issuer URL and Client ID fields are required. All other fields are optional.To learn more about OIDC for Kubernetes, see the official Kubernetes documentation.
Certificate Authority
Each of the authentication and authorization options provides an optional Certificate Authority checkbox. Selecting this checkbox opens a YAML editor where you can enter a Certificate Authority X.509 certificate.4. Deploy
The final step of cluster creation provides an overview of all options selected during the creation process. After reviewing and confirming the cluster’s configuration, click the Submit button to deploy the new cluster.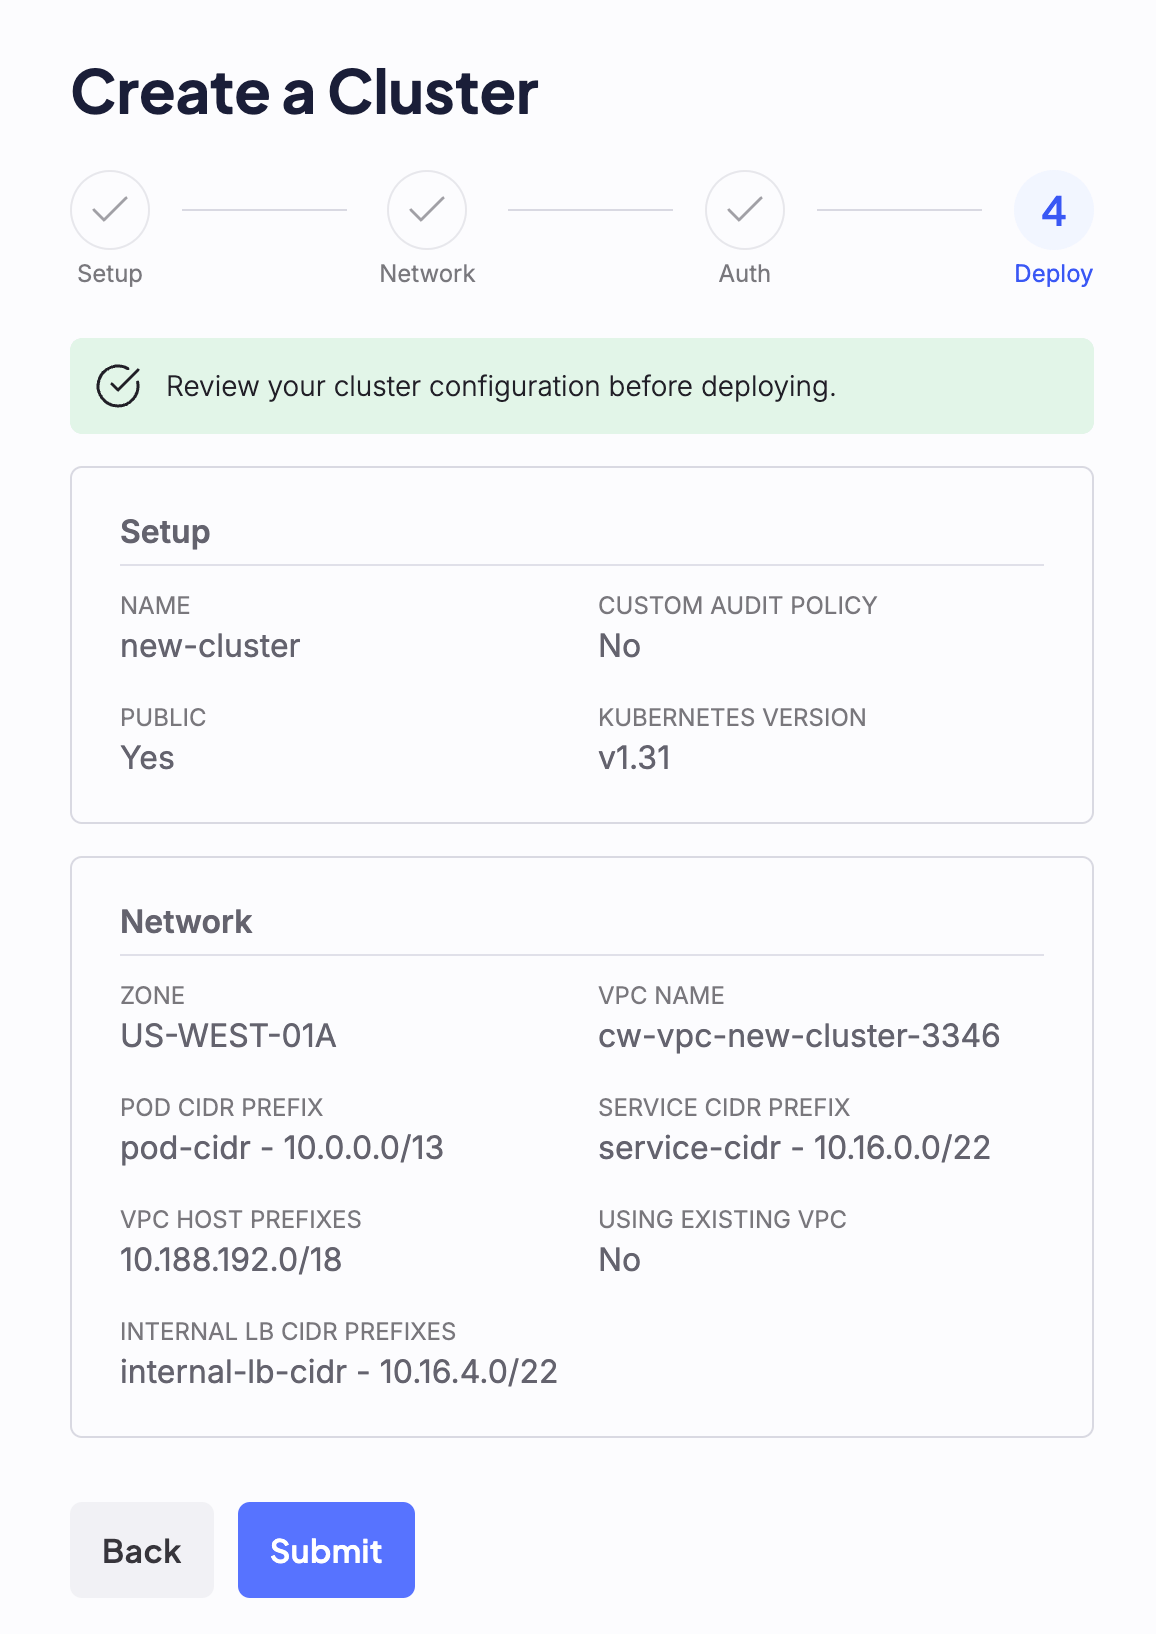
Creating. When a cluster is ready, its status changes to Healthy. If configuration or deployment issues occur, the cluster’s status changes to Unhealthy. For an explanation of what happens between Creating and Healthy, see Provisioning sequence and timing.
Create a cluster with Terraform
You can also create a cluster with the CoreWeave Terraform provider. A CKS cluster requires a VPC, so the example below creates acoreweave_networking_vpc resource and references it from the coreweave_cks_cluster resource.
This example covers the minimum needed to create a cluster. For the full list of fields, accepted values, and nested attributes, see the reference pages for coreweave_cks_cluster and coreweave_networking_vpc.
1. Configure the provider
Add the CoreWeave provider and supply your API token. Replace[COREWEAVE-API-TOKEN] with your CoreWeave API token, which starts with CW-SECRET-. For all provider options, see the CoreWeave Provider reference.
provider.tf
2. Define the VPC and cluster
Define a VPC and a cluster in the same Availability Zone. The cluster references the VPC byid, and its pod_cidr_name, service_cidr_name, and internal_lb_cidr_names values must match vpc_prefixes names defined on the VPC.
main.tf
| Terraform field | Console step | Where you set it |
|---|---|---|
name (cluster) | Setup | Cluster name |
version | Setup | Kubernetes version dropdown |
public | Setup | Kubernetes API internet-access selection |
zone | Network | Zone |
vpc_id | Network | Select a VPC |
pod_cidr_name, service_cidr_name, internal_lb_cidr_names | Network | VPC prefixes in the VPC customization screen |
name, host_prefixes, vpc_prefixes (VPC) | Network | VPC name, Host Prefix, and VPC prefixes in the VPC customization screen |
zone value determines the Region.
The coreweave_cks_cluster resource also supports optional settings that mirror the Cloud Console flow: an audit_policy block like the Setup step, and oidc, authn_webhook, and authz_webhook blocks like the Auth step. For their fields and an example that includes them, see the coreweave_cks_cluster reference.
3. Apply the configuration
From the directory that contains your.tf files, initialize the working directory, preview the changes, and apply them:
terraform init downloads the CoreWeave provider, terraform plan shows the resources Terraform will create, and terraform apply creates the VPC and cluster after you confirm. After Terraform applies the plan, the cluster appears on the Cluster Dashboard with the status Creating, the same as a Console-created cluster. See Provisioning sequence and timing for what happens next.
Provisioning sequence and timing
After you submit a cluster, CKS provisions it in stages. Knowing the sequence helps you understand what each status means and when the cluster is ready for workloads.- Control Plane provisioning. The cluster appears on the dashboard with the status
Creating. During this stage, CKS provisions the Managed Control Plane and its associated network configuration. - Control Plane
Healthy. When the Control Plane is ready, the cluster status changes toHealthy. At this point you can generate an access token and connect withkubectl. - In-cluster resource provisioning. A
Healthystatus reflects the Control Plane only. The cluster can still be provisioning required in-cluster resources, including required Control Plane Node Pools and required applications such as CNI and DNS. For the components that make up a cluster and where each one runs, see Cluster components. - Add Node Pools. A new cluster has no compute capacity until you add a Node Pool. After you create a Node Pool, its Nodes provision separately from the cluster. Node Pool provisioning can be delayed while the cluster is still being created, and provisioning can take up to 30 minutes. When the Node Pool status is
Healthy, the cluster has capacity to run workloads. See Deploy an open source LLM on CKS for a worked example.
Provisioning time varies with Zone capacity, the resources you request, and current demand. Use the status shown on the Cluster Dashboard and the Node Pool status as the source of truth rather than a fixed schedule.
View details of deployed clusters
To view more information about a deployed cluster, click the vertical ellipses menu beside the cluster name and select View Details. This opens the cluster’s current configuration in JSON, along with information about the cluster’s age, location, name, associated API endpoint, and current state. To return to the dashboard, close this panel.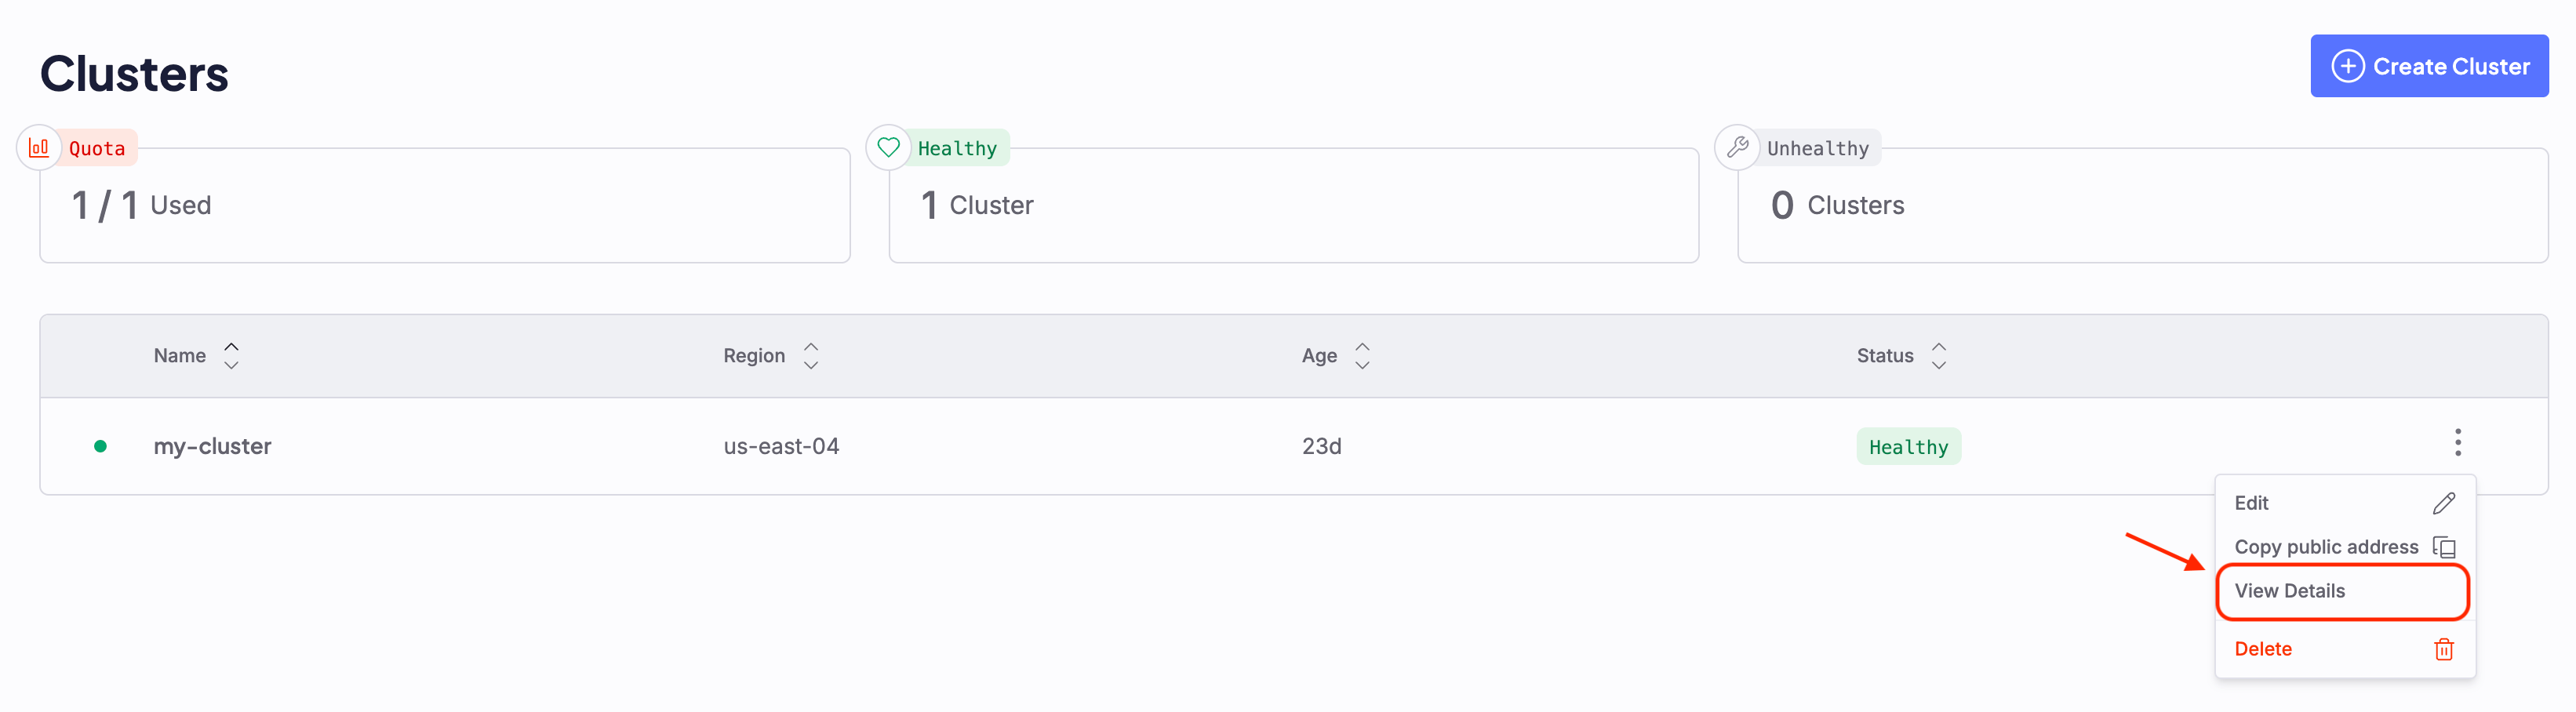
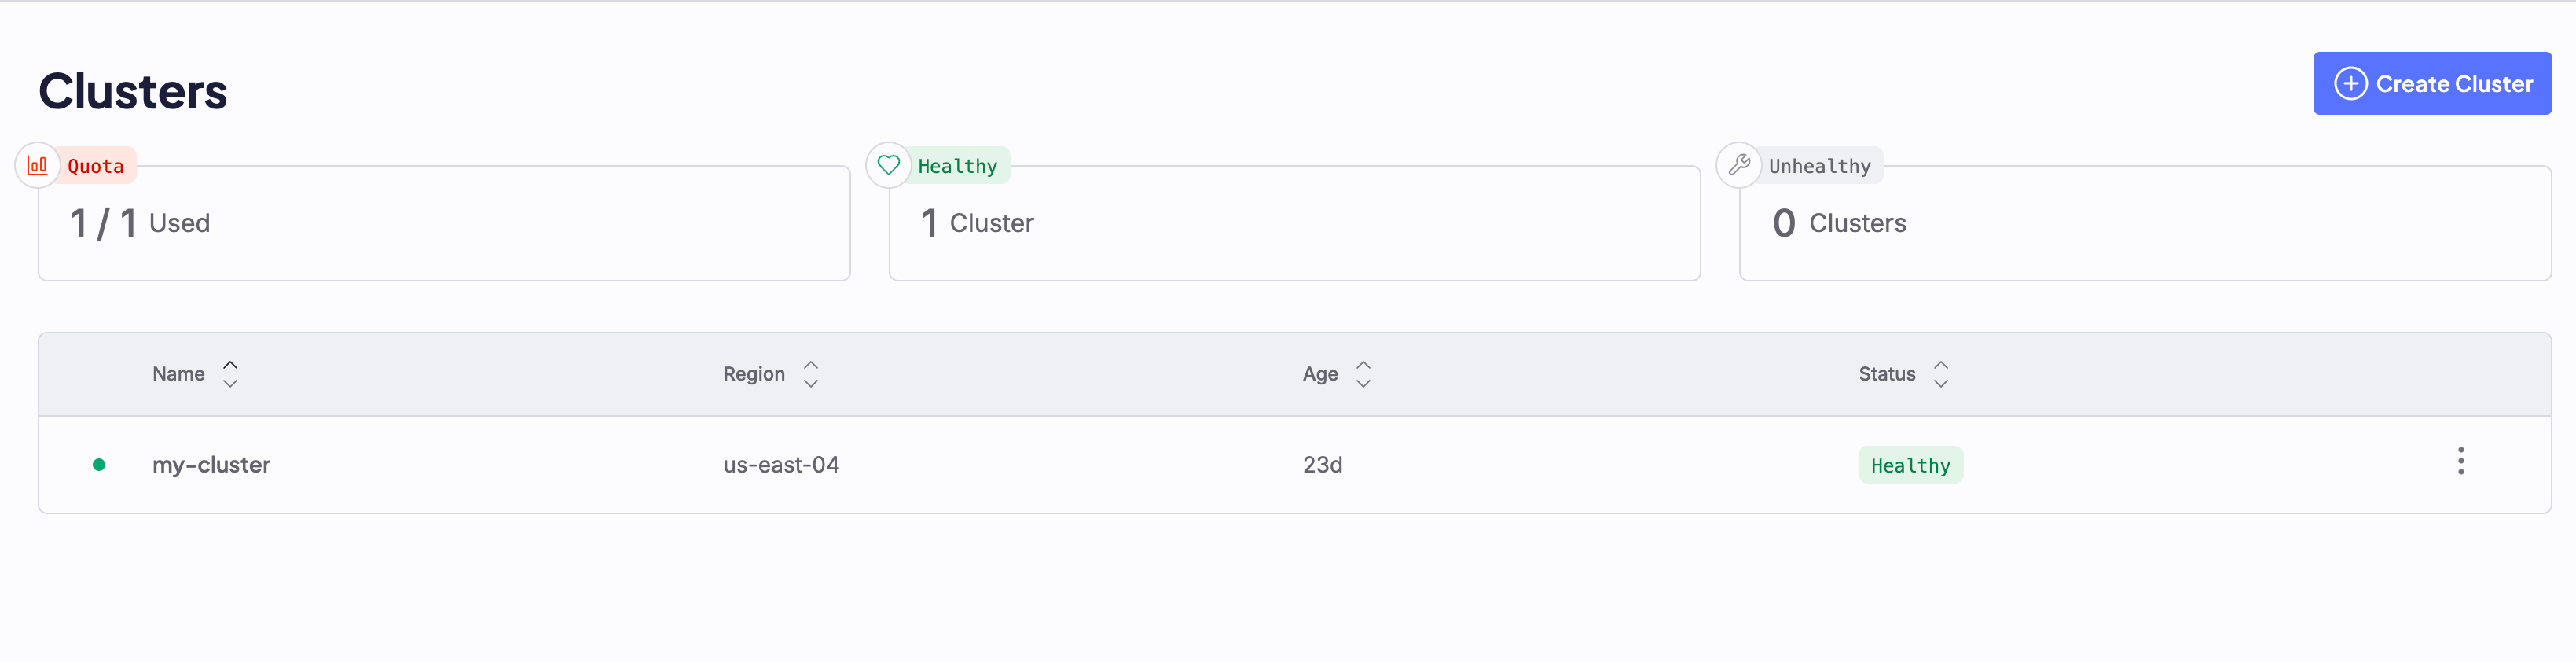
Cluster statuses
| Name | Description |
|---|---|
| Quota | Displays the number of CKS clusters your organization has deployed over the maximum limit of clusters defined by the organization’s quota. Represented as count/quota. If you haven’t yet created any clusters, or you have no quota assigned, the status shown is No Quota. |
| Healthy | Displays the number of healthy clusters deployed. In a healthy cluster, all Control Plane elements, servers, and Pods are in a Healthy state. The cluster is stable and responsive, and can manage workloads. |
| Unhealthy | Displays the number of unhealthy clusters. A cluster can become Unhealthy for many reasons, including Control Plane issues, unresponsive Nodes, failing Pods, network failures, or storage problems. |