

Overview
This is the final step of the deploy vLLM inference tutorial. Now that your vLLM inference service is running, you’ll learn how to monitor its performance using Grafana dashboards and test the autoscaling capabilities. This step covers access to metrics, alert setup, and autoscaling validation so you can confirm the deployment is healthy and responsive under load.Step 1: Access Grafana dashboard
Grafana is where you view the dashboards that visualize vLLM performance metrics. Get your Grafana URL:- Username:
admin - Password: You generated this in the Get Grafana credentials section.
Step 2: View vLLM metrics
The vLLM dashboard surfaces the runtime metrics you use to evaluate inference performance. In Grafana:- Go to Dashboards > Browse.
- Select the vLLM Dashboard.
- Monitor key metrics like:
- Token throughput
- Cache utilization
- Queue depth
Congratulations
You’ve deployed an open source LLM on CKS with observability for monitoring. The remainder of the steps on this page are optional. To free up your resources after completing this guide, be sure to complete the Cleanup steps.Step 3: Set up alerts (optional)
Configure Grafana alerts for important metrics like:- High error rates
- Elevated response times
- GPU memory usage
- Service availability
Step 4: Test autoscaling (optional)
If you installed KEDA, you can test the autoscaling behavior by generating sustained load and observing how the deployment scales in response.To scale on different metrics, you can create a custom
ScaledObject. For information about ScaledObject, see the KEDA ScaledObject specification.You can also change the autoscaling threshold in the helm values overrides: vllm.workload.deployment.autoscale.cacheUtilizationThreshold.Generate load
Use the included load testing script. Navigate to theinference/basic/hack/tests directory and run the load test against your endpoint. The test takes a few minutes to complete.
results.json, you should see something similar to the following:
Monitor scaling
Watch the Pods scale up based on demand: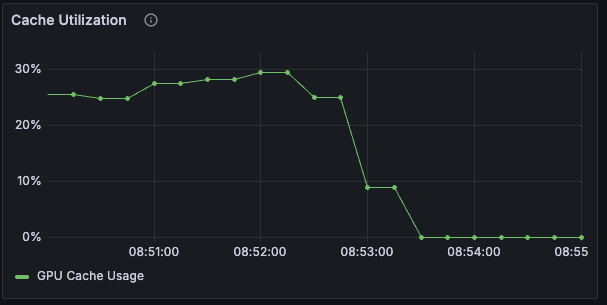
Step 5: Using your inference service (optional)
The vLLM service exposes an OpenAI-compatible API, so you can call it from any client that already supports OpenAI. The following examples show two common patterns.Python OpenAI client
Use the standard OpenAI Python library:base_url and model variables:
base_url=f"https://basic-inference.cw**-infer.coreweave.app/v1"model="meta-llama/Llama-3.1-8B-Instruct"
Streaming responses
For real-time applications, use streaming:Step 6: Advanced configuration (optional)
The following sections describe optional configuration changes you can make to adapt the deployment to larger models, alternate models, or different resource profiles.Multi-node deployment
For larger models, enable multi-node deployment by setting:Custom model configuration
To use a different model, update your values file:Resource tuning
Adjust resource requests and limits based on your model size:Cleanup
When you’re finished with the tutorial, remove the deployment and supporting resources so you don’t incur ongoing costs. Run the following commands to tear down the vLLM deployment, monitoring stack, autoscaling, ingress, certificates, and namespaces:Next steps
Now that you have a working vLLM deployment, consider:- Adding authentication: Implement API key validation or OAuth.
- Model routing: Deploy multiple models with traffic routing.
- Cost optimization: Set up Node autoscaling and instance usage.
- Advanced monitoring: Configure custom alerts and dashboards.
- CI/CD integration: Automate deployments with GitOps workflows.