To view the dashboard, go to the Slurm Block Topology dashboard.
For instructions about accessing CoreWeave Grafana dashboards, see Access and use CoreWeave Grafana dashboards.
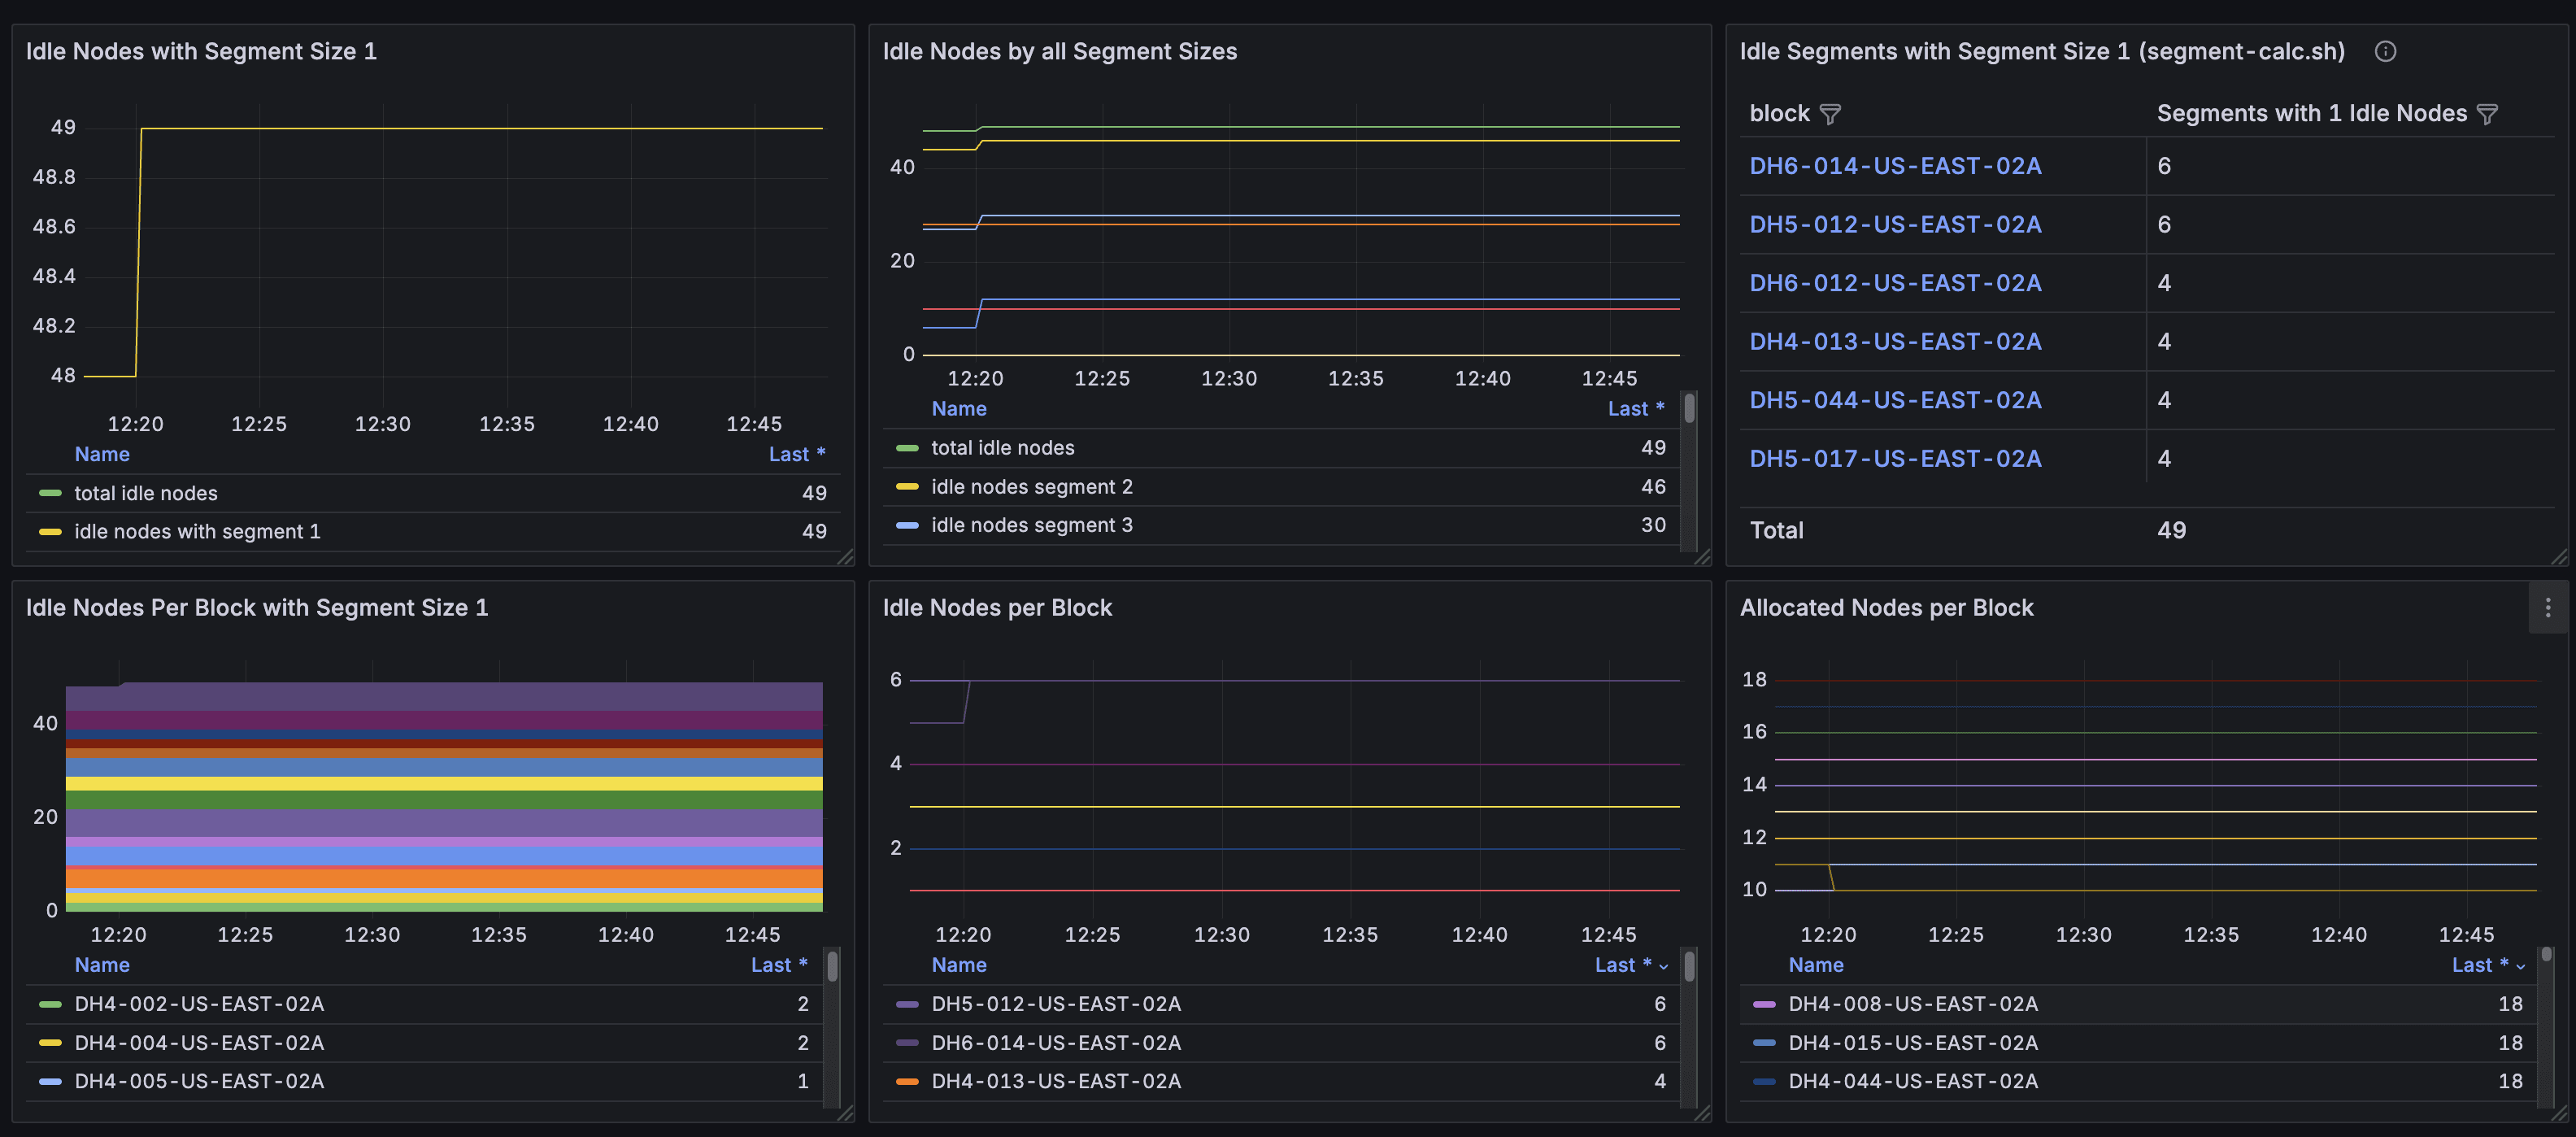
Slurm Block Topology Dashboard The Slurm Block Topology dashboard shows the availability, allocation, and status of compute Nodes, specifically organized by a block topology. The Slurm Block Topology dashboard is especially helpful for visualizing and understanding metrics for GPUs connected through rack-level NVLink fabrics like the GB200 and GB300 instance types. For documentation related to segment size, see the segments section in Topology/Block Scheduling in Slurm.

Per-job allocation panels

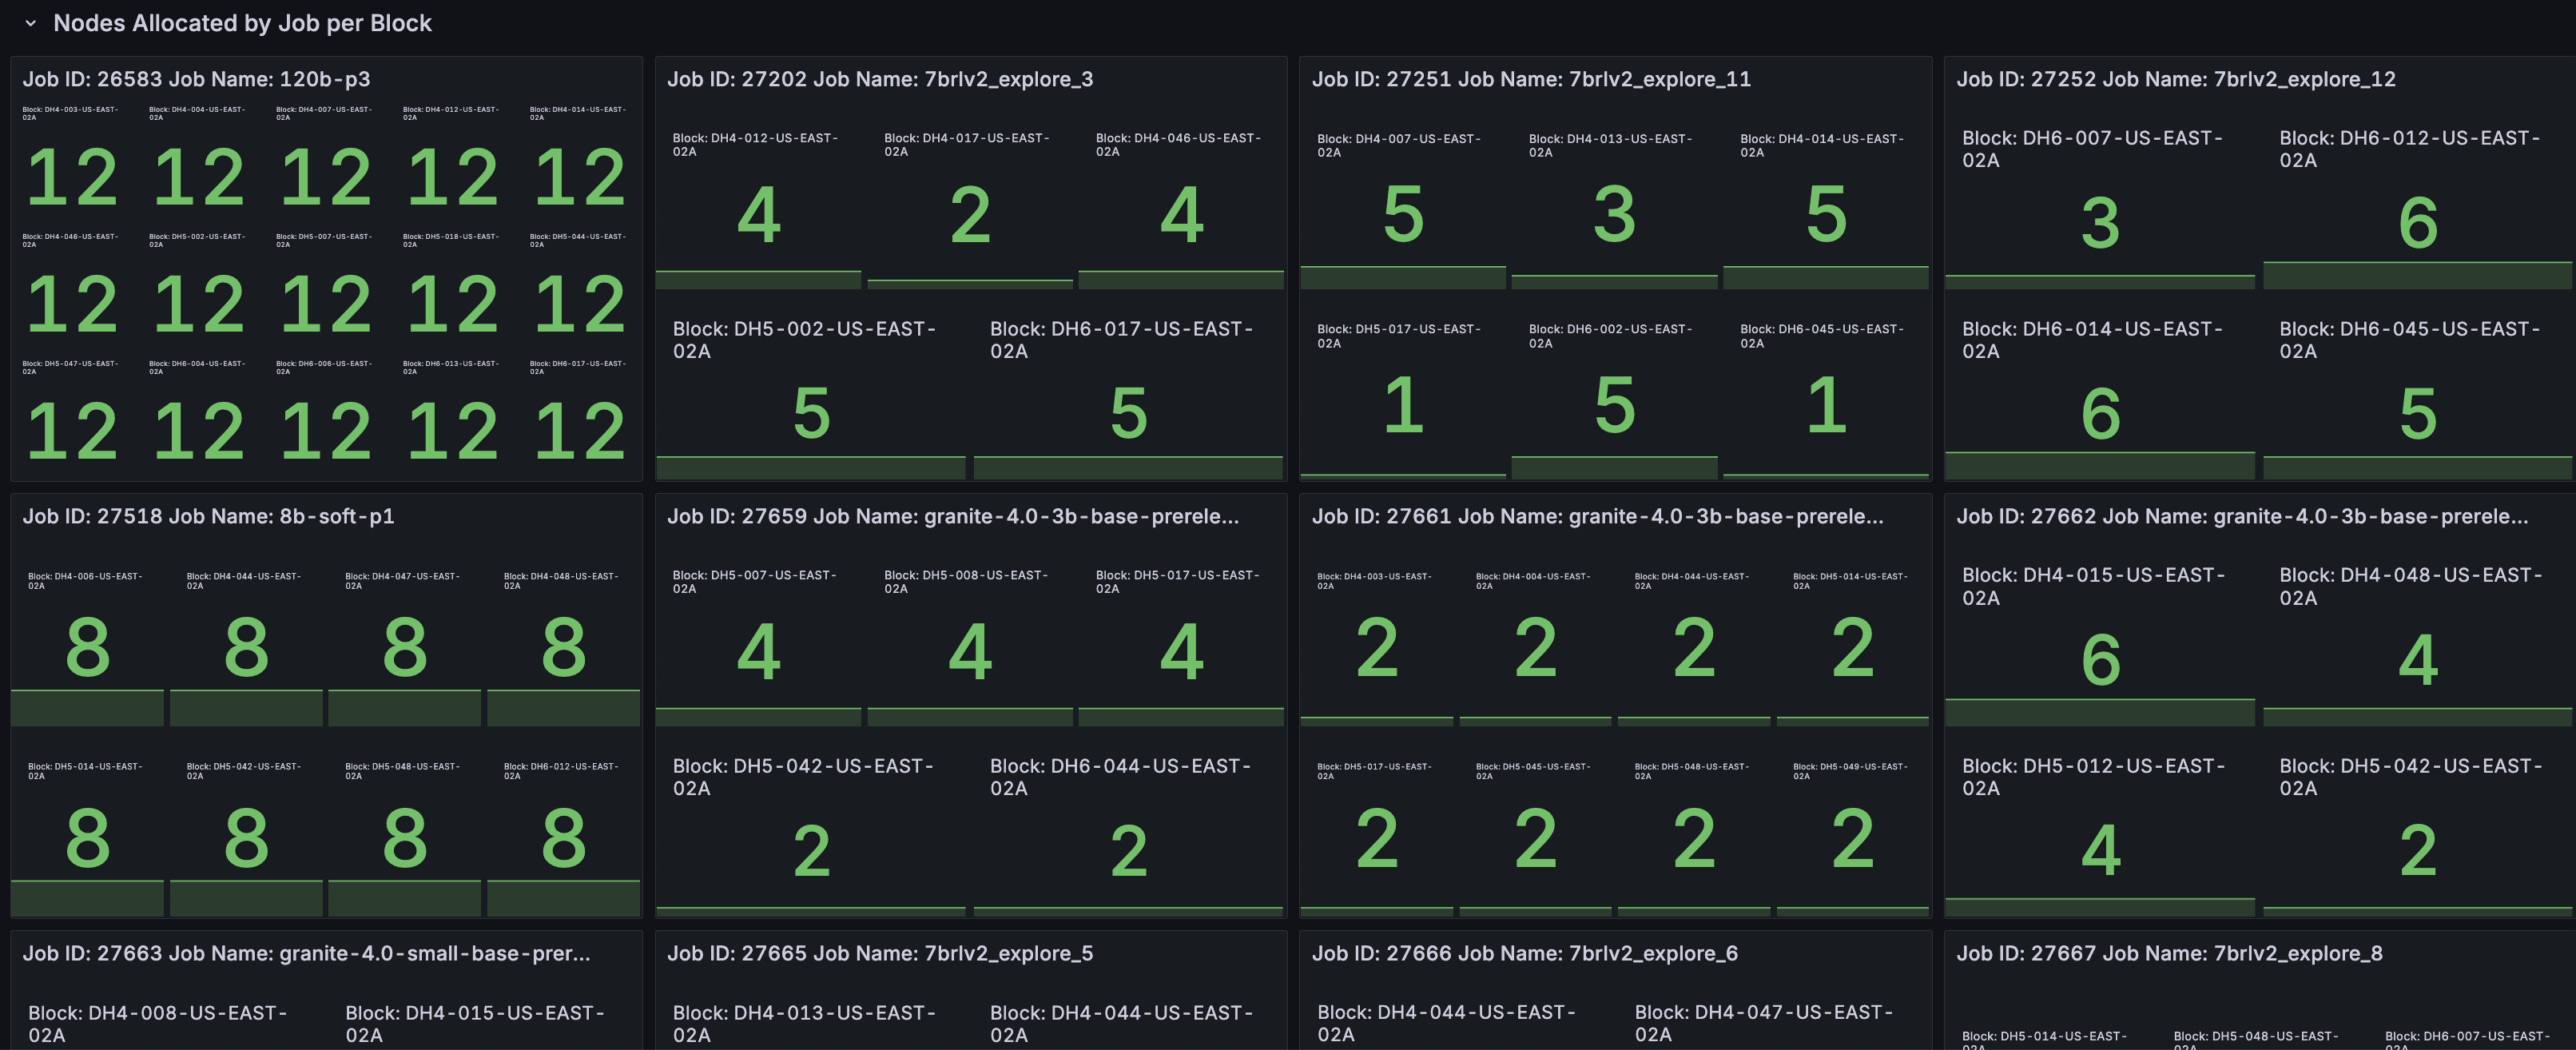
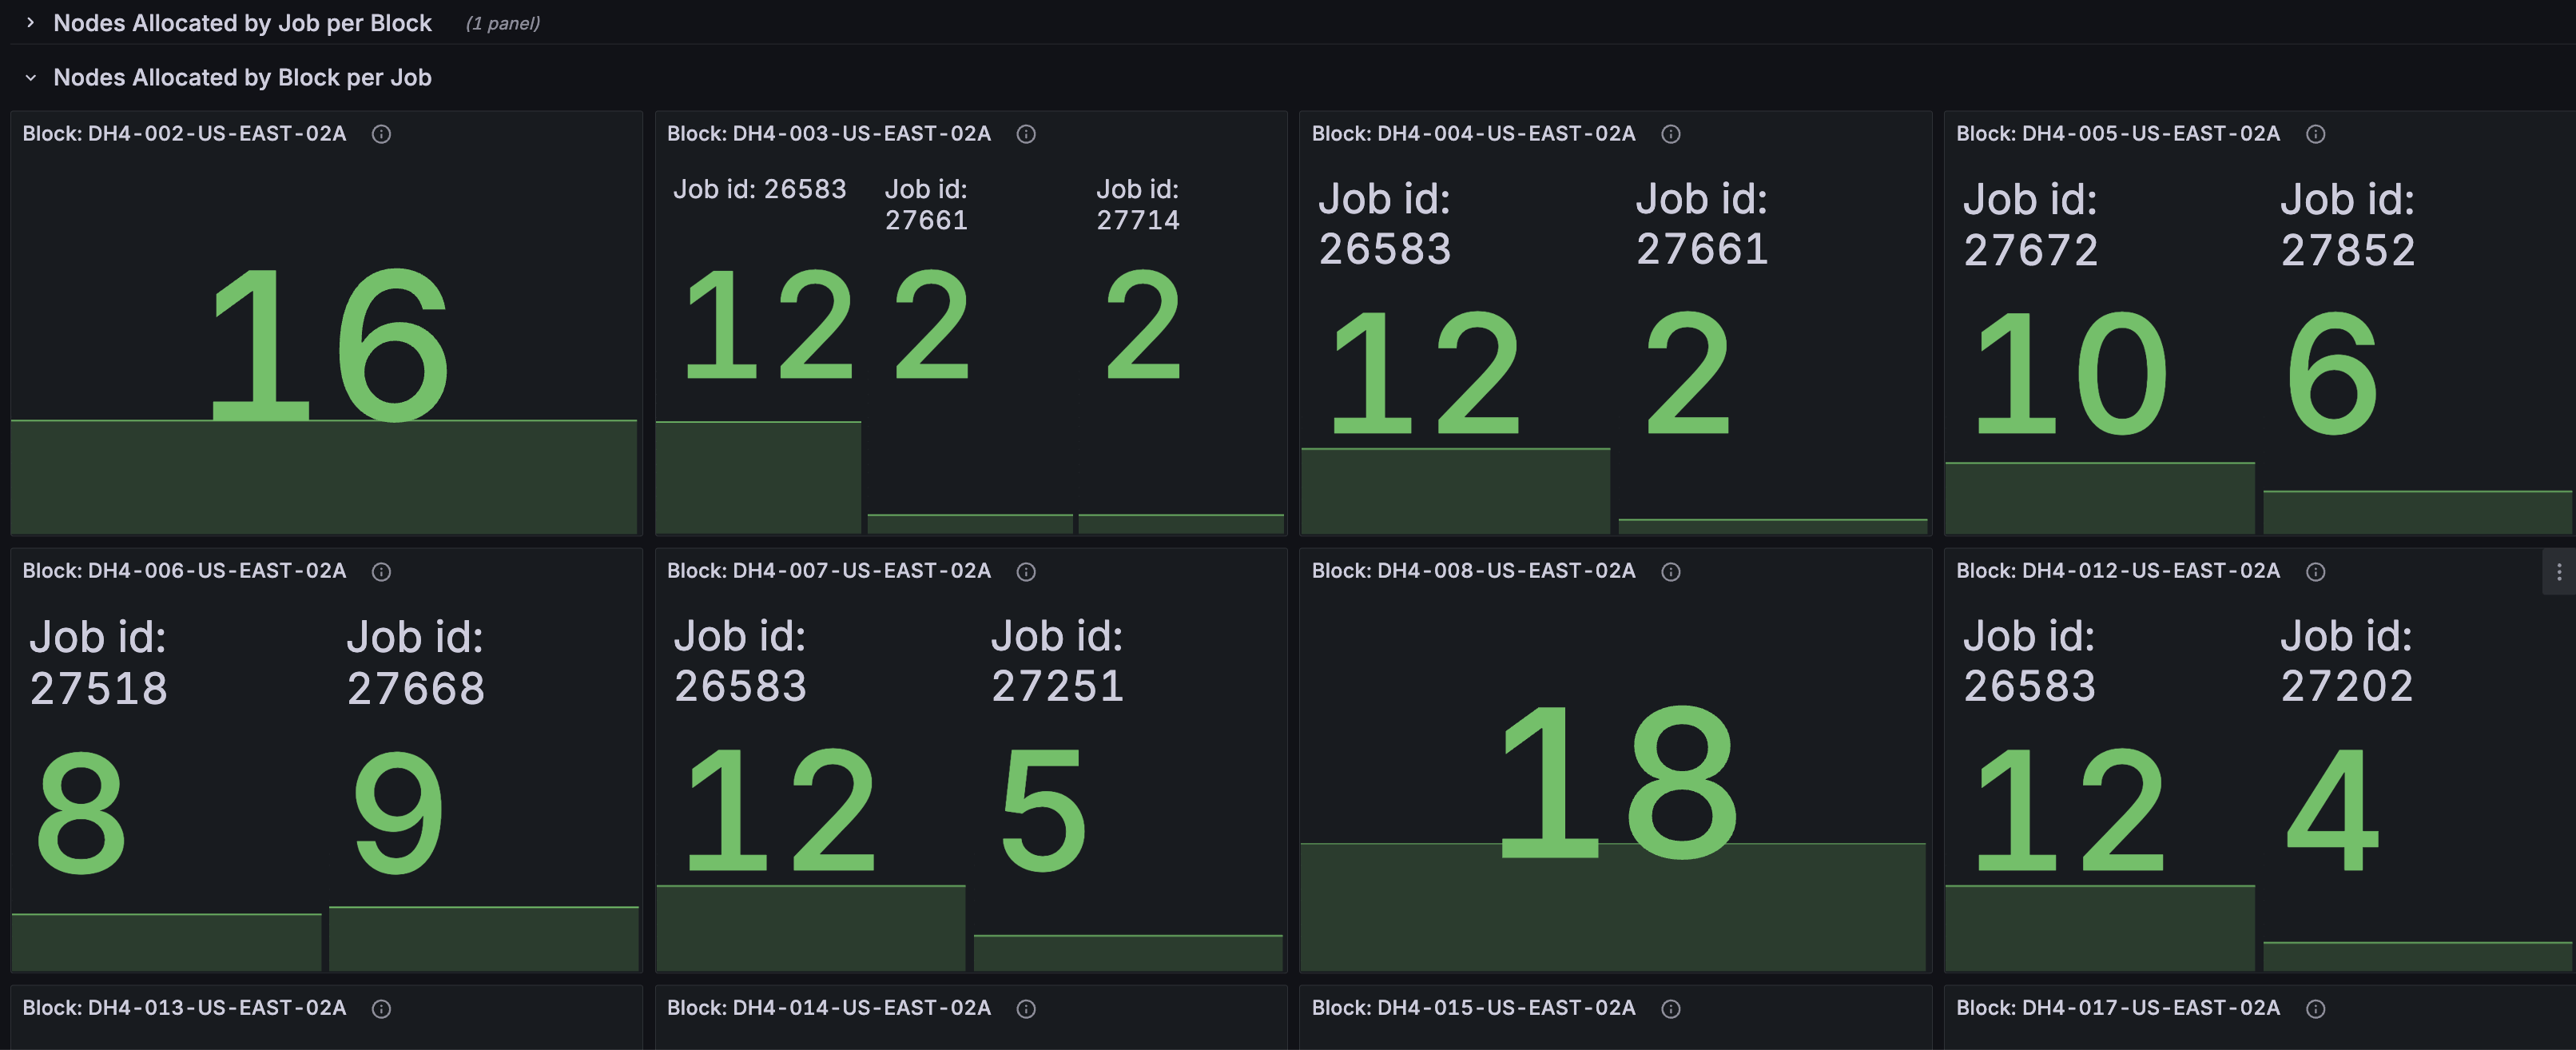
The dashboard also includes two panels that break down per-job allocation across blocks. These panels help you understand how running jobs are distributed across the cluster’s block topology. The following screenshot shows the Nodes Allocated by Job per Block panel: Nodes Allocated by Job per Block panel. The following screenshot shows the Nodes Allocated by Block per Job panel: Nodes Allocated by Block per Job panel.
Last modified on June 10, 2026