1. Log a table
Log a table with Weights & Biases. You can either construct a new table or pass a Pandas Dataframe.- Construct a table
- Pandas Dataframe
To construct and log a new Table, you will use:
wandb.init(): Create a run to track results.wandb.Table(): Create a new table object.columns: Set the column names.data: Set the contents of each row.
wandb.Run.log(): Log the table to save it to Weights & Biases.
2. Visualize tables in your project workspace
View the resulting table in your workspace.- Navigate to your project in the W&B App.
- Select the name of your run in your project workspace. A new panel is added for each unique table key.
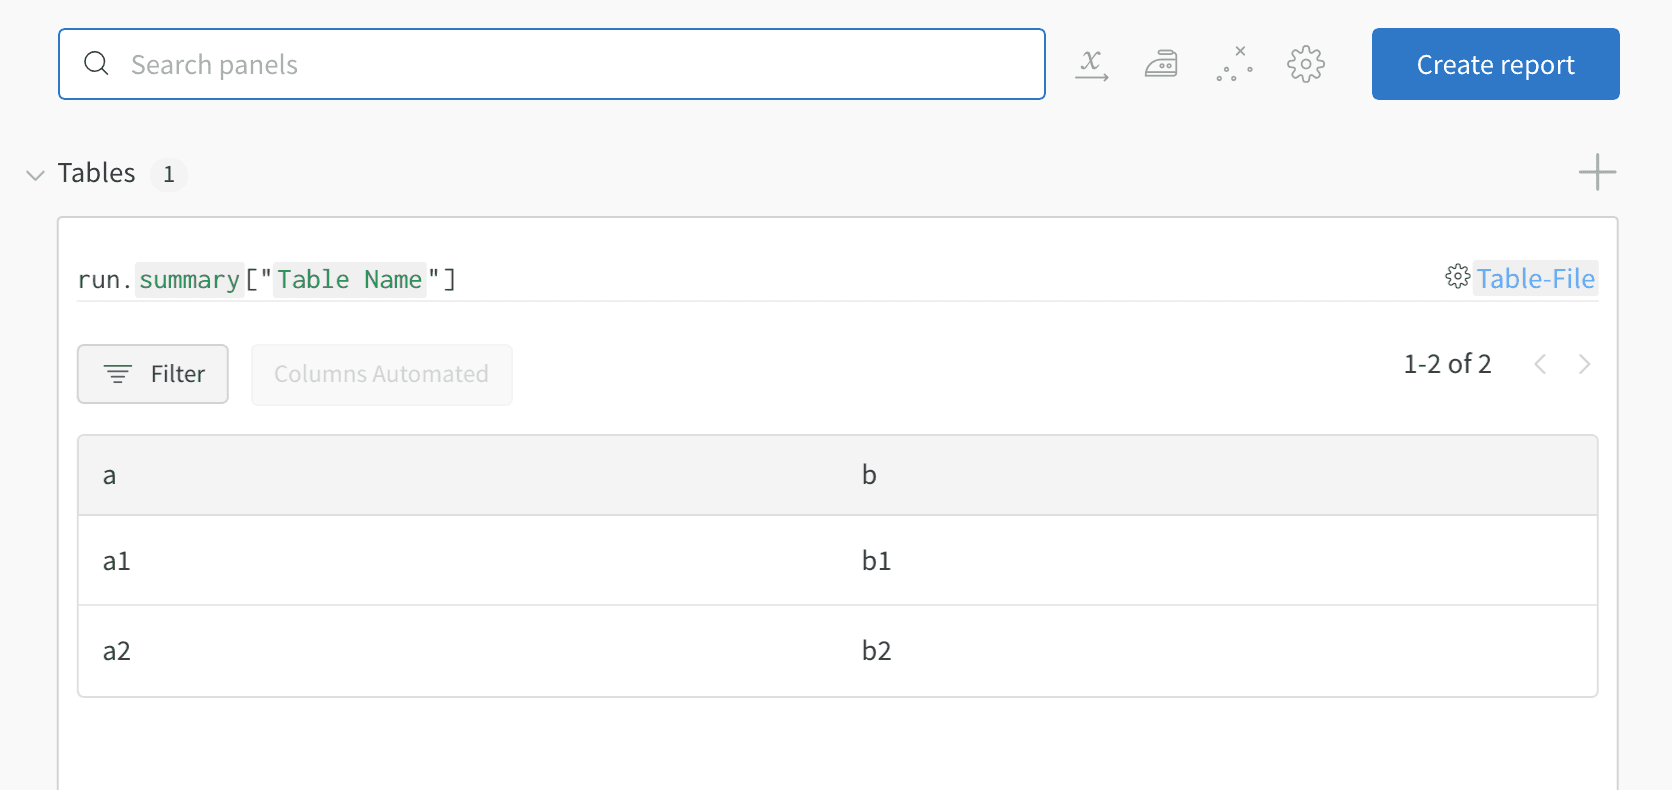
my_table, is logged under the key "Table Name".
3. Compare across model versions
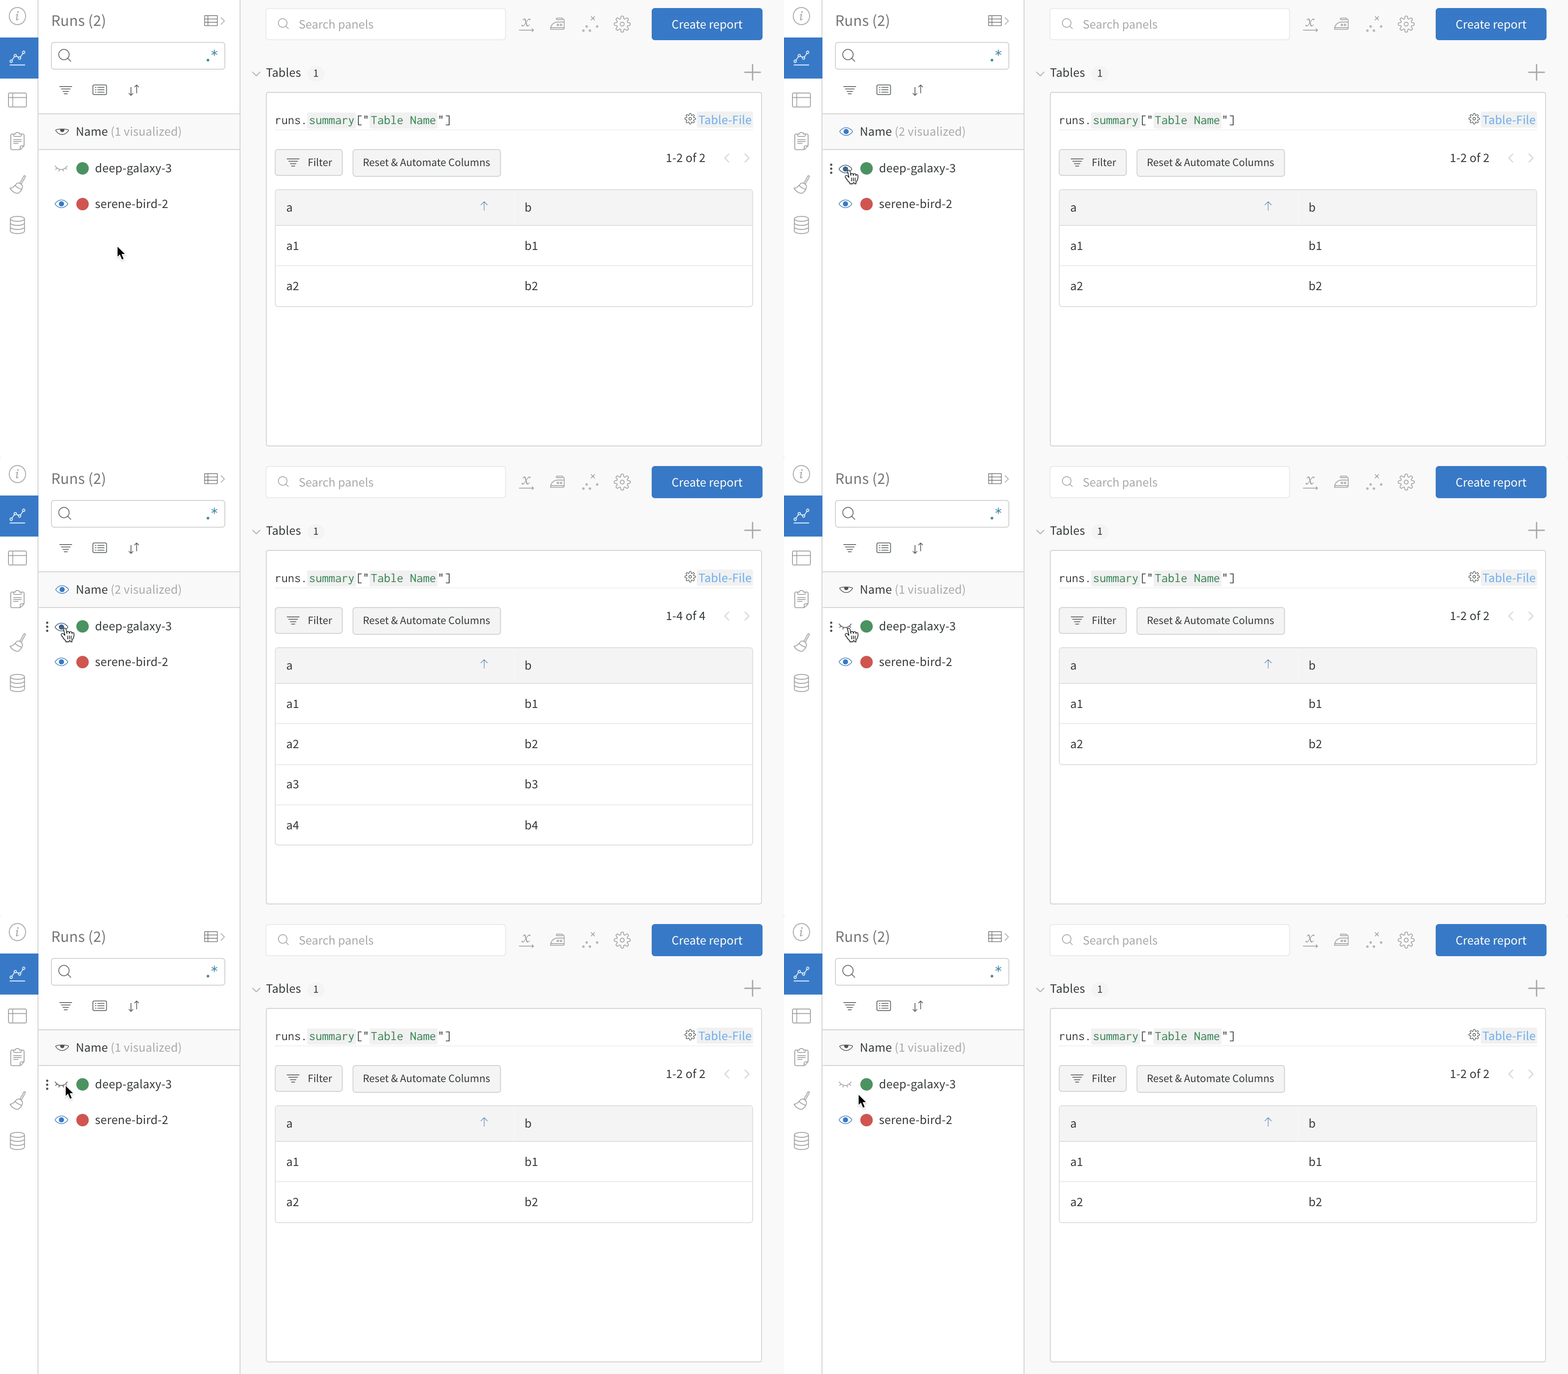
Log sample tables from multiple W&B Runs and compare results in the project workspace. In this example workspace, we show how to combine rows from multiple different versions in the same table.