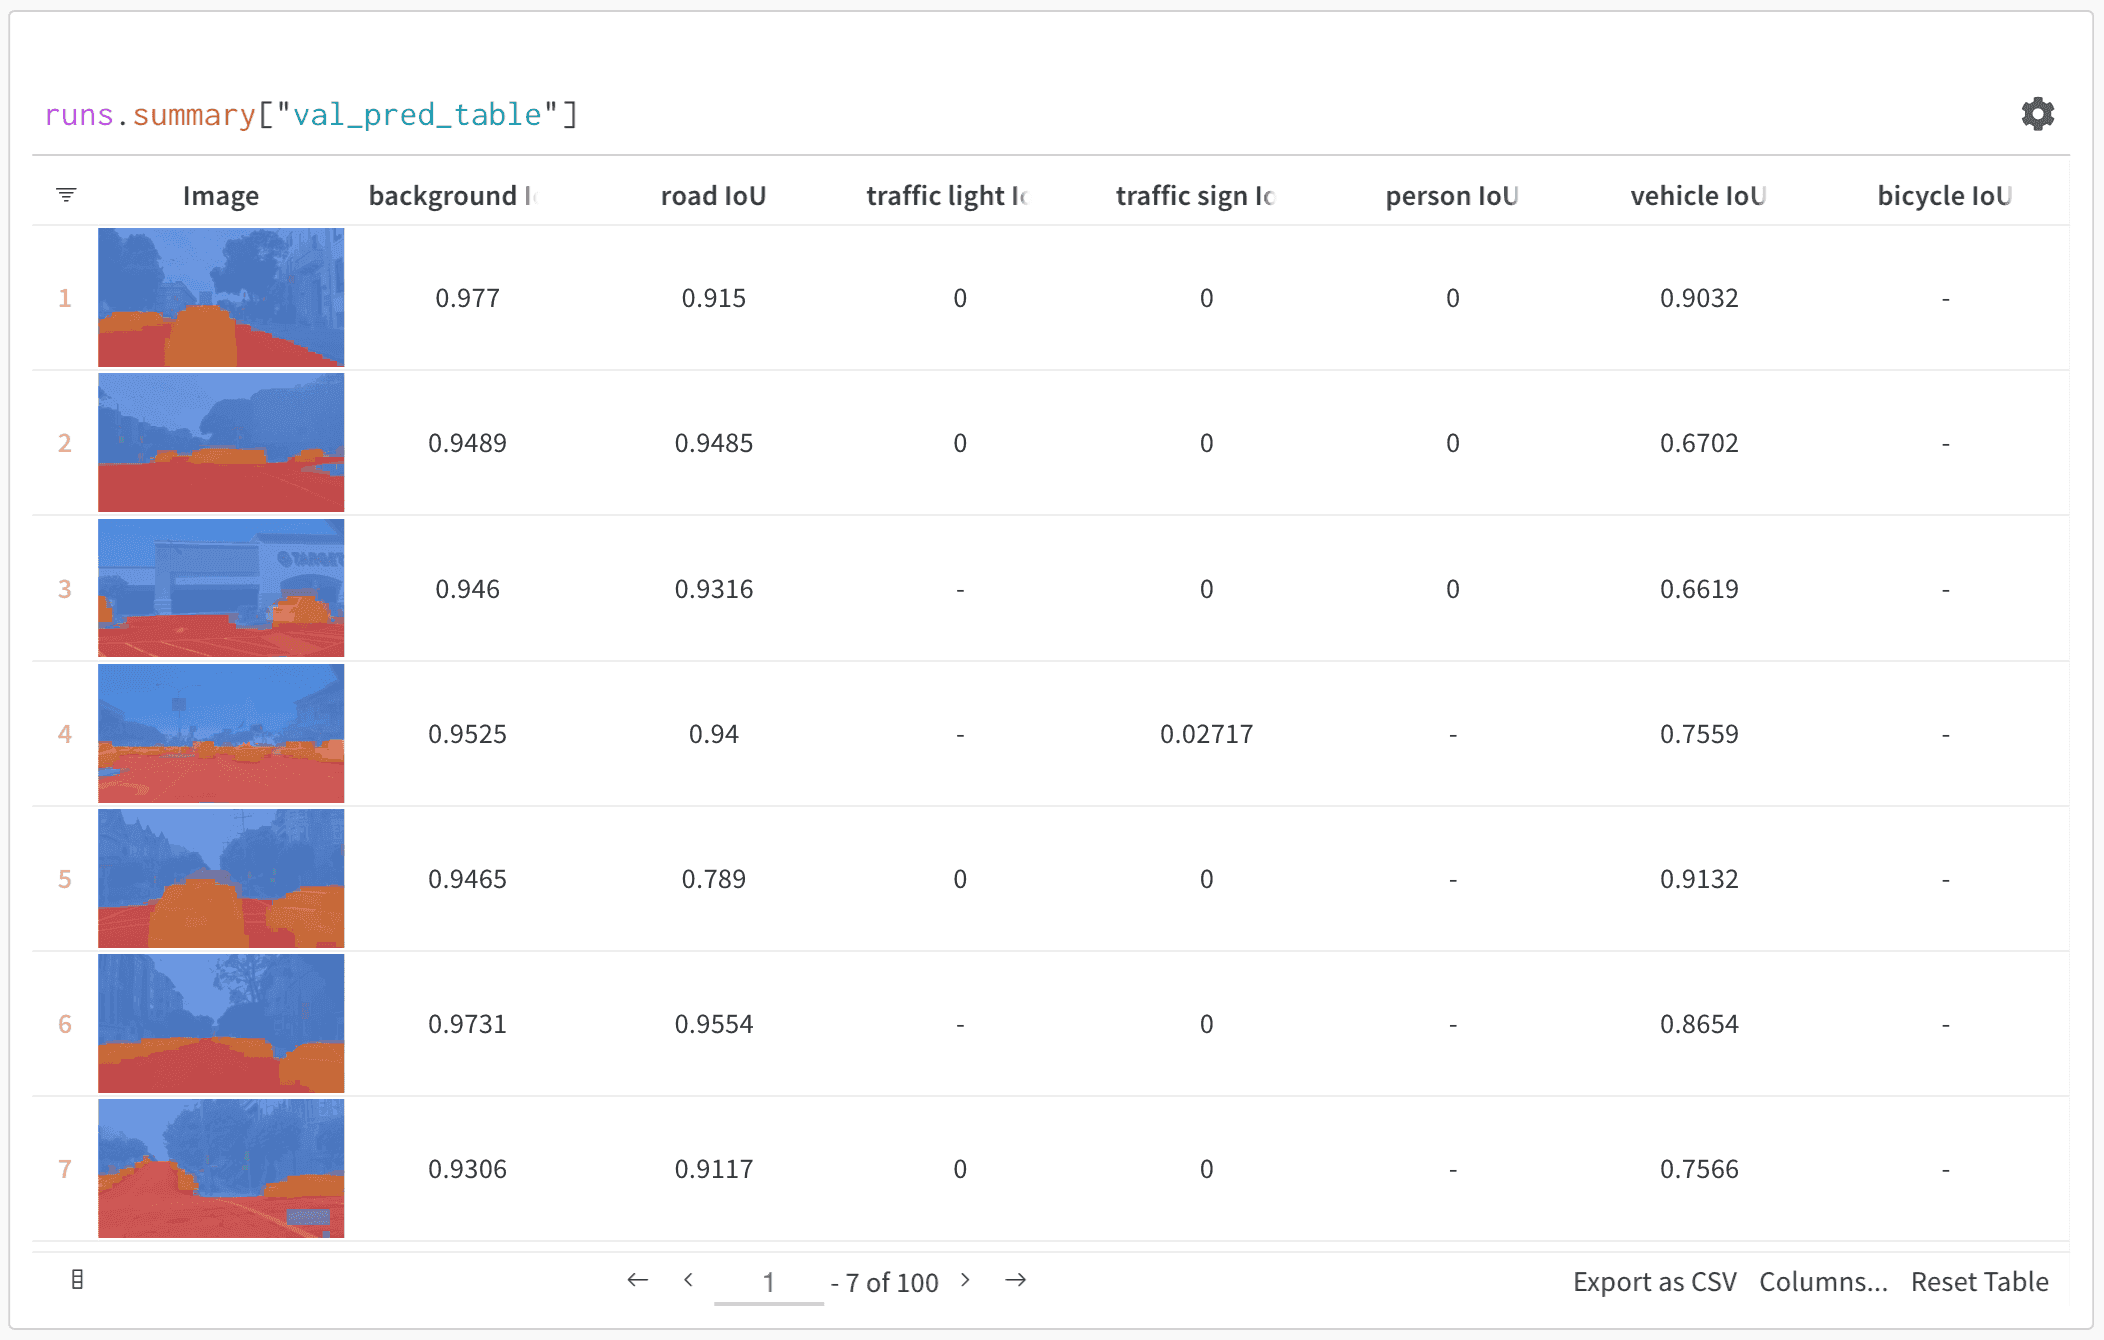
Use W&B Tables to visualize and query tabular data. For example:
- Compare how different models perform on the same test set
- Identify patterns in your data
- Look at sample model predictions visually
- Query to find commonly misclassified examples
The above image shows a table with semantic segmentation and custom metrics. View this table here in this sample project from the W&B ML Course.
How it works
A Table is a two-dimensional grid of data where each column has a single type of data. Tables support primitive and numeric types, as well as nested lists, dictionaries, and rich media types.
Log a Table
Log a table with a few lines of code:
wandb.init(): Create a run to track results.wandb.Table(): Create a new table object.
columns: Set the column names.data: Set the contents of the table.
run.log(): Log the table to save it to Weights & Biases.
How to get started
Last modified on September 30, 2026