

Lineage graphs
Within a collection in the Registry, you can view a history of the artifacts that an ML experiment uses. This history is called a lineage graph. A lineage graph shows:- Artifacts used as inputs to a run.
- Artifacts created as outputs from a run.
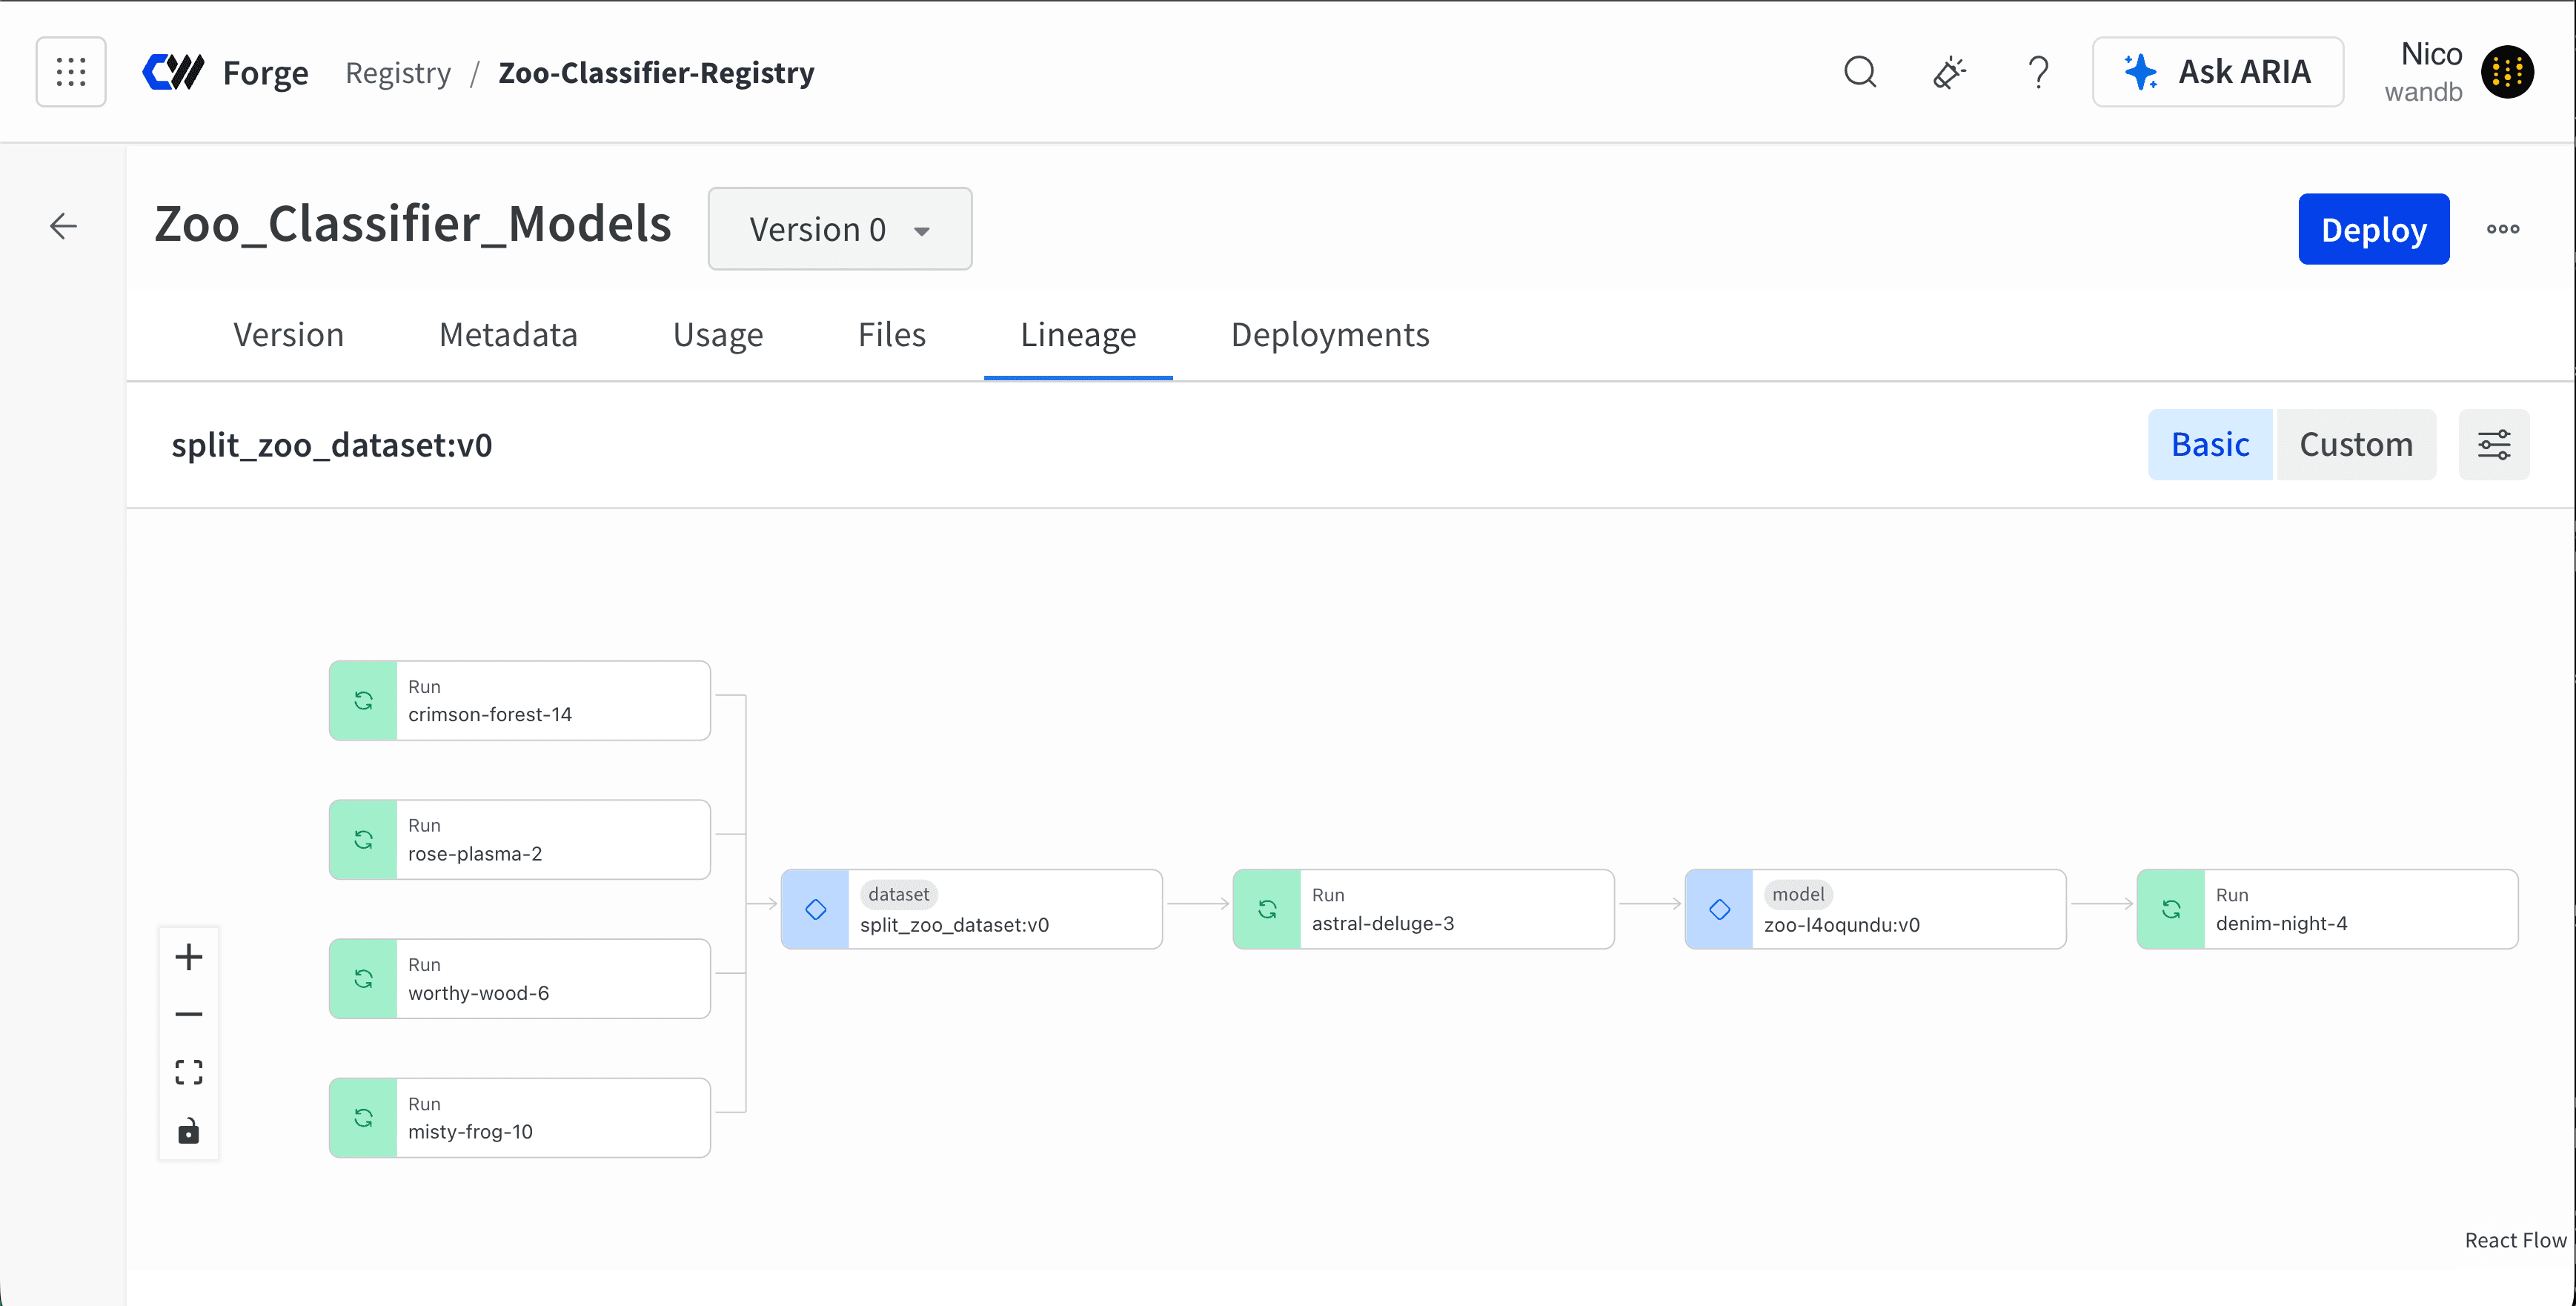
- Multiple runs log the
split_zoo_dataset:v0artifact. - The
astral-deulge-3run uses thesplit_zoo_dataset:v0artifact for training. - The output of the
astral-deulge-3run is a model artifact calledzoo-l4oqundu:v0. - A run called
denim-night-4uses the model artifactzoo-l4oqundu:v0to evaluate the model.
- Navigate to Registry.
- Select the collection that contains the artifact.
- From the dropdown, select the artifact version you want to view its lineage graph.
- Select the Lineage tab.
- Select a node to view detailed information about the run or artifact.
See Enable lineage graph tracking to learn how to track the input and output of a run using the W&B Python SDK.
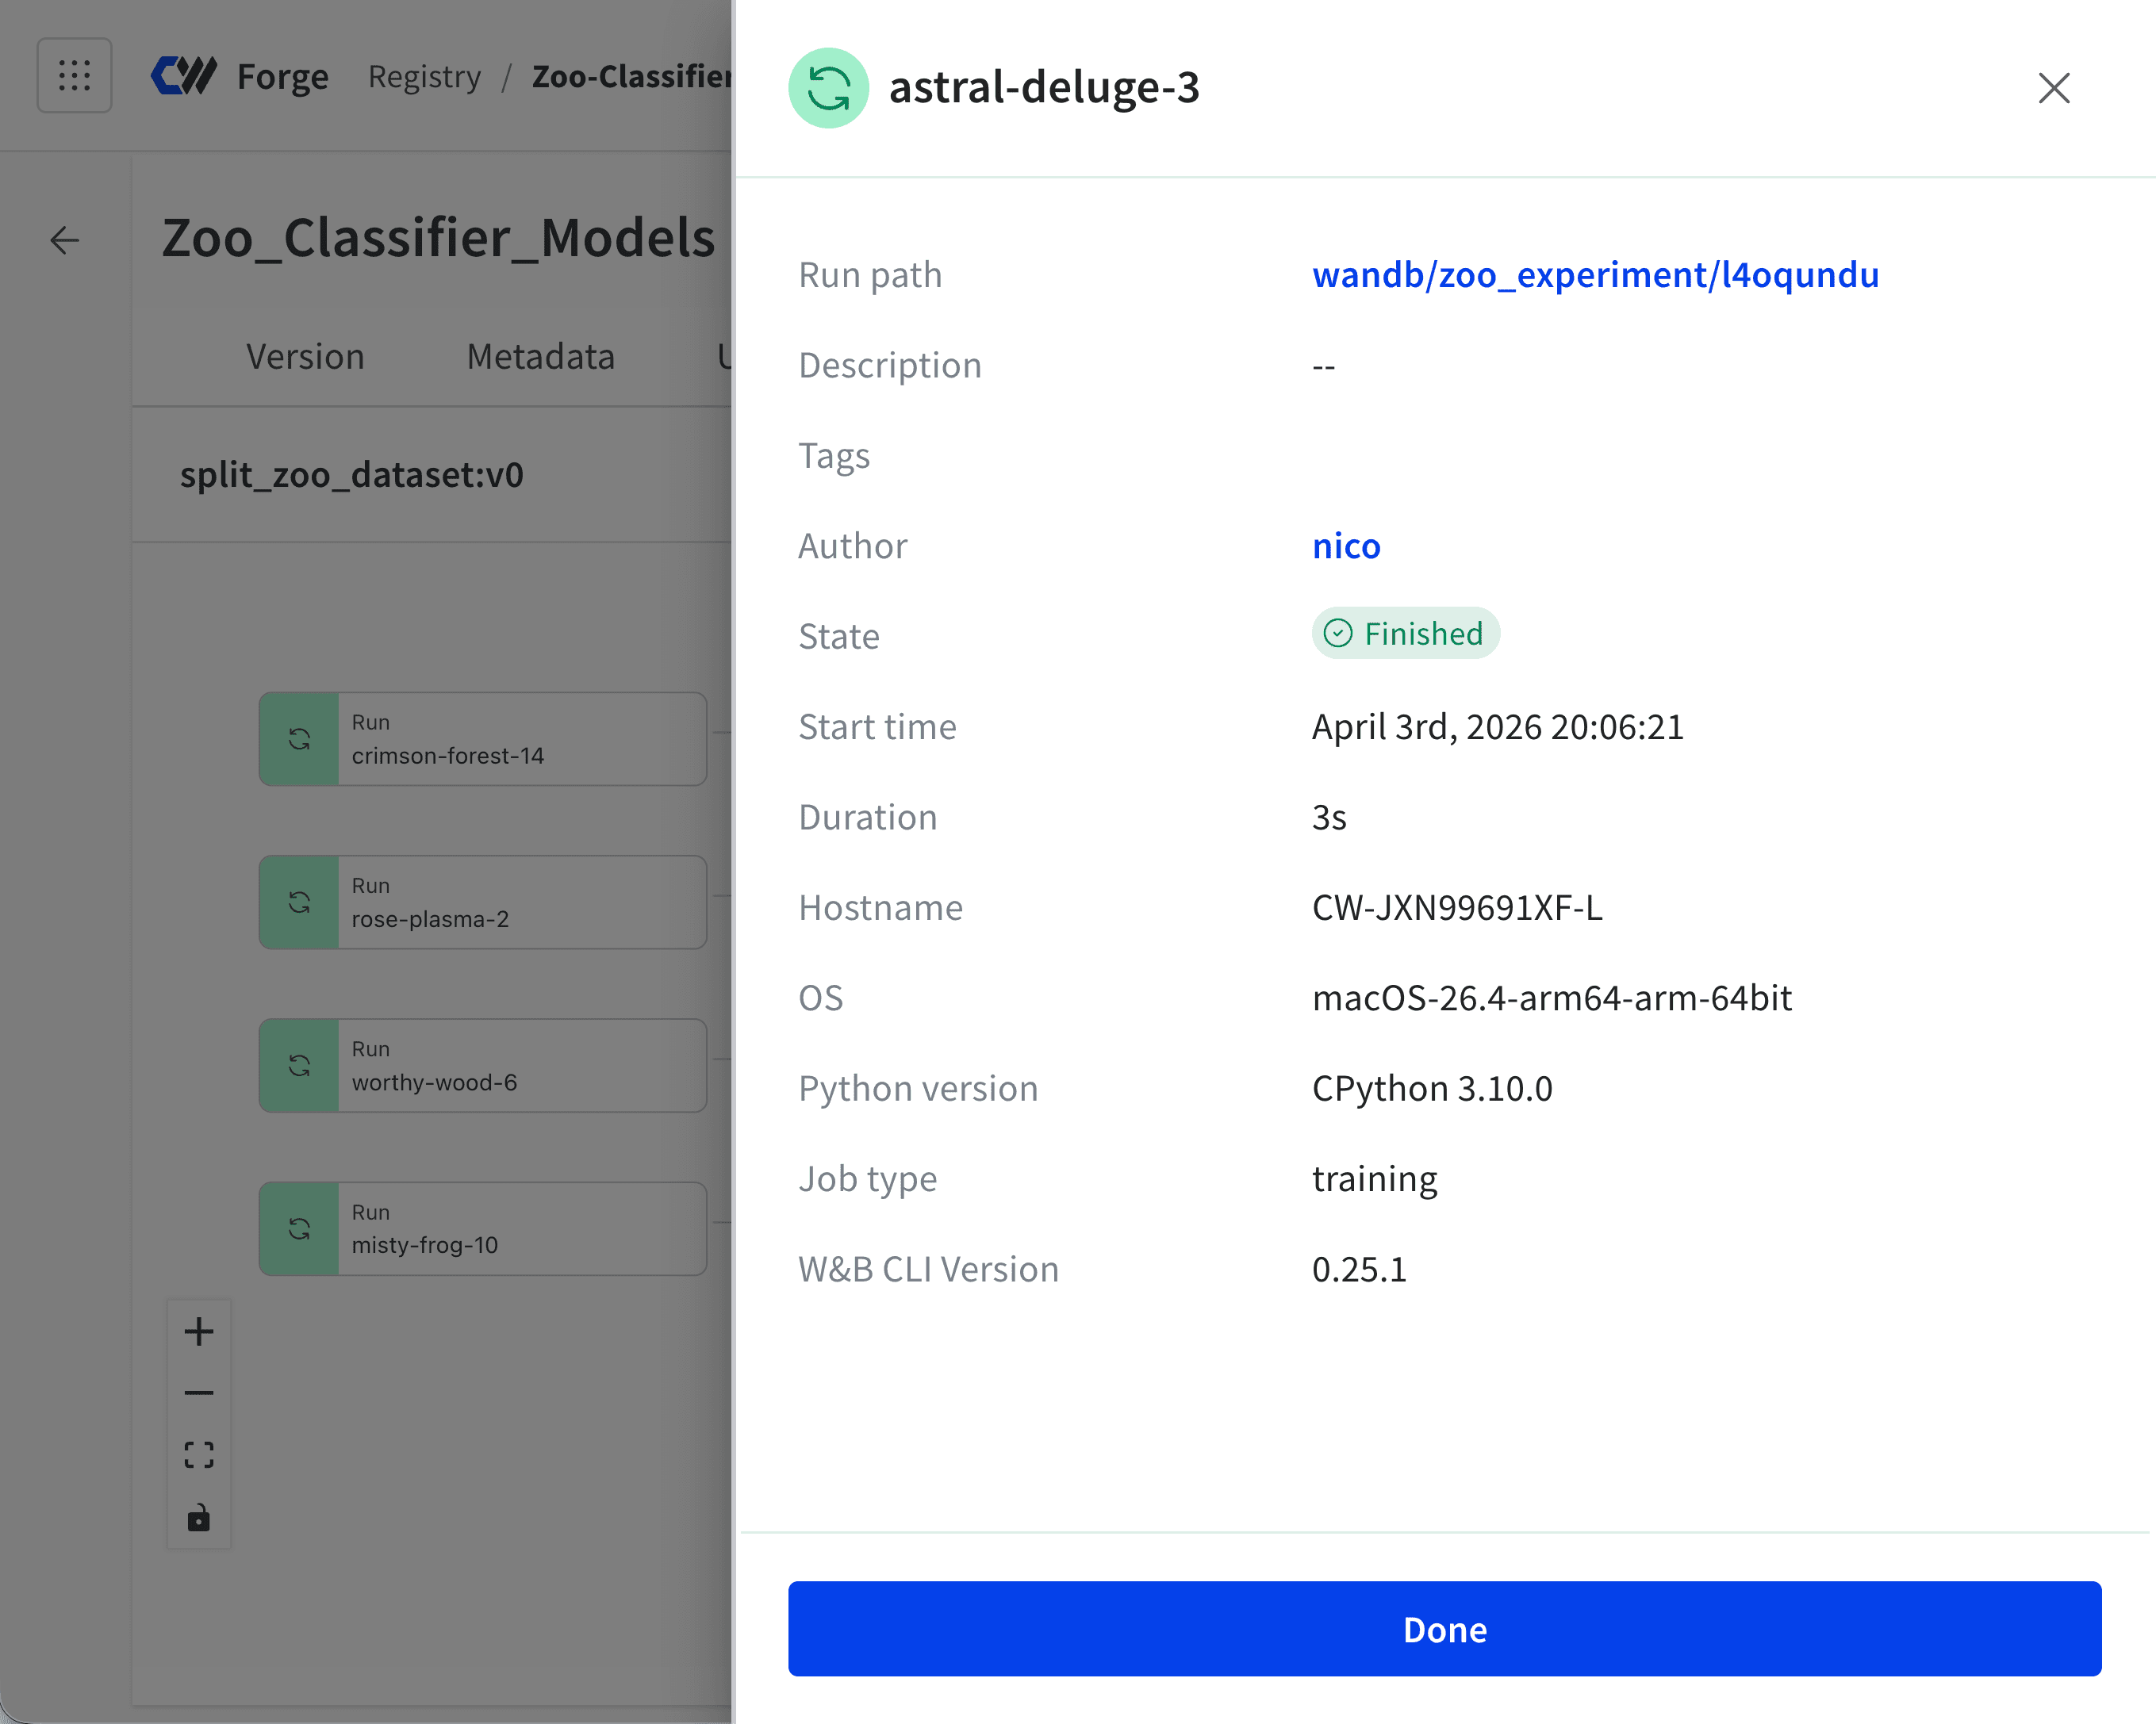
astral-deluge-3) when you select a node in the lineage graph:
zoo-l4oqundu:v0) when you select an artifact node in the lineage graph:
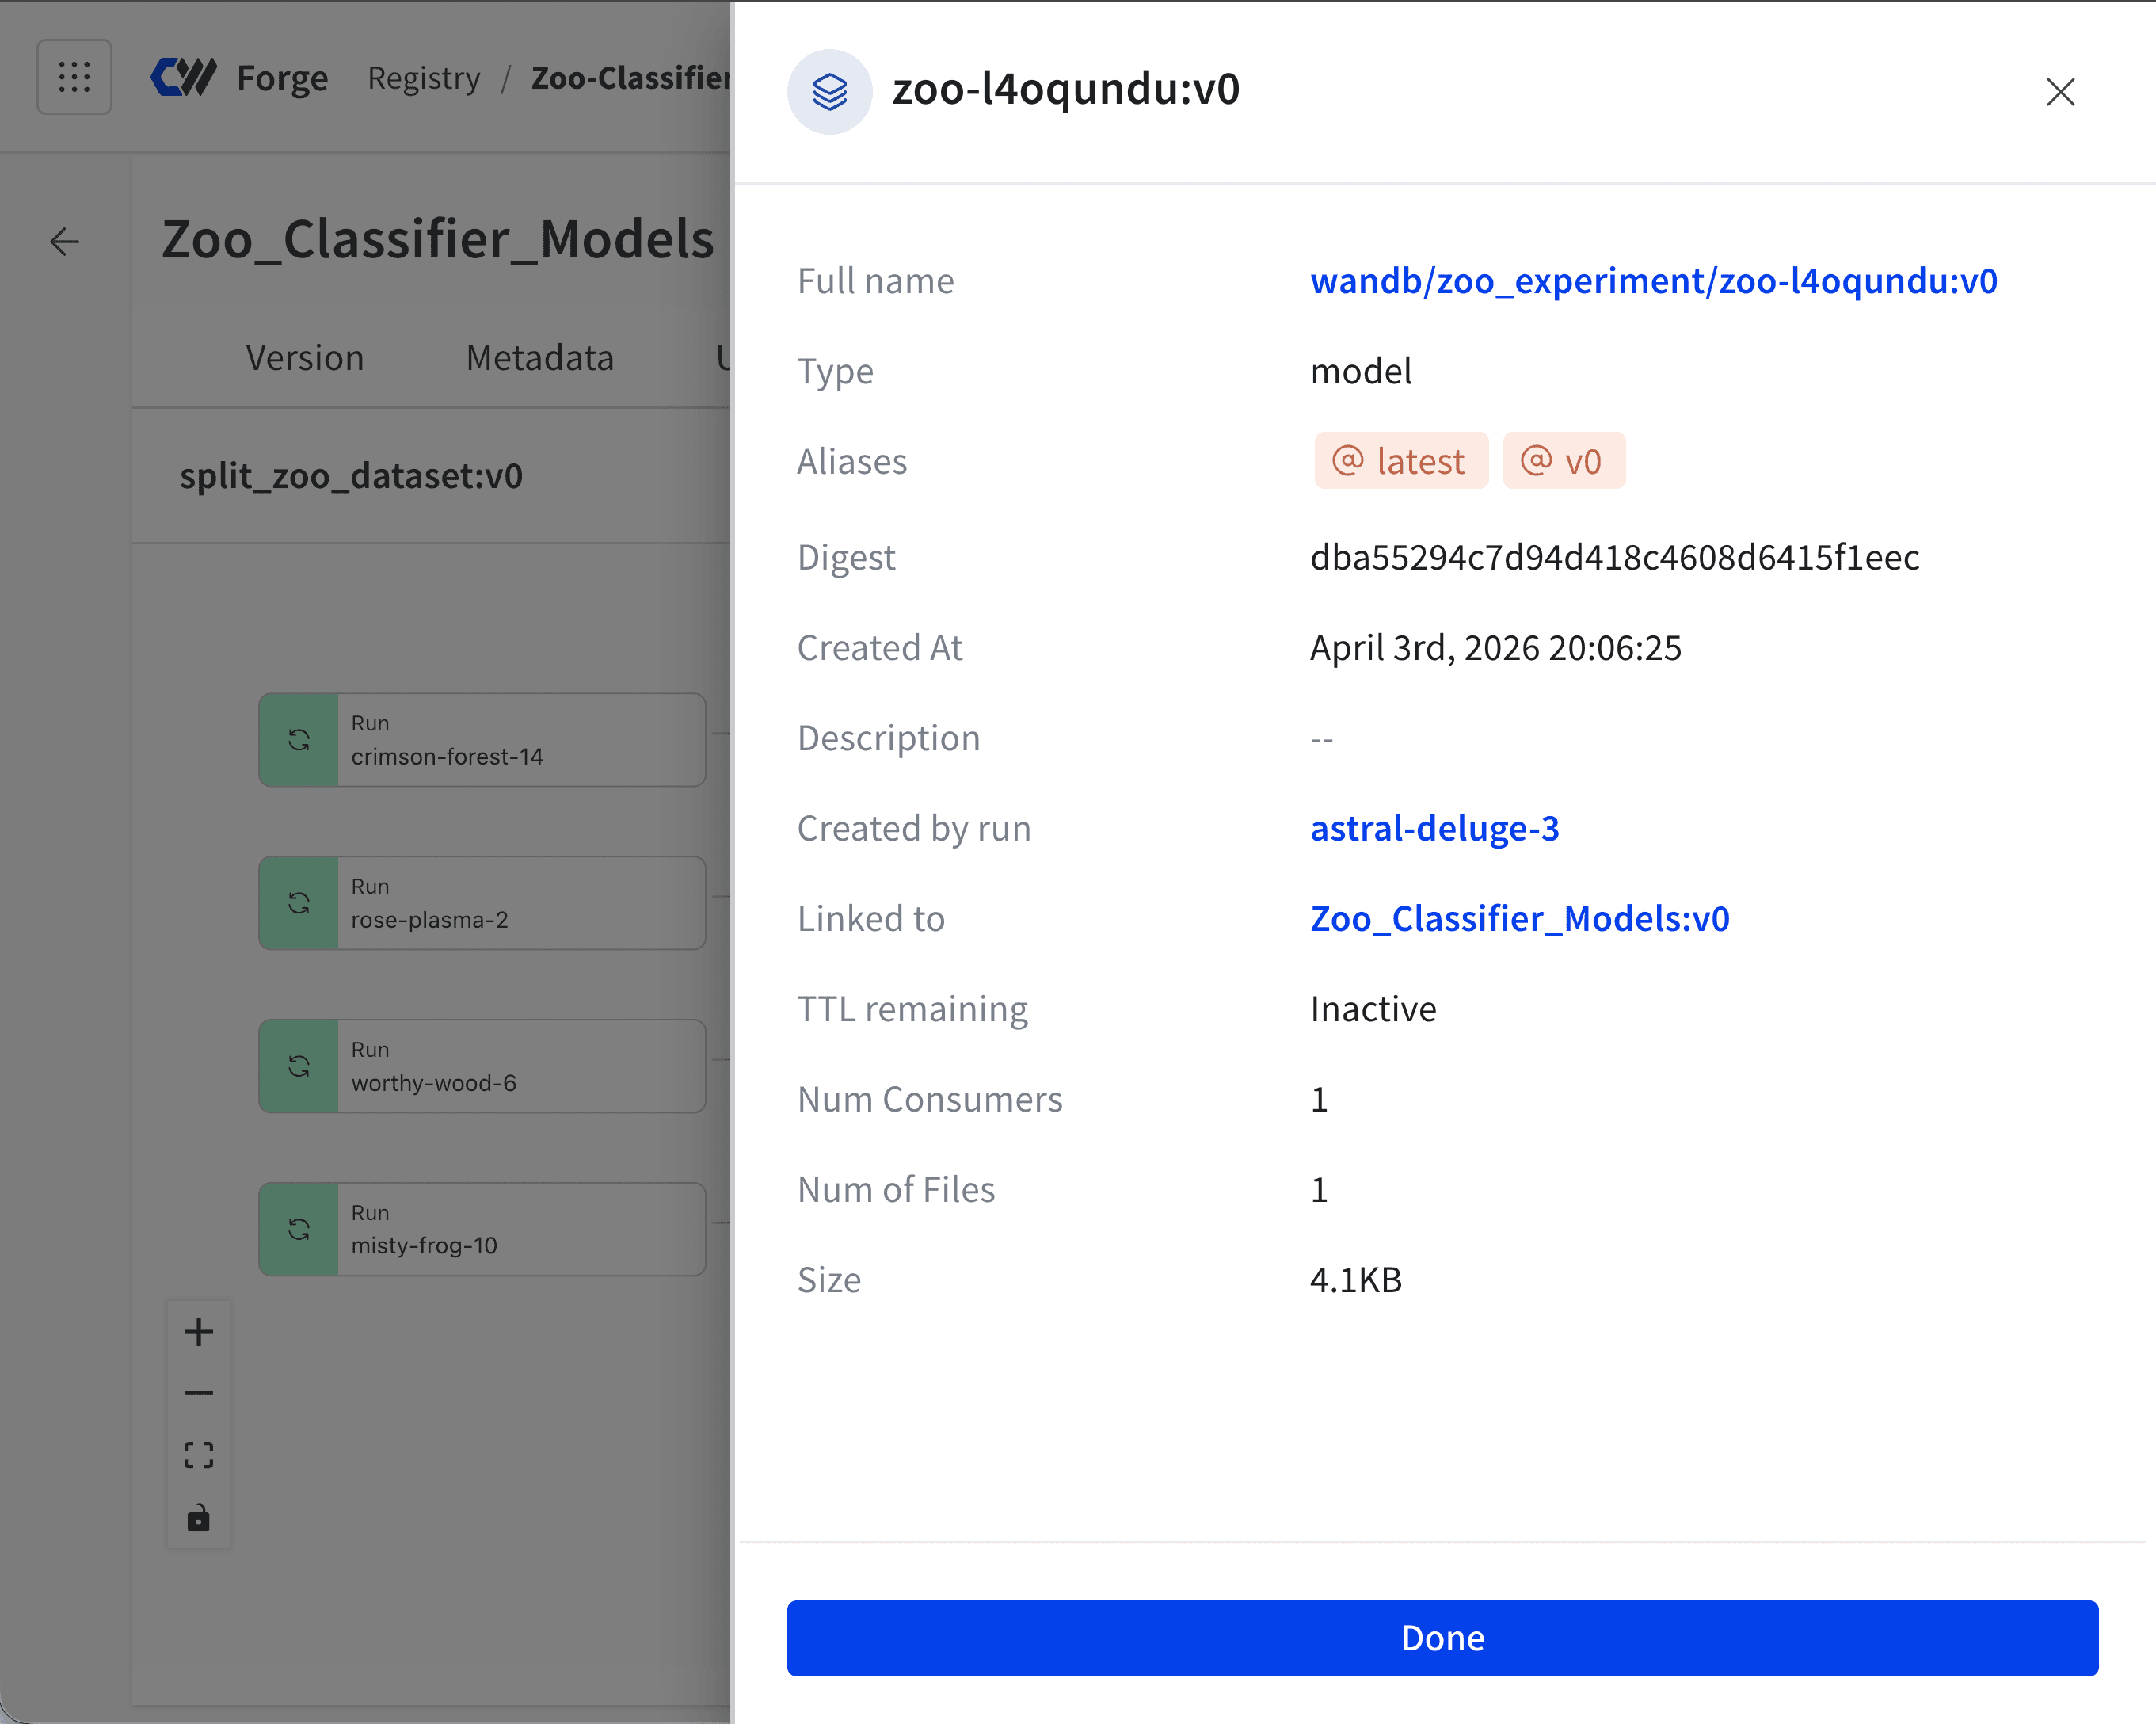
astral-deulge-3 run.
You can also view lineage graphs for artifacts you log to W&B that are not part of a collection. See Explore artifact lineage graphs for more information.
Create a custom view
Click Custom in the top-right corner of the lineage graph to create a custom view. You can filter and customize the lineage graph with the following options:- Filter by artifact type: Filter by artifact type values logged to W&B. For example, if you log an artifact with the type “dataset”, then “dataset” is available as a filter value.
- Filter by run job type: Filter by run job type values logged to W&B. For example, if you log a run with the job type “training”, then “training” is available as a filter value.
- Include extended lineage: Display items that are not in the direct lineage for the base version.
- Include generated artifacts: Items created programmatically will show.
- Expand clusters: Similar items with similar connections will not be grouped together.
- Downstream hops: Descendant generations relative to the active node.
- Upstream hops: Ancestor generations relative to the active node.
Audit a collection’s history
View actions that members of your organization take on that collection. You can view:- If an alias was added or removed from an artifact version.
- If an artifact version was added or removed from a collection.
- Navigate to Registry.
- Select the collection you want to view its action history.
- Select the dropdown menu next to the collection name.
- Select the Action History option.