

Custom dashboards in CoreWeave Grafana are in preview.
Prerequisites
Before you begin, you need the following:- Access to CoreWeave Grafana.
- The Administrator or User policy, which grants read and write access to your organization’s custom dashboards and includes access to metrics. If your organization uses custom policies, have an administrator assign the Grafana Dashboard Viewer, Grafana Dashboard Editor, and Observability Viewer roles. See Observability and telemetry roles.
- A running Pod on a CKS cluster.
Find your Pod’s metrics
Confirm that Grafana has CPU and memory data for your Pod, and record the values that the queries use:- In CoreWeave Grafana, open the Pod Inspector dashboard, in the CoreWeave Kubernetes Service folder. For a description of its panels, see Pod Inspector.
- In the time picker, select Last 1 hour. Then select your Pod’s cluster, namespace, and Pod Name.
- Confirm that the CPU Usage (Cores) and Memory: RSS vs WSS vs Usage panels display data.
- Record the selected Data Source, and the cluster, namespace, and Pod name values.
Create the dashboard
Start with a dashboard in your organization’s root folder:- In CoreWeave Grafana, open Dashboards and select your organization’s root folder.
- In the folder, select New > New dashboard, then Add visualization.
- Select the data source that you recorded in Pod Inspector.
- In the time picker above the panel, select Last 1 hour.
Add CPU usage
CPU usage in cores shows how much processor time the Pod consumes. A value of 0.1 represents one-tenth of a CPU core.-
In the panel’s query editor, confirm that Code is selected, and enter the following PromQL query. Replace
[CLUSTER],[NAMESPACE], and[POD]with the values that you recorded.The query calculates the rate of CPU time consumed by each container and adds the results for the Pod. -
Expand the query Options. Confirm that Type is set to Range, then set Legend to Custom and replace the prefilled text with
CPU cores. - Select Run queries and confirm that the query returns data.
-
Select the Time series visualization and set Title to
CPU usage (cores). - Select Back to dashboard to return with the panel changes applied.
Add memory usage
Resident set size (RSS) measures resident memory in bytes. This panel shows RSS, rather than a percentage of a memory limit.- Select Add > Visualization. The new panel uses the same data source as the CPU panel.
-
Confirm that Code is selected, and enter the following query, replacing the placeholders with the same values:
-
Expand the query Options. Confirm that Type is set to Range, then set Legend to Custom and replace the prefilled text with
Memory RSS. - Select Run queries and confirm that the query returns data.
-
Select Time series and set Title to
Memory usage (RSS). -
Under Standard options, set Unit to Data > bytes(IEC) and set Min to
0. - Select Back to dashboard. Grafana places the new panel above the CPU panel. Drag the CPU usage (cores) panel by its title to the right of the memory panel.
Save and reopen the dashboard
Save the dashboard and verify its configuration:- Select Save dashboard and enter
My workloadas the title. - Confirm that Folder is set to your organization’s root folder, then select Save.
- Return to Dashboards, open that folder, and select My workload.
- Confirm that both panels retain their titles, legends, and queries and display data for the last hour.
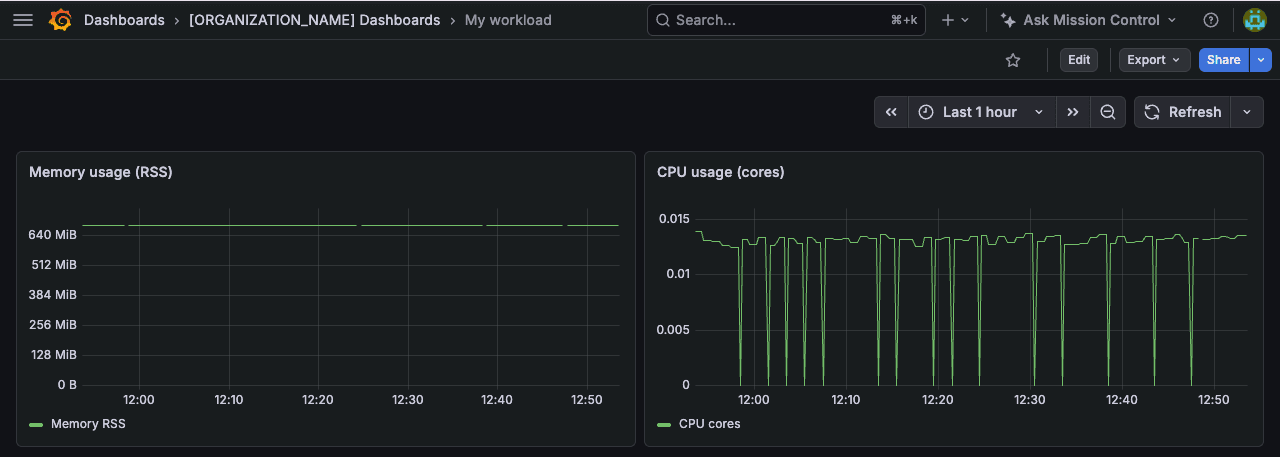
The My workload dashboard with memory RSS and CPU usage panels.
Next steps
To share and organize your dashboards:- Share the dashboard link with colleagues who have access to both the dashboard and its metrics. For the required permissions, see Dashboard access. By default, Share > Share internally locks the link to the current time range. To share a link that follows a relative range such as Last 1 hour, turn off Lock time range before you select Copy link.
- Group related dashboards in subfolders. For more information, see Organization folders.