Description
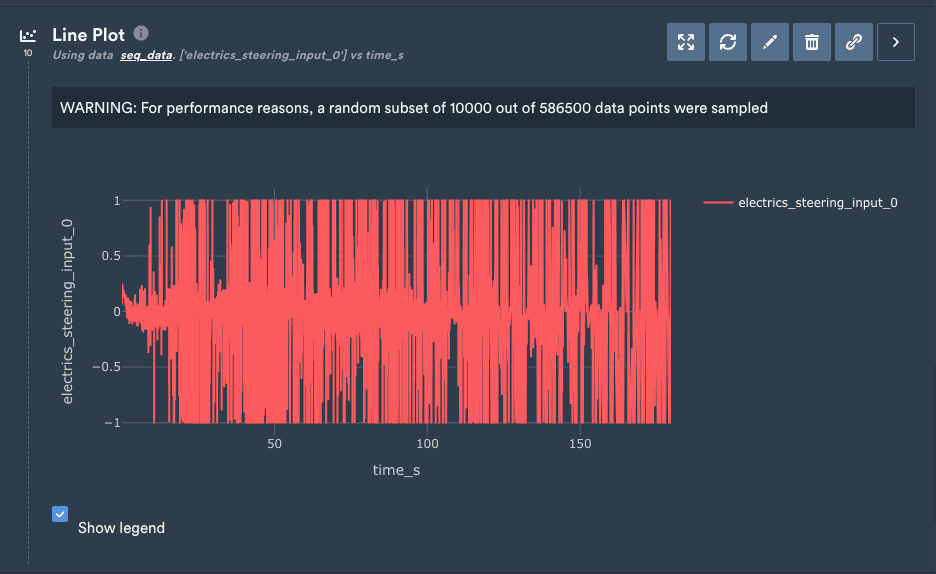
A function to create a classic line plot. This function works similarly to 2D Point Plot
Application
This plotting function is useful to plot 2 or more different parameters against each other
How to use
Firstly, select the ‘Line Plot’ manipulator under the ‘Explore’ tab from within a notebook
Axis Selection
In this section you control which columns of the dataset are plotted on the two axes.
- X Column defines the column which is plotted on the x-axis.
- Y Column defines the column which is plotted on the y-axis.
Display Options
Column identifying multiple tests is an optional parameter to generate different plot series. This can only be selected if you have a single y-axis
Line breaks is another optional parameter to break the line into different segments, for instance different test runs
Text can be used to add text from a column into the plot
Example

Last modified on July 23, 2026