Description
Model Evaluation is a function to evaluate cross validation results of a trained model. As this function is mainly about evaluating cross validation results it is strongly recommended to read the article on Cross Validation first if you are not familiar with this concept.Application
You can use this function when you want to evaluate if a model is good enough to be further used. One tool to answer this question is cross validation for which results can be analysed with the Model Evaluation function.How to use
- Select a Model to evaluate.
- Click Apply to run the step.
- Hyperparameters
- Model Blueprint
- Predicted vs Actual
- Predictive Distribution
- Curve Prediction
- Cross Validation Results

Tab: Hyperparameters
This tab shows the hyperparameter setting for the evaluated model. Which hyperparameters are shown is depending on model type.
Tab: Model Blueprint
The model blueprint is a graphical display of the model topology. It shows the model inputs sorted by numerical and categorical inputs, the model outputs, and the prediction engine.
Tab: Predicted vs Actual
On this tab a Predicted vs Actual plot is shown. In contrast to the Predicted vs Actual function no dataset can be selected. Model Evaluation always shows the results on the training data. As the model training was done by means of cross validation the training dataset was split into training and validation data internally. A random subset of 200 points across all cross validation splits is shown. Training and validation data is displayed separately.
Tab: Predictive Distribution
On this tab the distribution for the actual (training) data, the training, and the validation data are shown. The distribution is plotted as line plot with the output range on the x-axis and the relative frequency on the y-axis. Additionally the distribution is plotted as a 1D point plot below the line plot. With this plot you can quickly see how well the model training was able to capture the distribution of the actual data.
Tab: Cross Validation Results
This tab displays a table with the cross validation scores for each of the K cross validation runs which are identified by the Cross Validation Fold Index. The test score is calculated according to the Cross-validation scoring metric in the Advanced Model Options.
Tab: Feature Importance
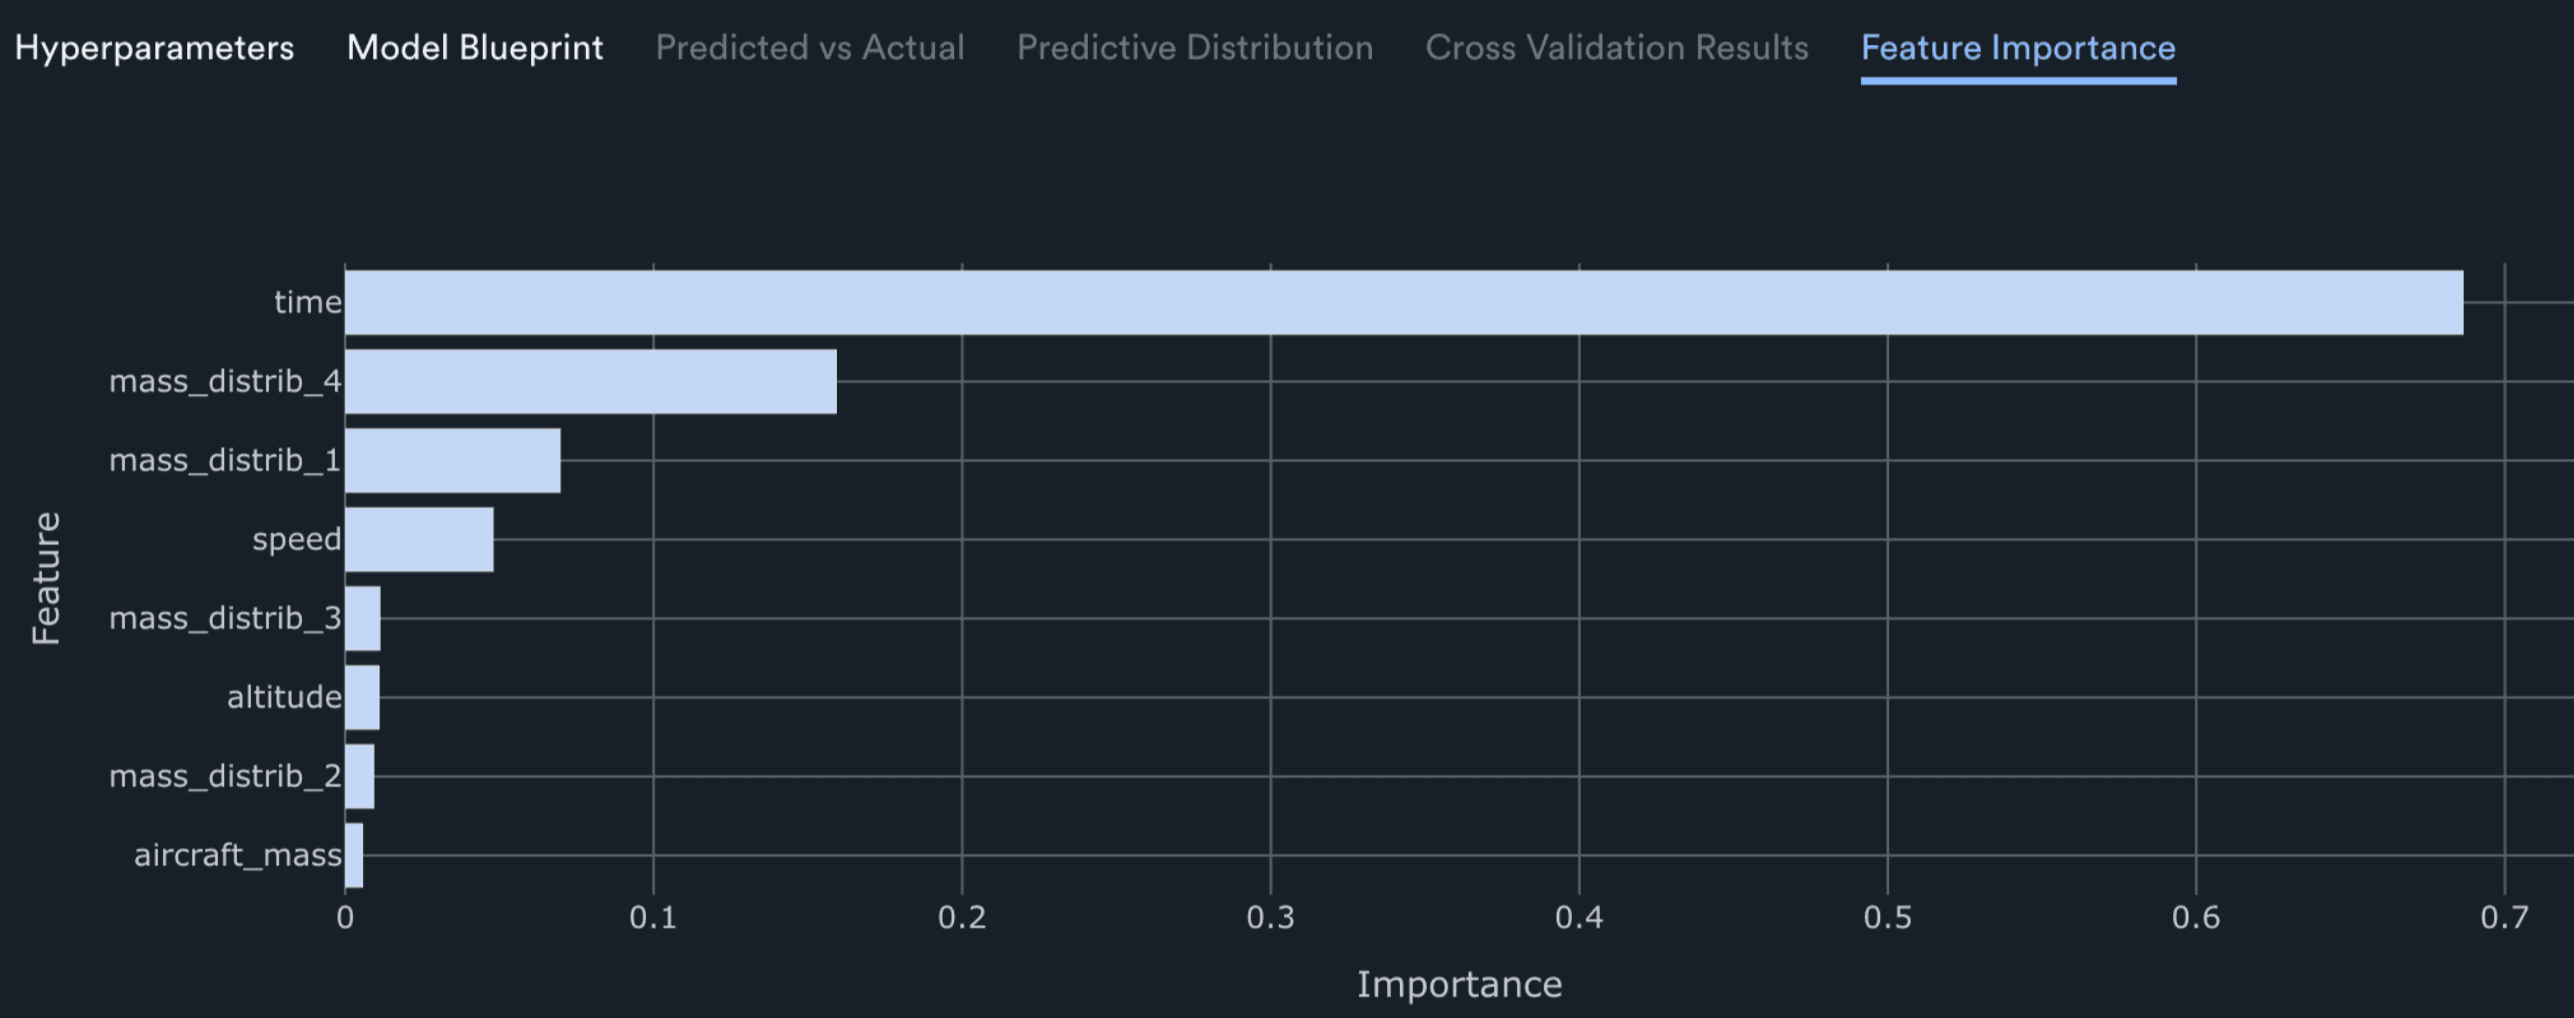
This tab displays the relative importance of each input feature for the trained model. The importance values shown here are calculated during model training and stored with the model, which is why this tab loads quickly.- Uses the model’s native feature importance metric (Gini/impurity-based importance for tree models)
- Importance values are computed on the full training dataset at training time
- Displays a horizontal bar chart ranking features from most to least important