Prerequisites
- You must sign in to the Cloud Console to access CoreWeave Grafana.
- Access to the dashboards, and visibility of the Console button, is only available to users with the
Observability Viewerrole in an IAM access policy. In the legacy CoreWeave permissions model, users in themetricsgroup can access CoreWeave Grafana. - To access the Usage by Product and Zone dashboard, you need both the
Observability ViewerandBilling Viewerroles in an IAM access policy. In the legacy CoreWeave permissions model, users in themetricsandbilling_viewergroups can access CoreWeave Grafana.
Access CoreWeave Grafana dashboards
CoreWeave Grafana is hosted athttps://cks-grafana.coreweave.com.
To open a dashboard:
- Sign in to the Cloud Console to authenticate, then go to the Grafana page. The dashboard is also linked in the left sidebar of the Cloud Console.
-
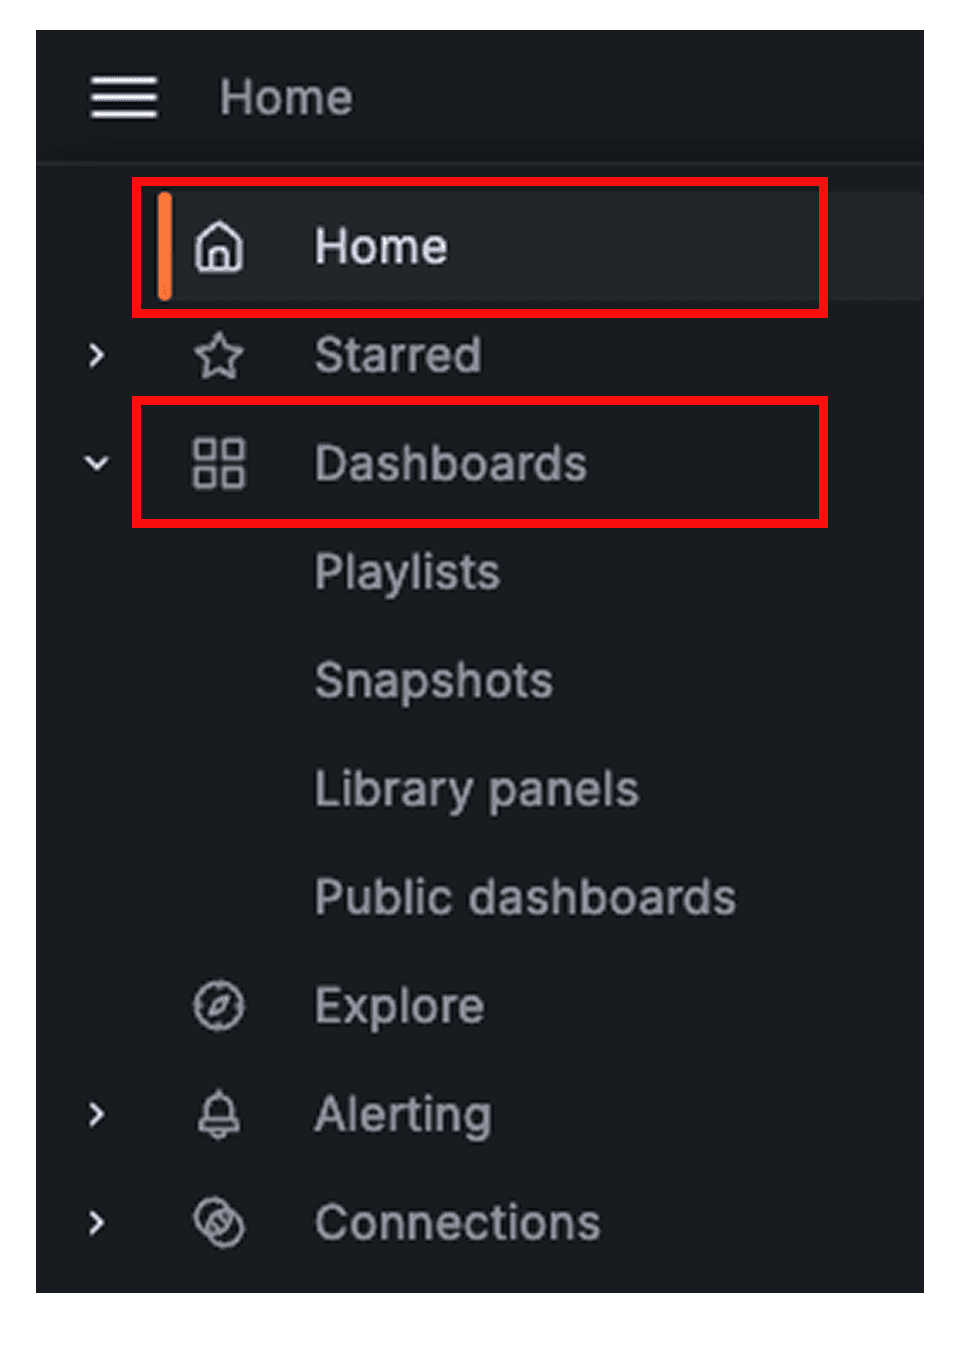
On the Grafana dashboard page, select Home and then Dashboards.
-
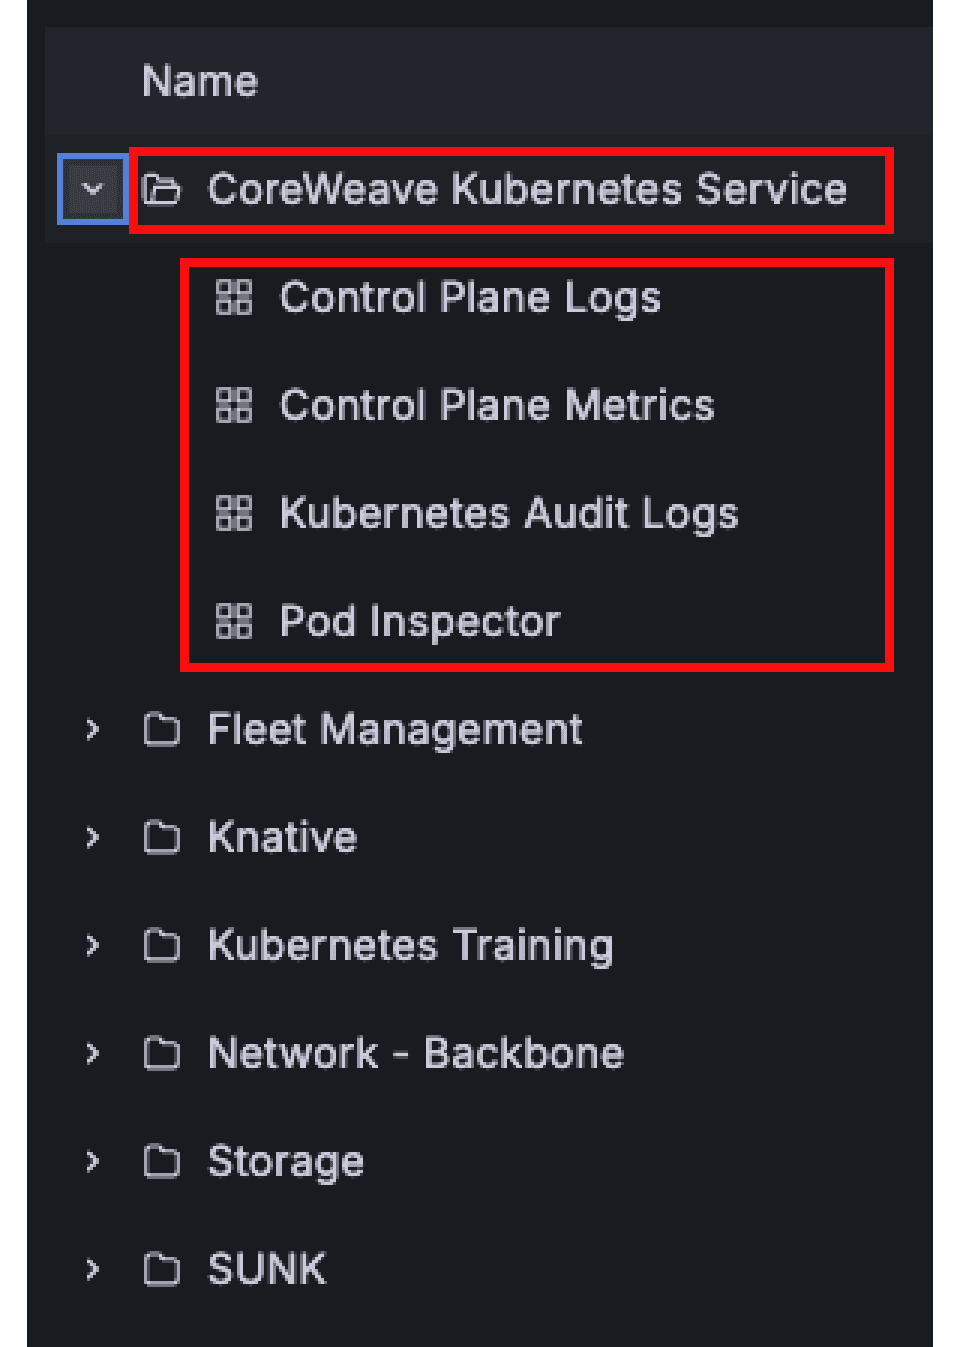
From the dashboard menu, expand a folder and select a dashboard.
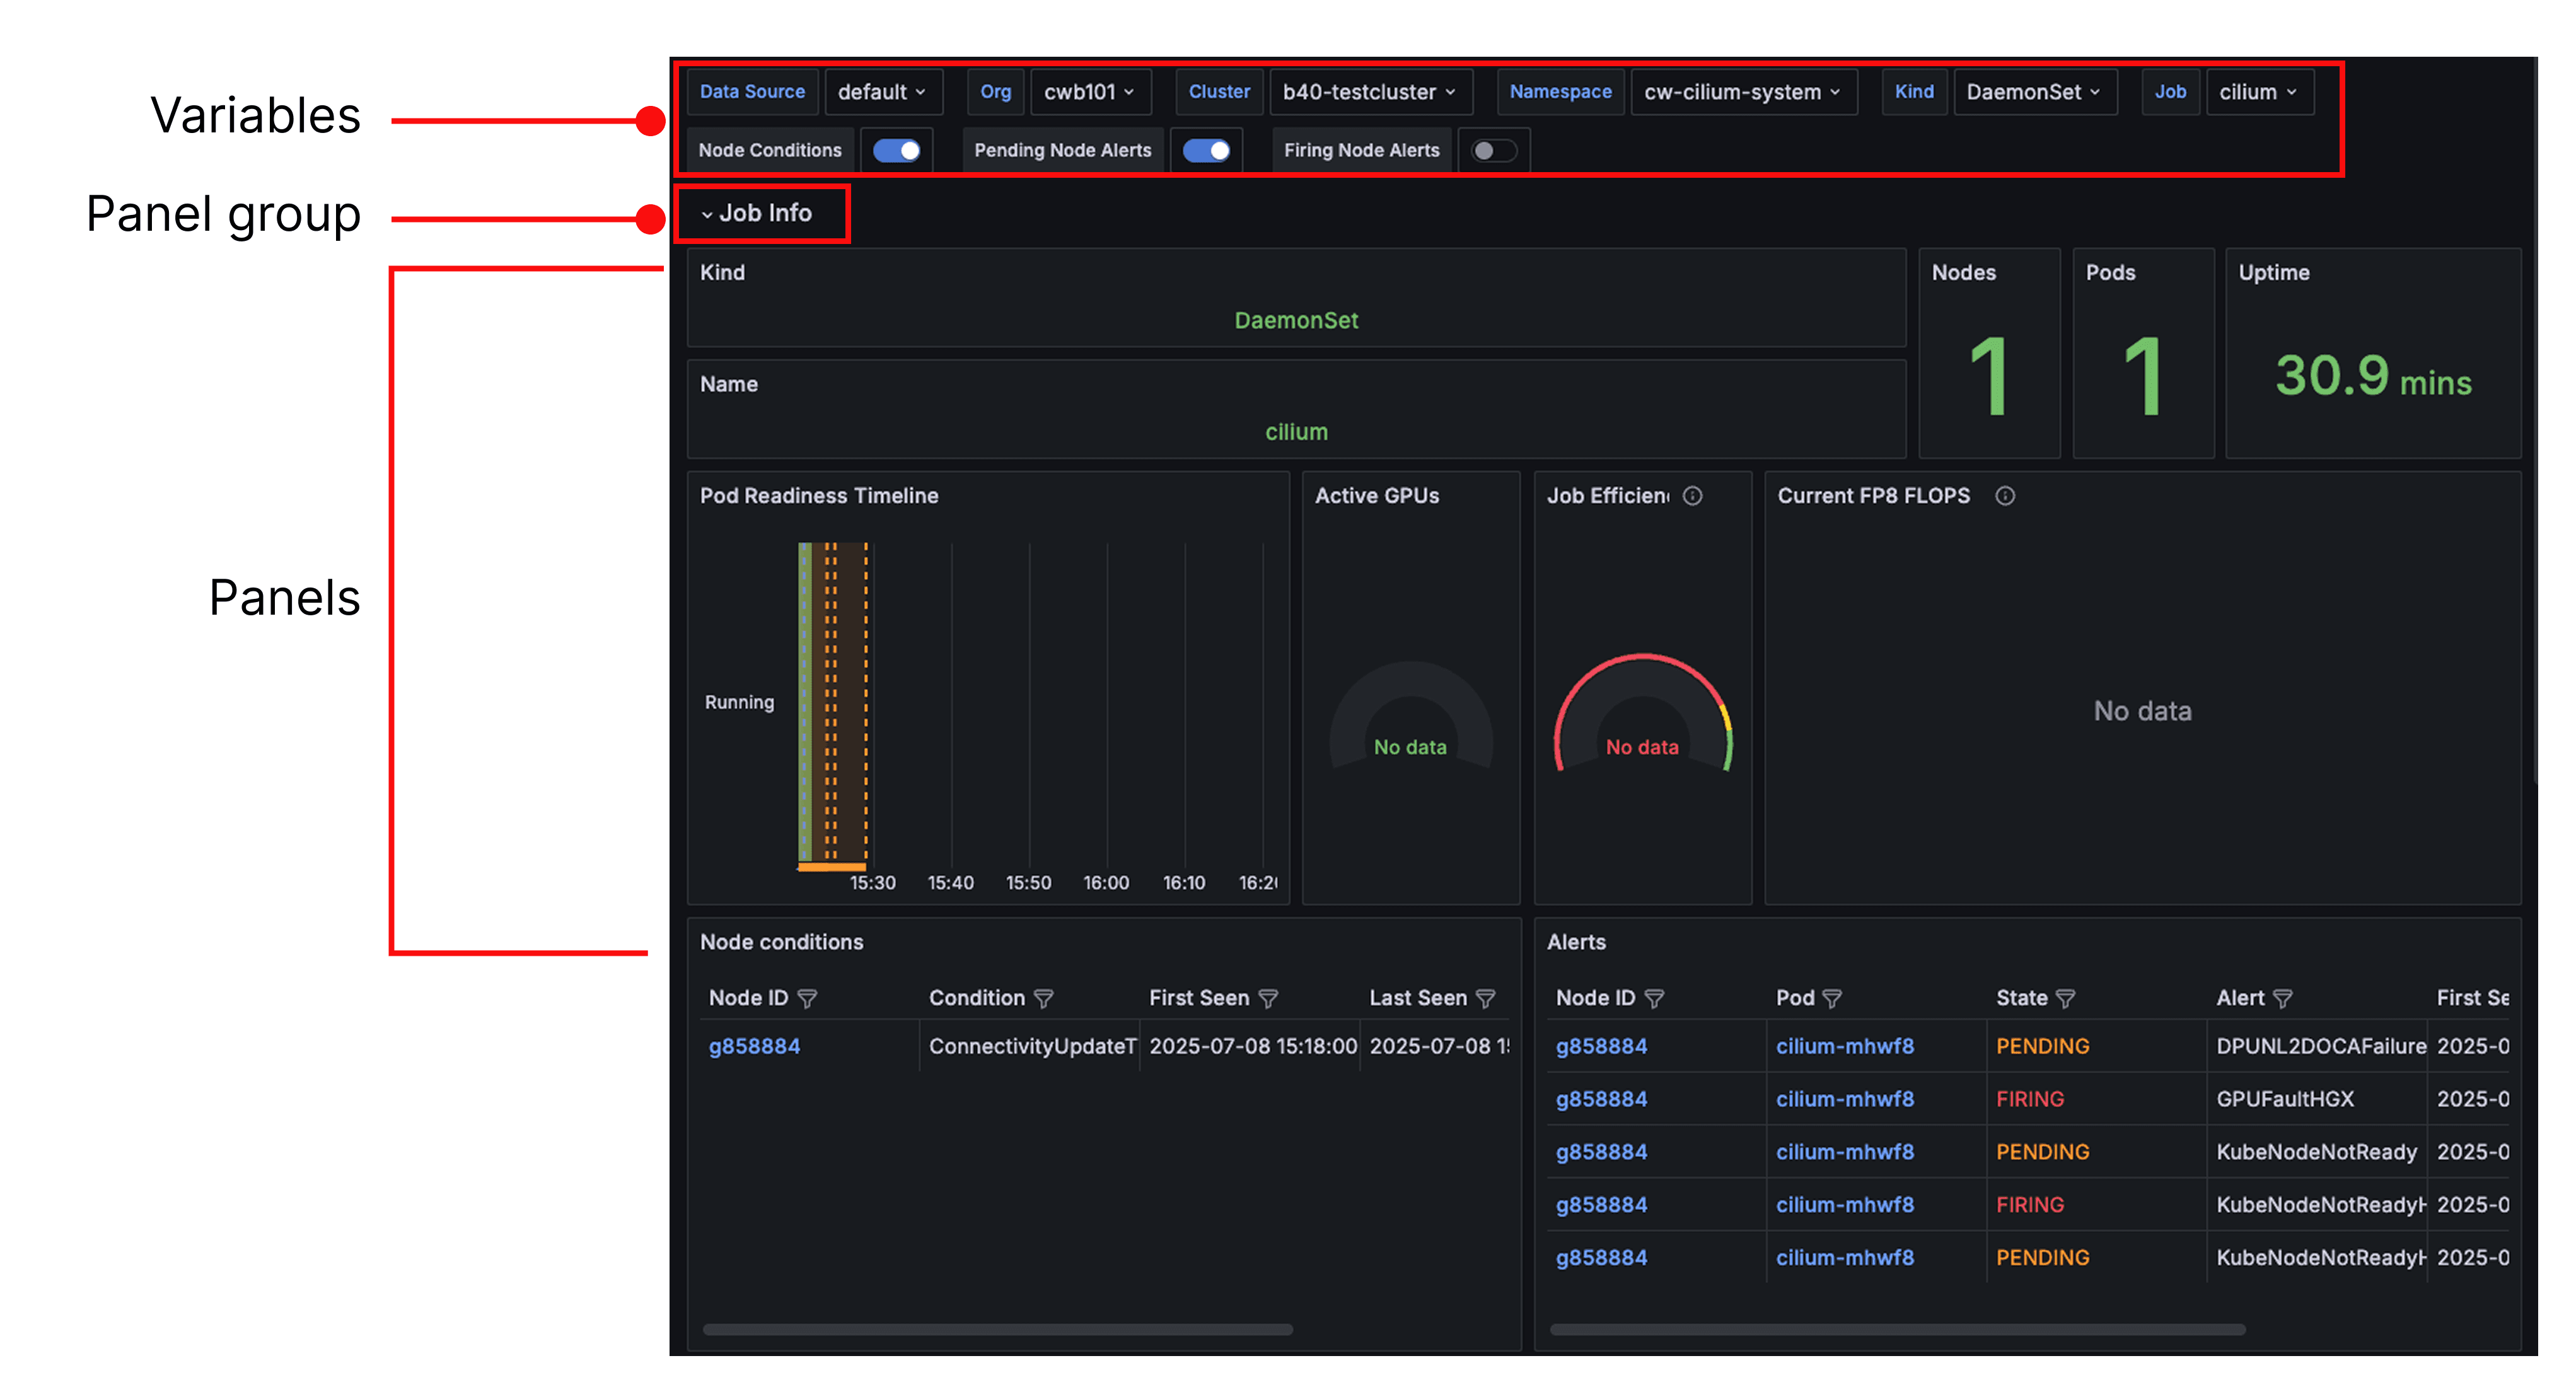
Use CoreWeave Grafana dashboards
CoreWeave Grafana dashboards have three main areas:- Variables: Variables let you select from options to refine your queries.
- Panel group: A panel group organizes related panels into a section.
- Panels: Panels visualize or list the data described in the panel name.