

Overview
This page introduces CoreWeave Mission Control GPU Straggler Detection, explains the problem it solves for distributed training teams, and shows what the feature looks like in use. Read this page if you run multi-GPU training jobs on CoreWeave and want to understand how Straggler Detection helps you find underperforming GPUs, recover lost training throughput, and reduce time spent debugging silent slowdowns. In large-scale model training, thousands of GPUs communicate with each other. When even a single GPU falls behind, whether because of a software glitch, a networking issue, or hardware degradation, the entire distributed training job slows down. These GPU “stragglers” don’t crash the job outright. They quietly stretch iteration time. This makes detection much harder, and existing logs and telemetry from a training run can’t solve the problem. The consequences are reduced training throughput, valuable researcher time lost to silent slowdowns, and up to 10 percent of total training compute wasted. For most research teams, finding a straggler is a painful and time-consuming debugging exercise. Engineers pore over available logs, compare node performance by hand, and repeatedly resubmit jobs to isolate the GPU that causes the slowdown. Often, teams don’t have the necessary data and can’t find the straggling GPU. Because distributed training depends on complex GPU-to-GPU communication, even experienced teams struggle to pinpoint the root cause quickly. CoreWeave’s Straggler Detection removes this guesswork entirely. It applies CoreWeave’s proprietary detection algorithms to fine-grained NCCL (NVIDIA Collective Communications Library) telemetry, isolating the exact GPU and node that fall out of sync with the rest of the job. When CoreWeave detects a straggler, you receive a precise alert with recommended next steps, such as cordoning the offending node to prevent further scheduling. CoreWeave then cleanly removes the problematic node so you can immediately reschedule the job and return to full-speed training. Alongside straggler detection, you gain access to new NCCL-level Prometheus metrics that improve observability. These metrics make it easier to understand GPU communication patterns, diagnose training bottlenecks, and troubleshoot multi-node inference behavior. The feature introduces negligible performance overhead, whether a job uses a single node (8 GPUs) or thousands. Together, these capabilities give you greater insight and control over your clusters, reducing wasted compute and accelerating iteration speed.Enable Straggler Detection
Straggler Detection is available in Private Preview for select customers. You can enable it with a cluster configuration update plus a few new environment variables in the job. Once enabled, CoreWeave Grafana dashboards surface NCCL telemetry for distributed jobs running on Slurm or other schedulers such as Kueue, with no workflow changes required. You can also disable NCCL telemetry collection and straggler detection at any time by updating your cluster configuration. For instructions, see Enable GPU Straggler Detection.Straggler detection in action
The following examples show how Straggler Detection surfaces information during a live training job, so you can see what to expect before enabling the feature on your own clusters. When you run distributed training on CoreWeave, you gain real-time visibility into GPU communication behavior through a new set of NCCL performance metrics and purpose-built Grafana dashboards. The Slurm Job Metrics dashboard surfaces these signals and exposes low-level signals such as NCCL collective communication latency, algorithmic bandwidth (AlgoBW), bus bandwidth (BusBW), message sizes, and more. Previously, gathering this data required stopping jobs and runningnccl-tests, which created downtime and slowed iteration. With Straggler Detection, CoreWeave collects the same information continuously from live jobs with negligible overhead.
The dashboards are designed for fast diagnosis and help you answer questions such as:
- Is my job slowing down because of GPU-to-GPU communication issues?
- Which GPU or node is underperforming?
- Is NVLink bandwidth performing as expected?
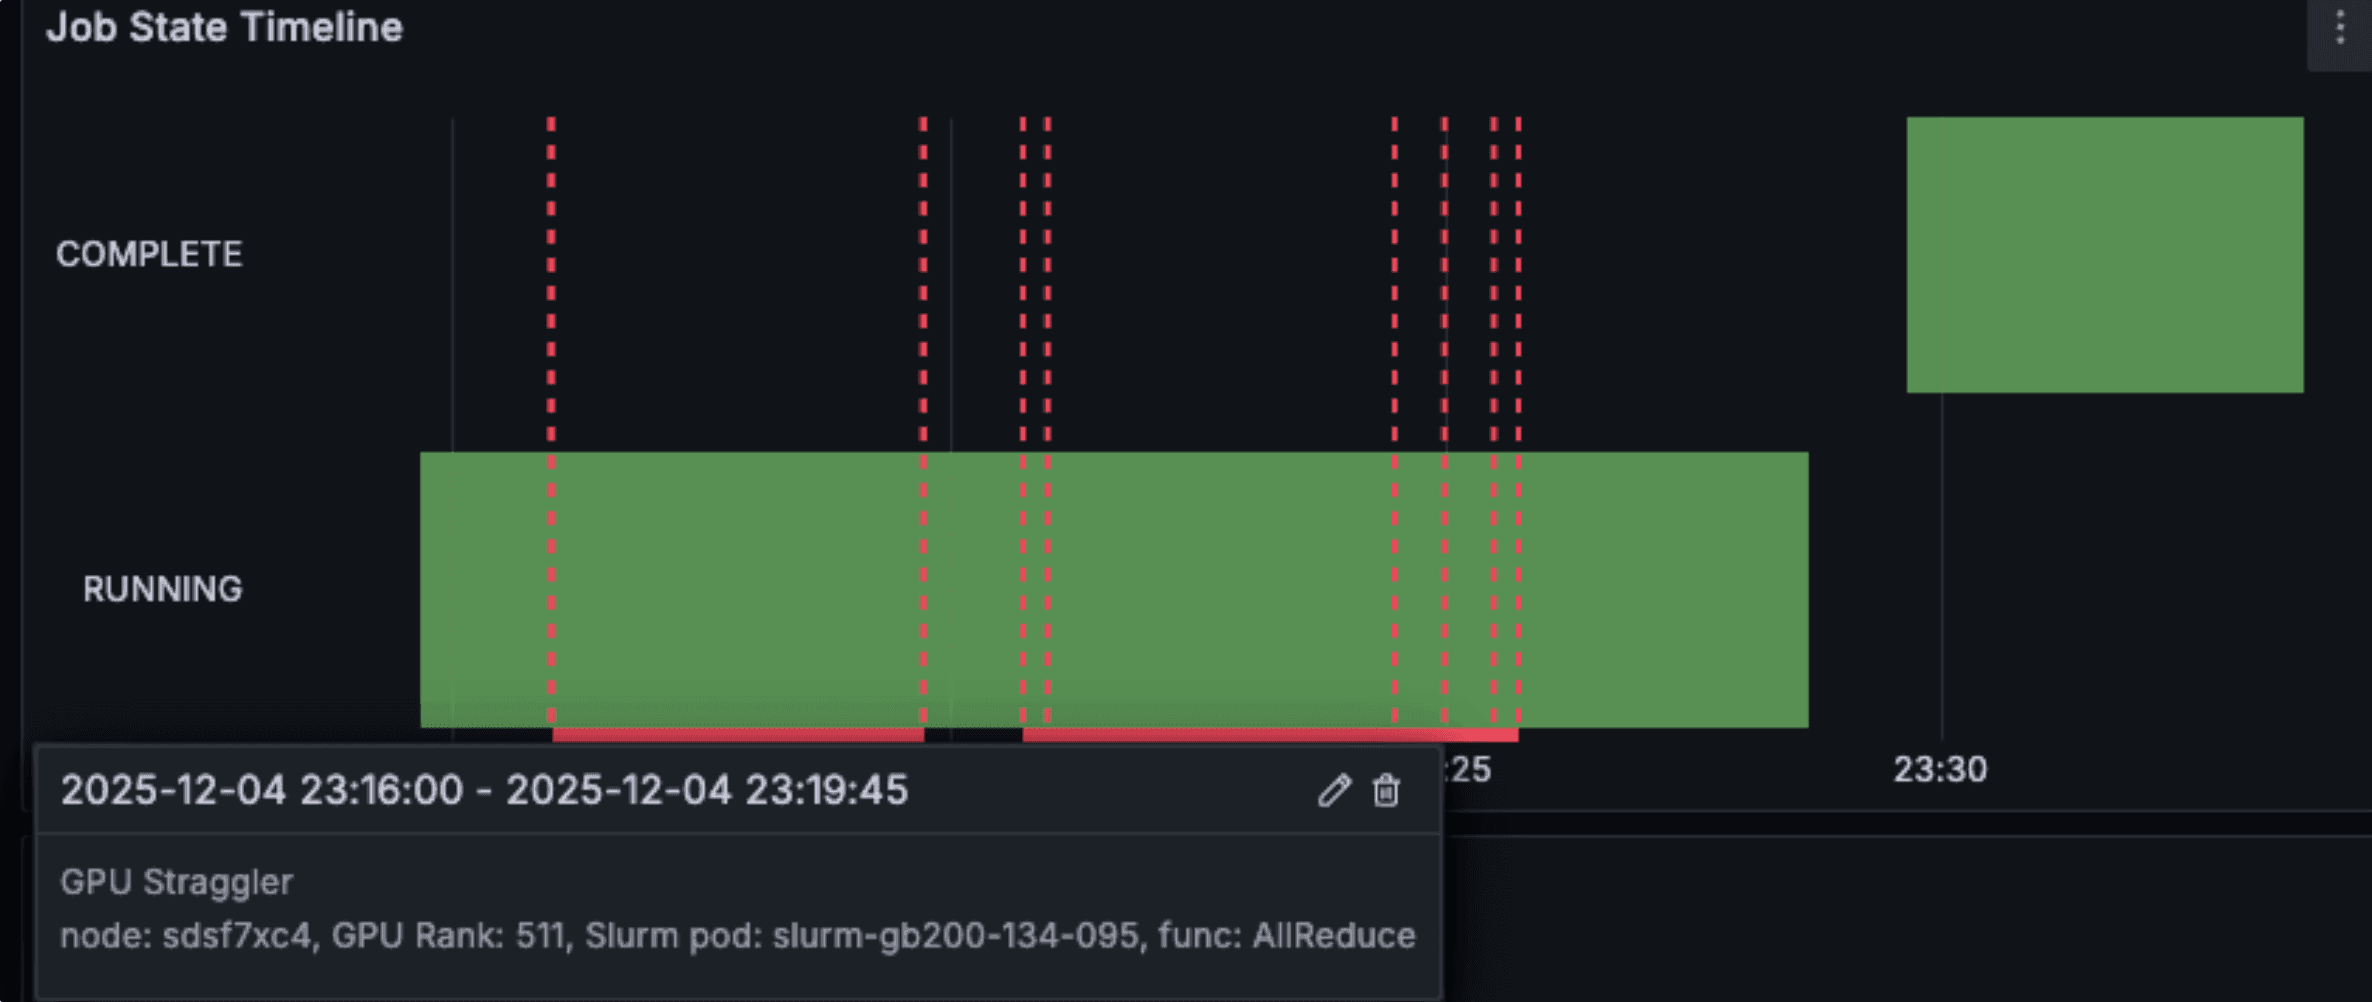
Straggler detection annotations overlaid on the Slurm job state timeline in the Slurm Job Metrics dashboard. The colored bars mark intervals where CoreWeave flagged one or more ranks as stragglers, letting you spot a problem at a glance before drilling into rank-level detail.
Example 1: Locate a slow GPU in SUNK
When you run distributed training on CoreWeave using SUNK, you can correlate the timestamp of a detected straggler with your training logs and W&B job monitoring. This lets you match symptoms in your training code with rank-level NCCL telemetry. The Straggler Detection table identifies the exact rank/GPU and node that fall behind. Each row links out to detailed Node and Pod dashboards so you can keep drilling into the health of the underlying resources. This reduces “job feels slow” debugging to pinpointing a specific GPU and node within seconds.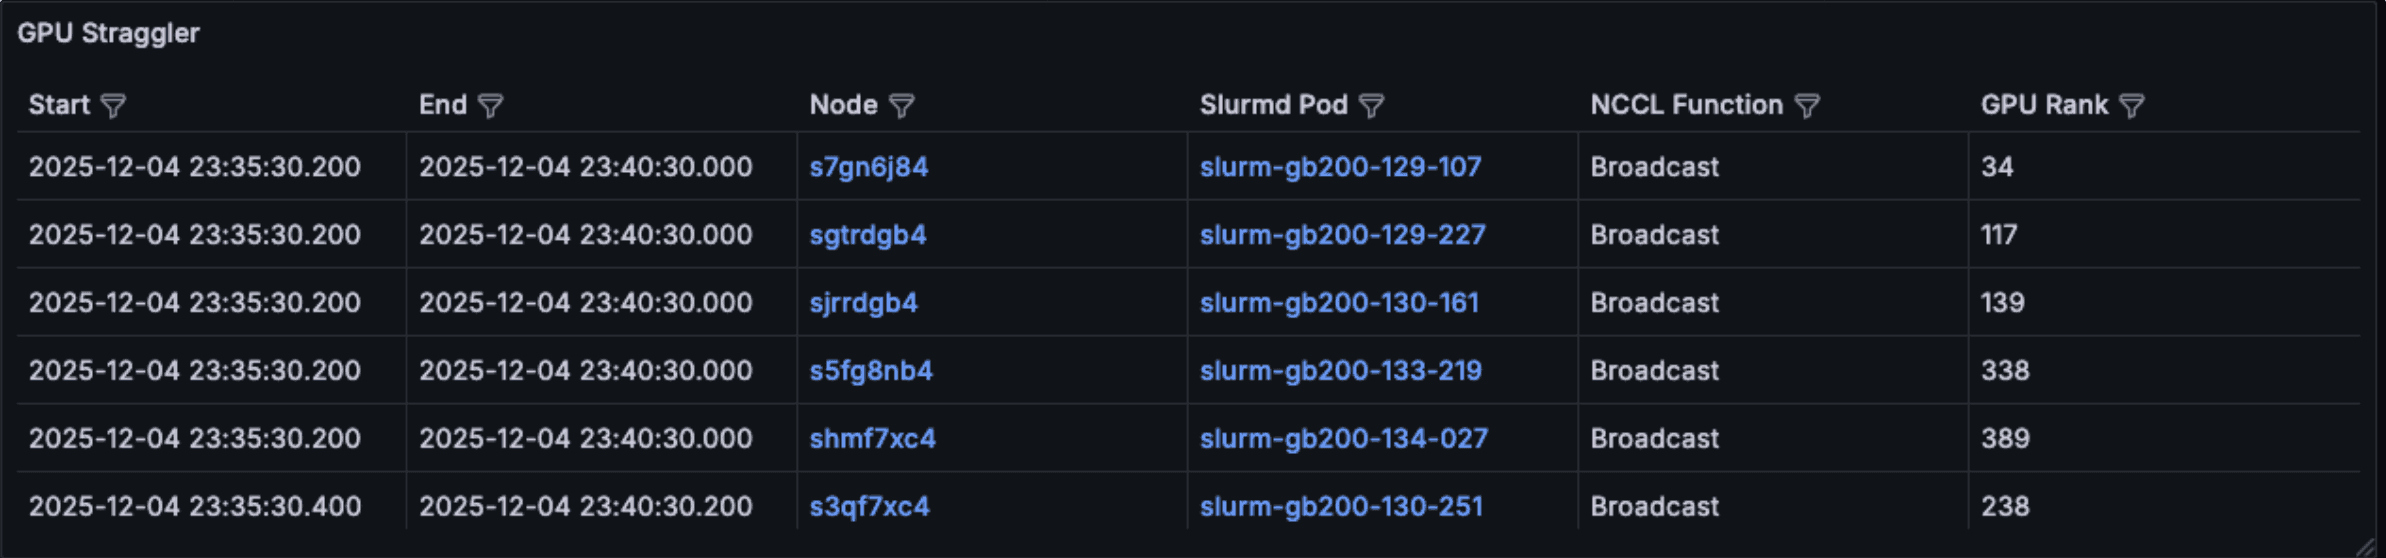
Straggler Detection table from the Slurm Job Metrics dashboard, listing each rank flagged as a straggler with links to Node and Pod detail dashboards. The table here shows an artificially large number of stragglers for illustration. In a real job, you typically see a single straggler at a time.
Example 2: Debug distributed training issues
When you investigate reduced MFU or distributed-configuration inefficiencies in otherwise healthy jobs, NCCL telemetry accelerates root-cause analysis by exposing rank-level detail across all communication groups. Dashboards present bandwidth and latency by collective and by rank for process groups of different sizes (for example, tensor parallel, pipeline parallel, and large data parallel groups). This helps you identify:- Collectives running noticeably slower in specific groups.
- Ranks consistently lagging during AllReduce, AllGather, or Broadcast.
- Imbalances between small and large parallel groups.
nccl-tests, which left expensive GPUs idle. With Straggler Detection, the same panels populate continuously from the live job, so you can diagnose bottlenecks without restarting workloads or paying the cost of idle GPUs.
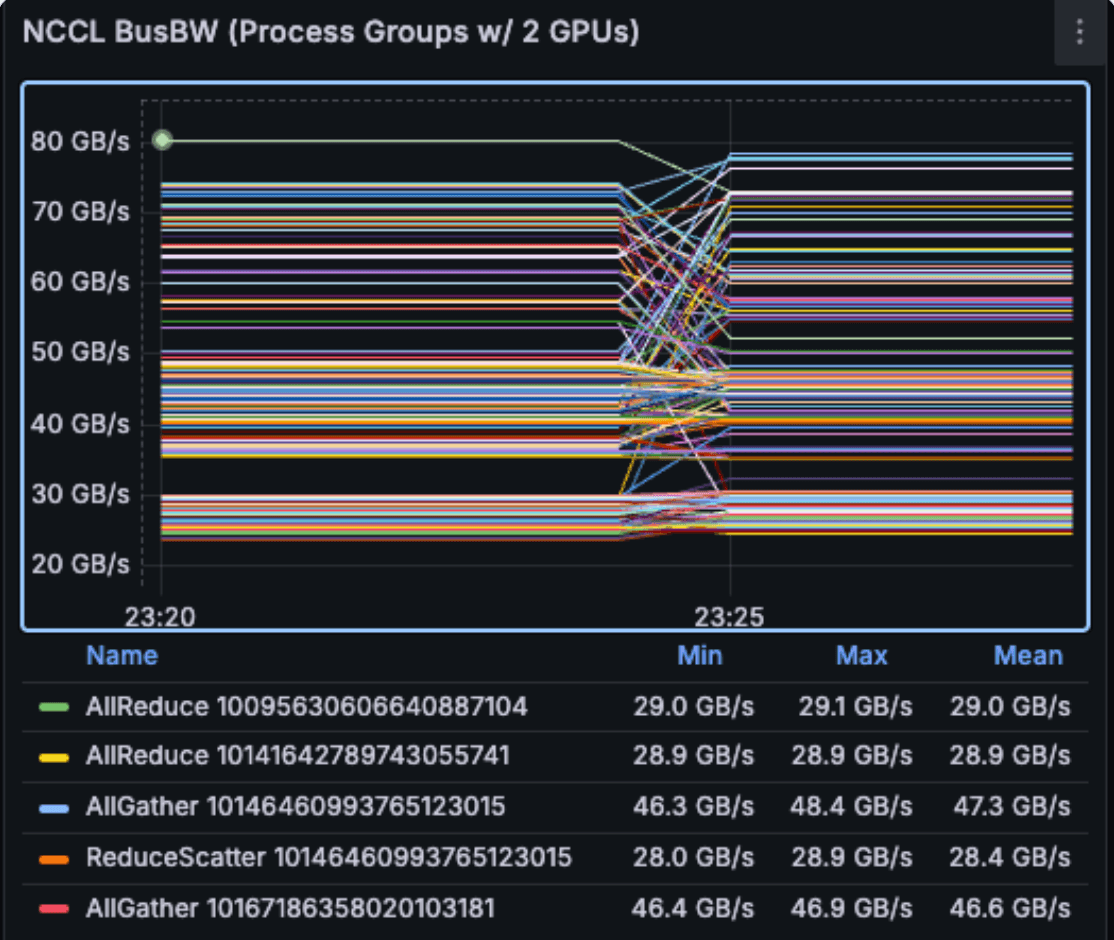
NCCL bus bandwidth (BusBW) per rank over the lifetime of the live job. Drops or sustained gaps between ranks point to communication-bound bottlenecks.
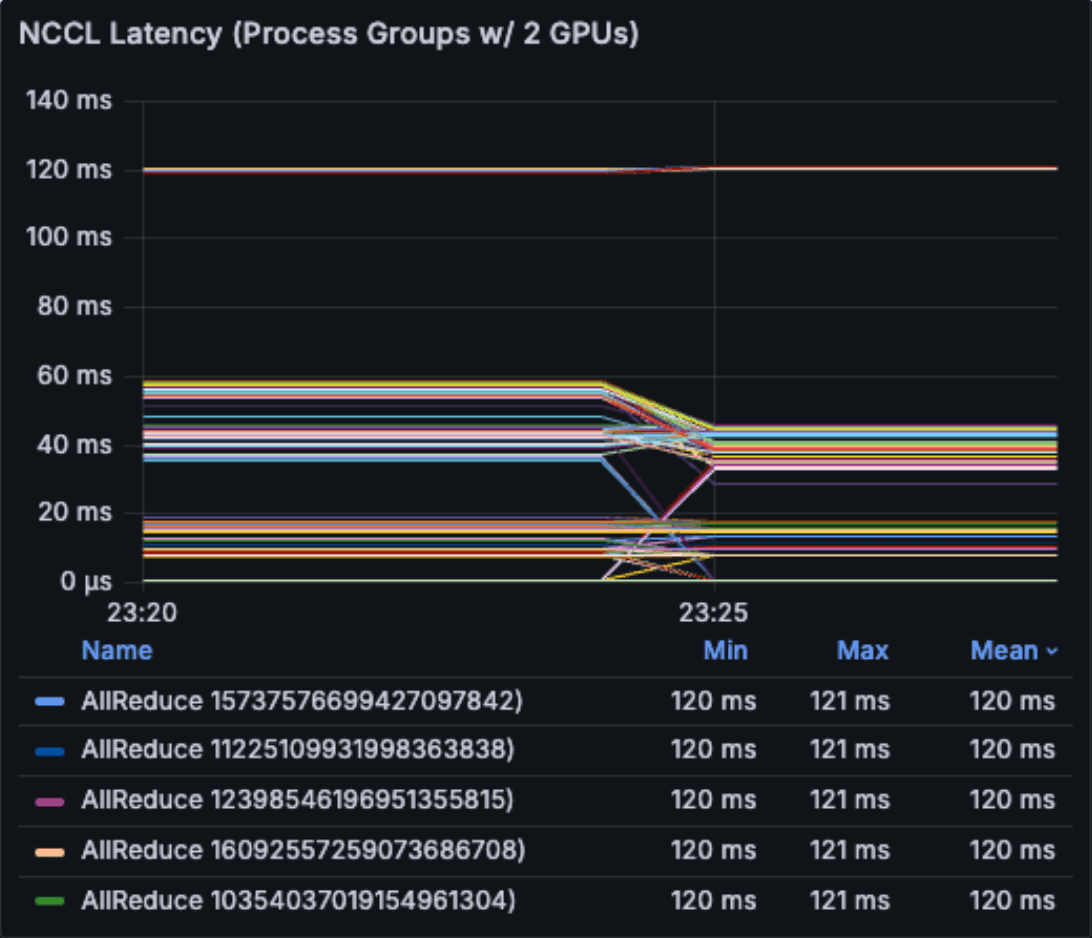
NCCL collective latency per rank over the lifetime of the live job. Outlier ranks with consistently higher latency are strong straggler candidates.