This page describes the Home dashboard in CoreWeave Grafana. It explains what each panel shows so you can interpret the environment overview and status information at a glance.
To view the dashboard, go to the Home dashboard.
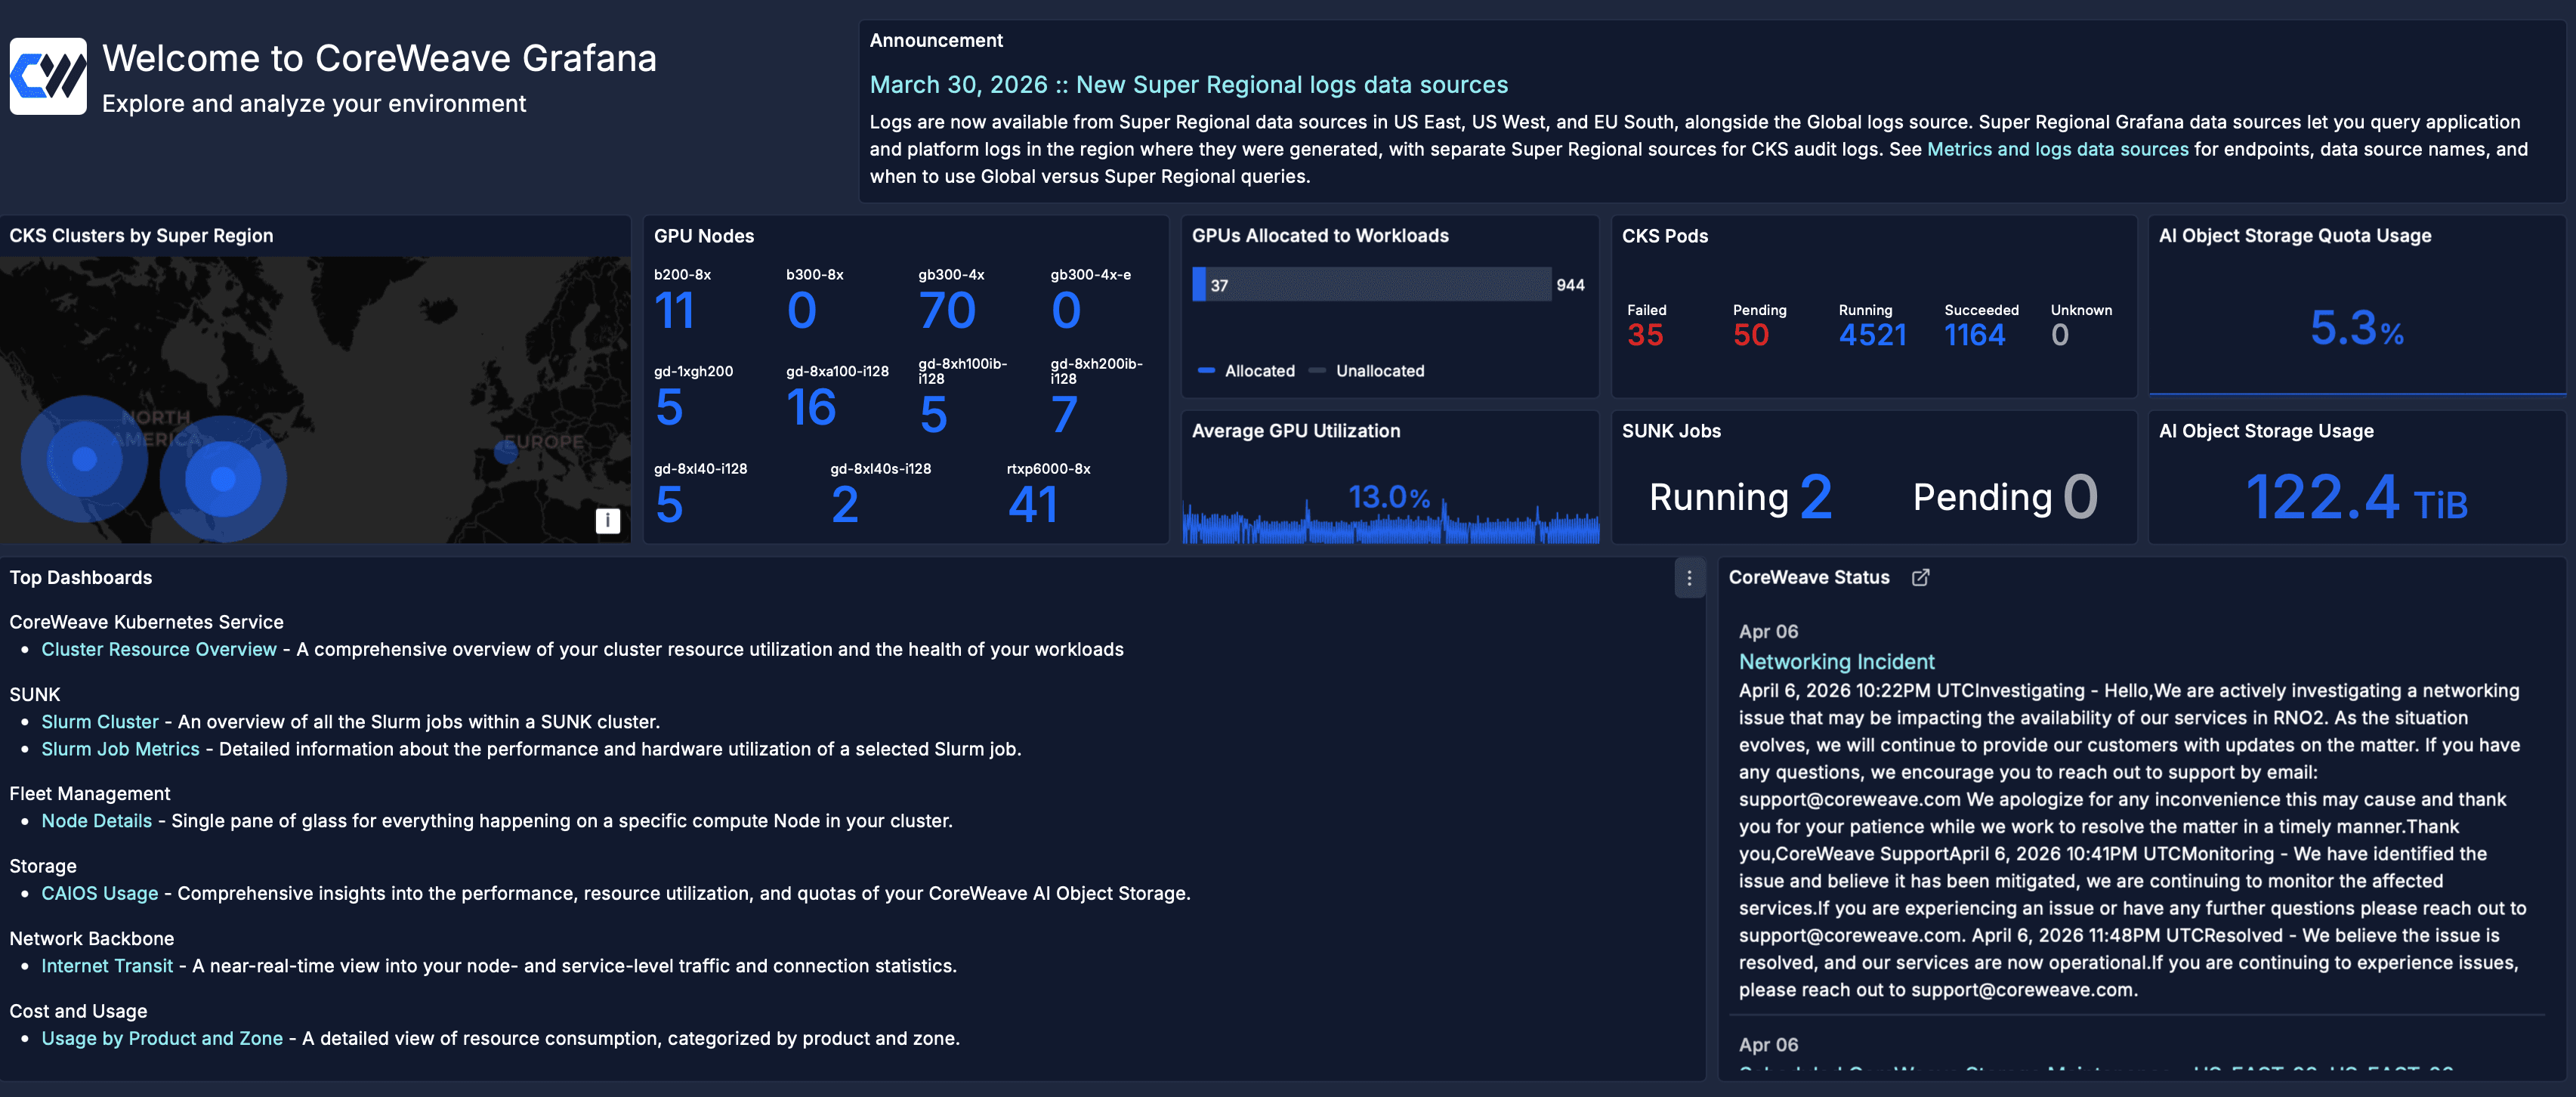
The Home dashboard is the default landing experience when you open CoreWeave Grafana. It provides a real-time snapshot of your CoreWeave environment across CoreWeave Kubernetes Service (CKS), SUNK, and storage. The dashboard also shows the latest platform announcements and live CoreWeave service status. Use this information to determine whether a platform issue affects your workloads.
You can use this dashboard in the following ways:
- Check the current state of your GPU fleet, Pods, and storage at a glance.
- Stay informed about platform announcements and changes.
- Navigate to frequently used dashboards.
- Determine whether an active CoreWeave incident affects your workloads.
Panel descriptions
The following sections describe the main panel groups on the Home dashboard, from the announcement and metrics area through quick links and service status.
Announcement
The Announcement panel highlights the latest platform announcement at the top of the dashboard. It can include new feature availability, data source or logging changes, and other updates that affect how you monitor or navigate your environment.
Environment overview
The environment overview panels provide top-level metrics across your CKS environments and workloads. The following table describes each panel in this group.
Top dashboards
The Top dashboards panel groups quick links to frequently used dashboards by product area. Each entry includes a short description so you can open the right dashboard without browsing the full library.
CoreWeave status
The CoreWeave Status panel displays a live feed of recent incidents and maintenance events from the CoreWeave status page. Each entry shows the date, incident title, and status updates. Use this panel to determine whether an active platform issue affects your environment. Last modified on June 10, 2026

