For instructions about accessing CoreWeave Grafana dashboards, see Access and use CoreWeave Grafana dashboards.
API server
The API server panels provide real-time monitoring of your API server’s performance and health. The panels show metrics related to request rates, latencies, CPU usage, and memory usage.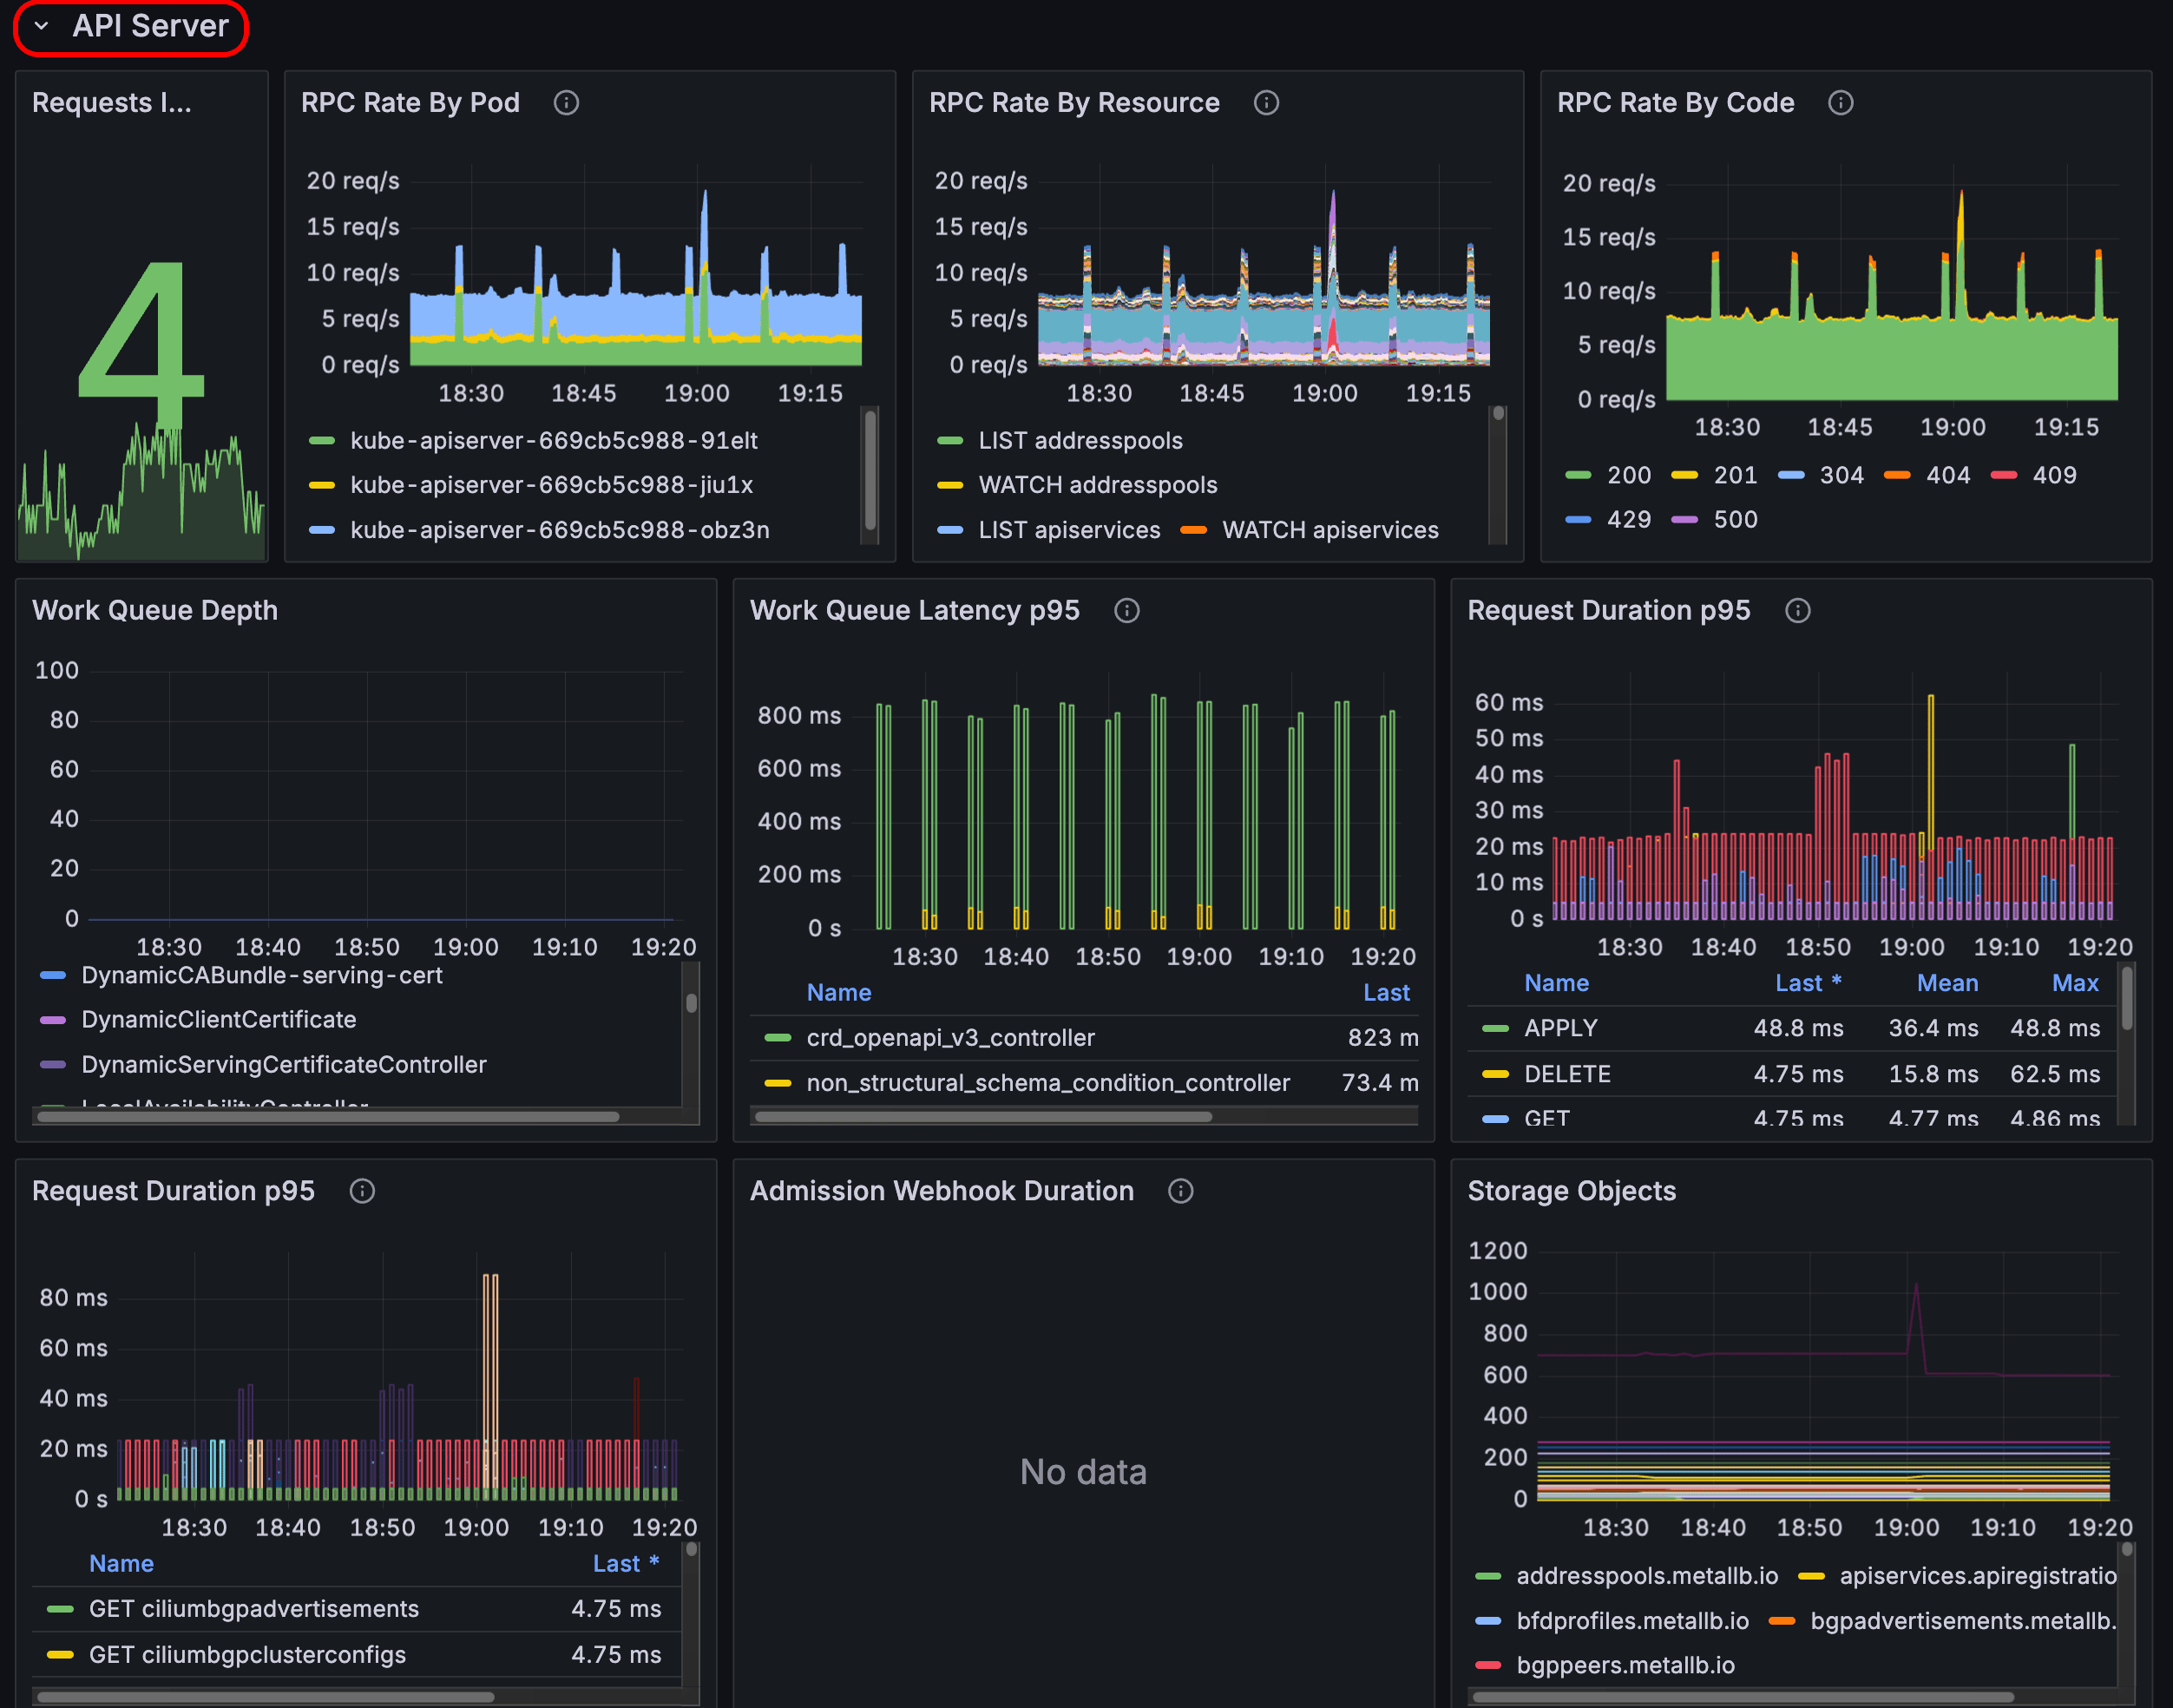
etcd
The etcd panels show the performance and health of the etcd cluster. The panels show metrics such as put rates, range rates, synchronization durations, CPU usage, and memory usage.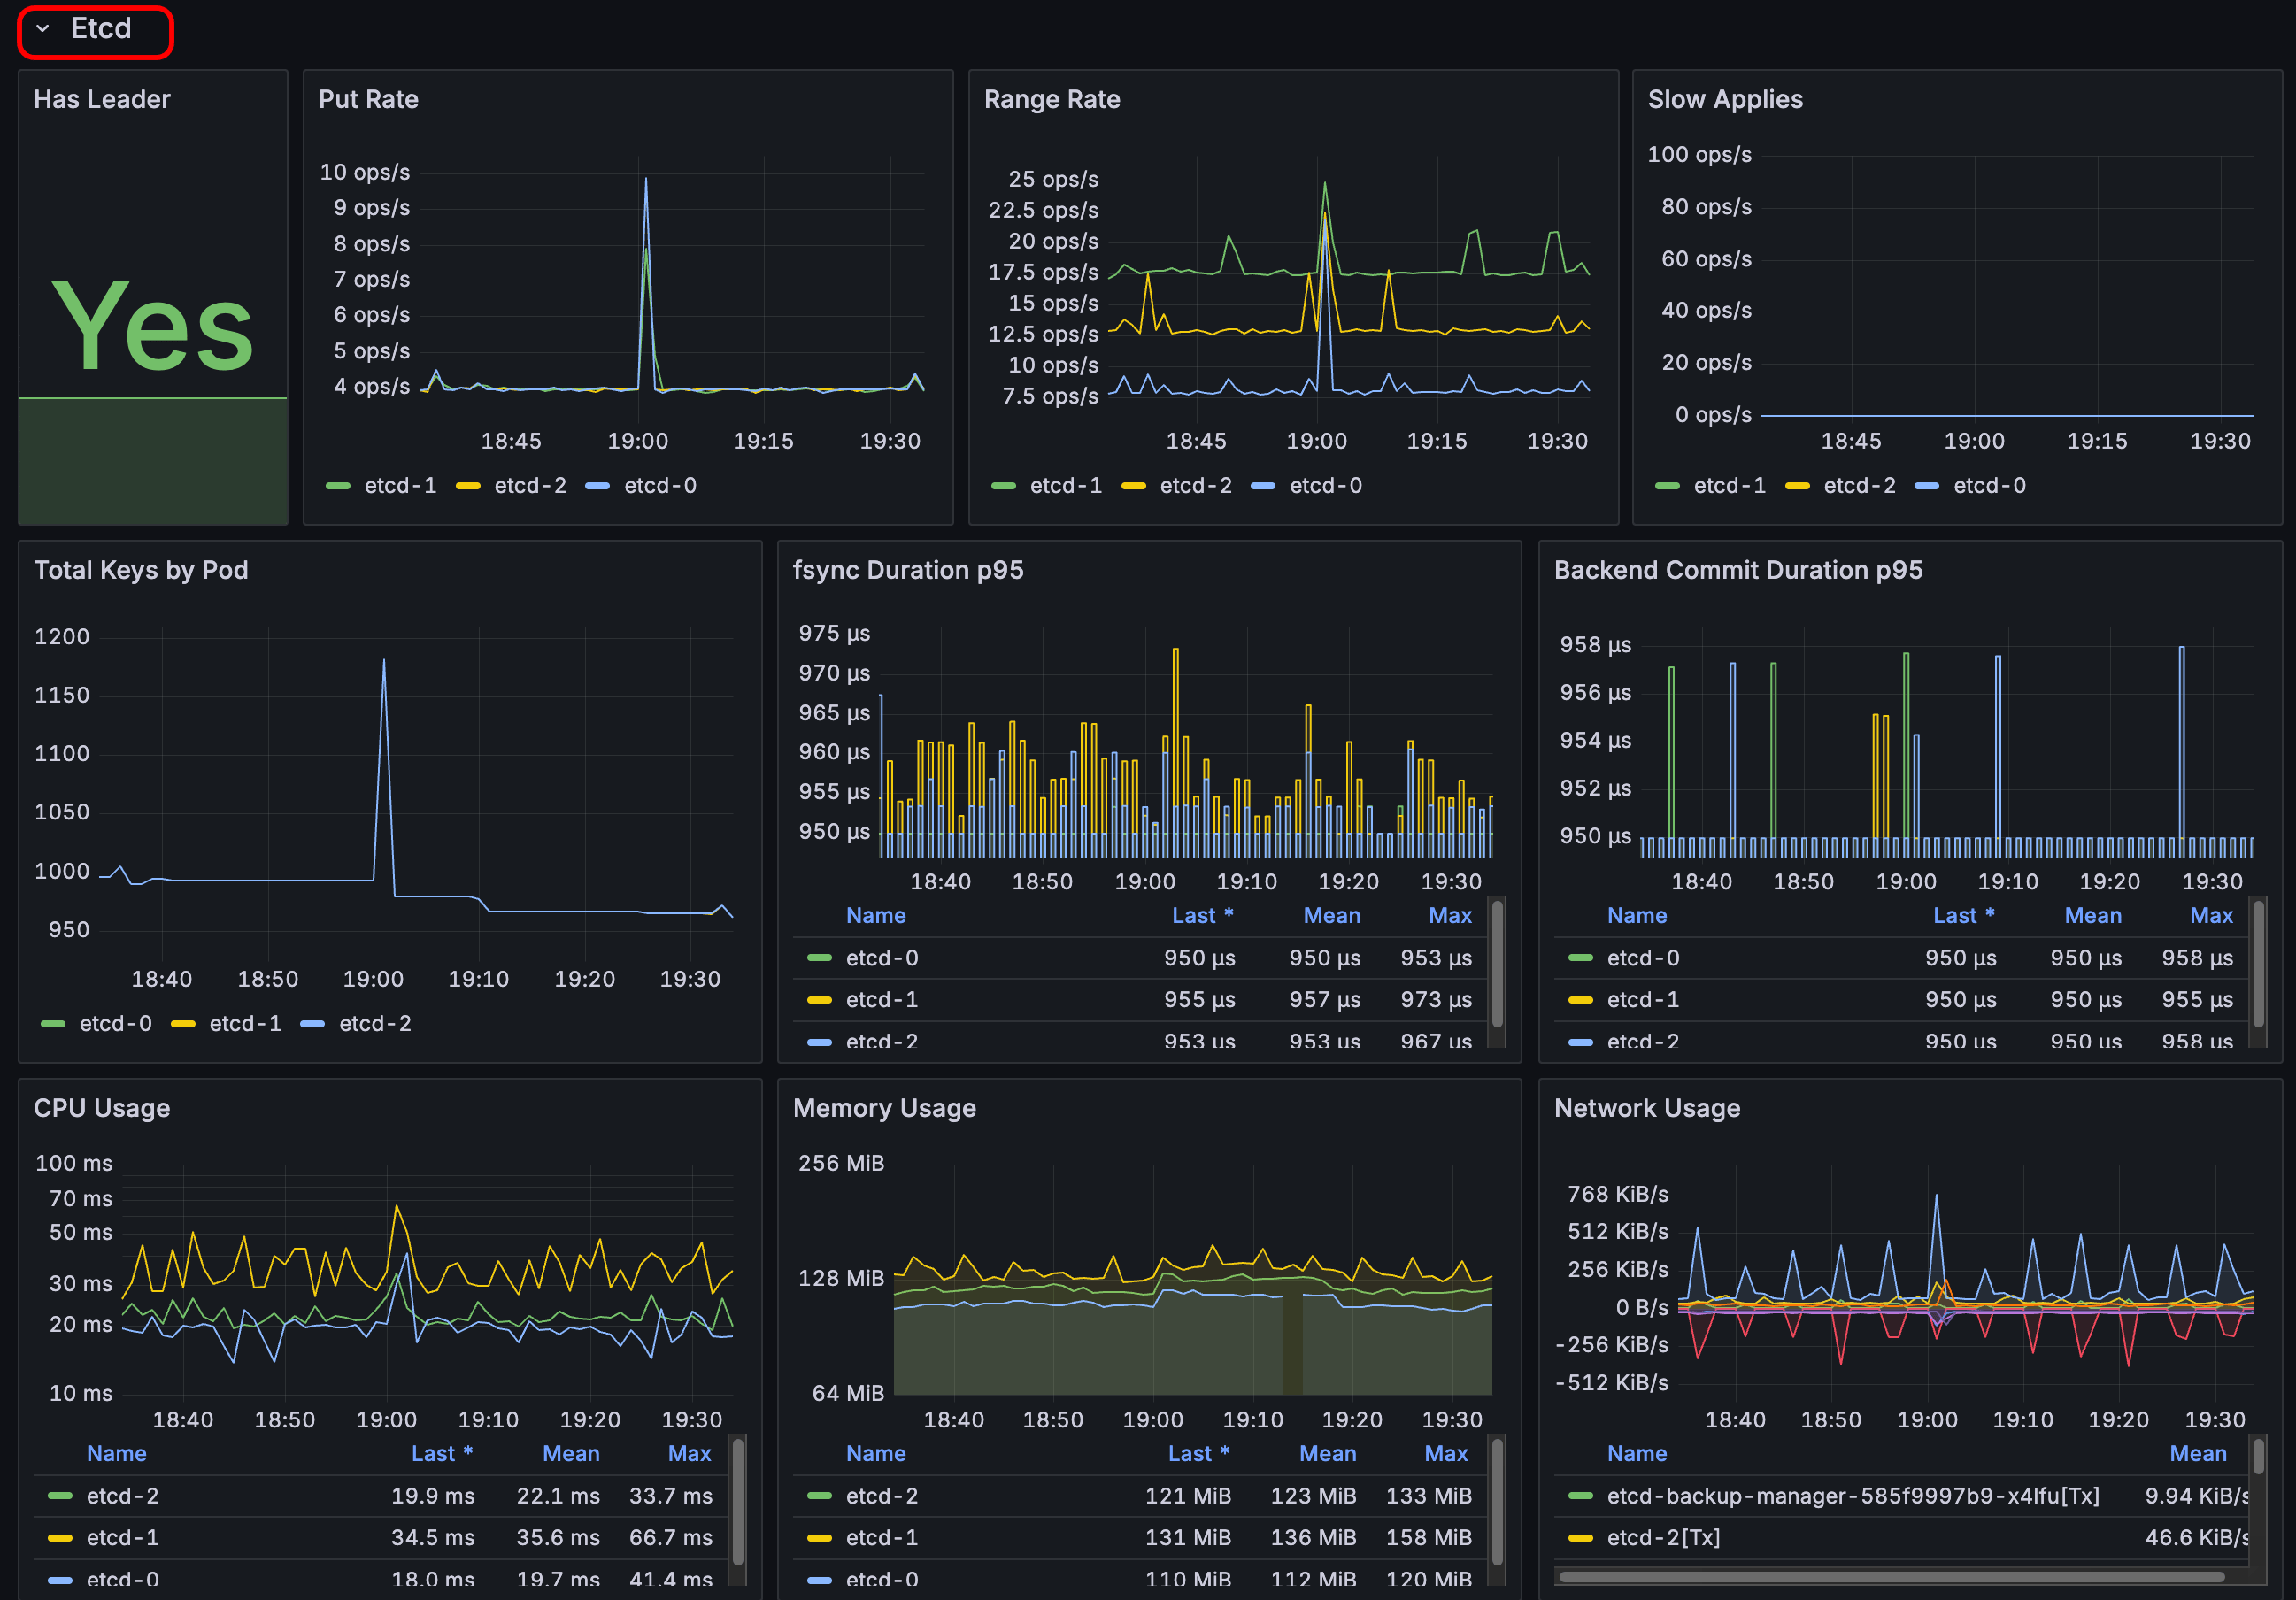
Controller manager
The controller manager panels show the performance and resource utilization of the Kubernetes controller manager. The panels display metrics such as request rates and durations, CPU usage, and memory usage.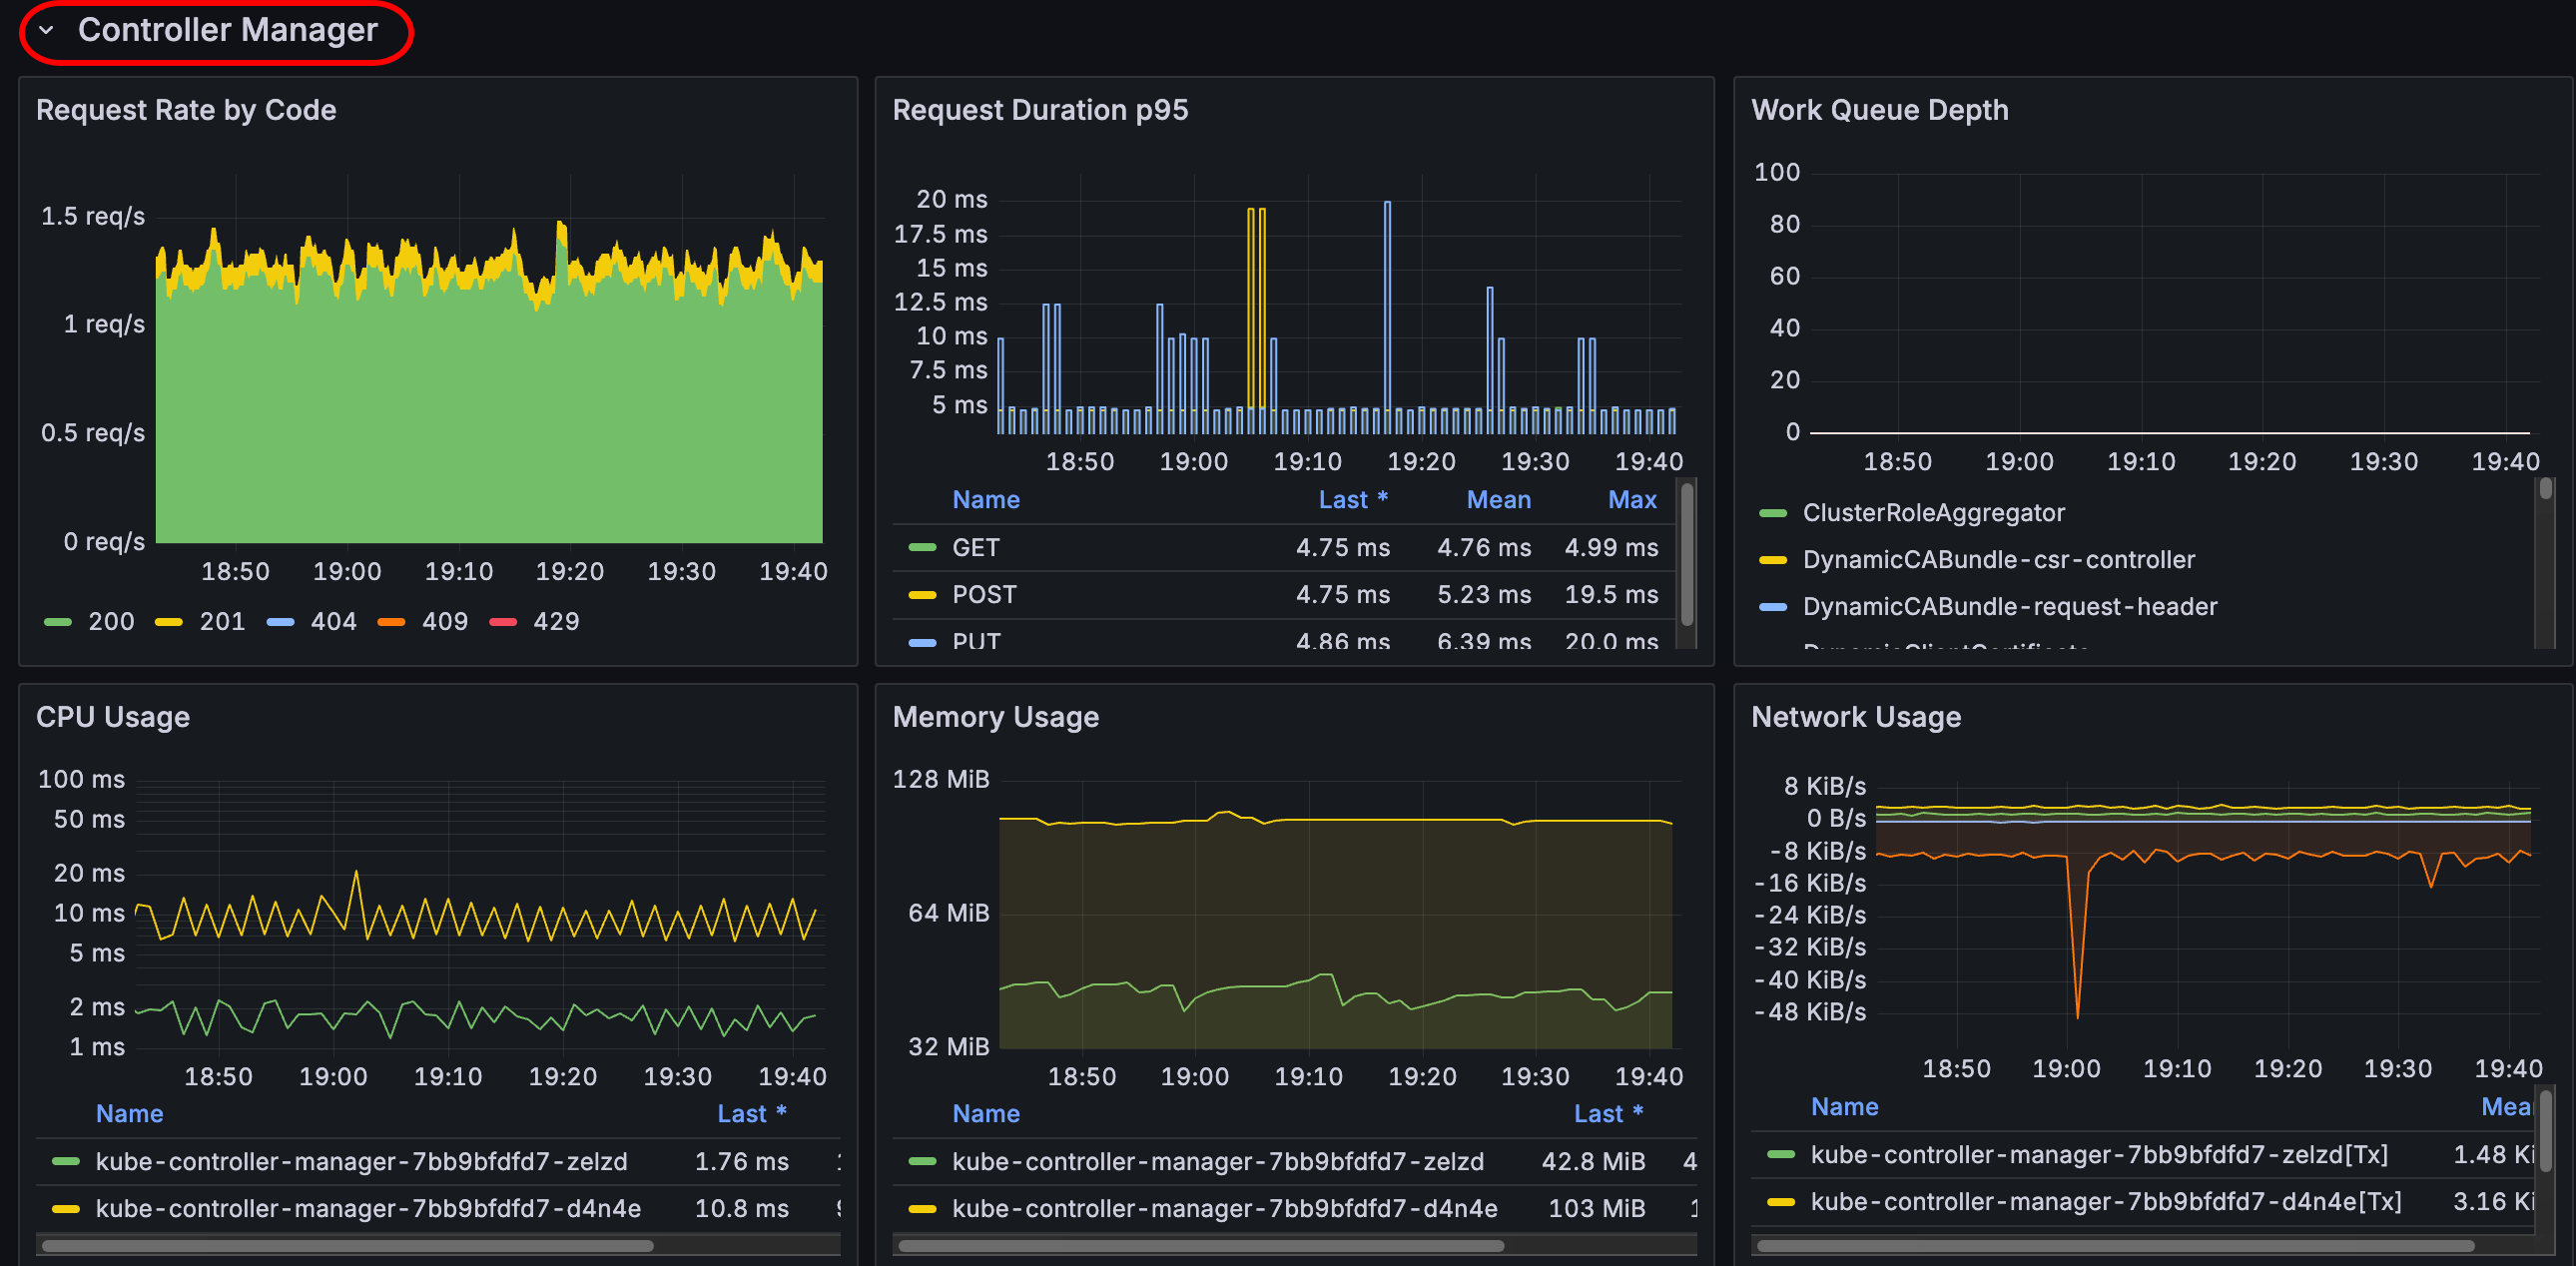
Scheduler
The scheduler panels show metrics related to request rates, scheduling durations, and resource usage such as CPU and memory.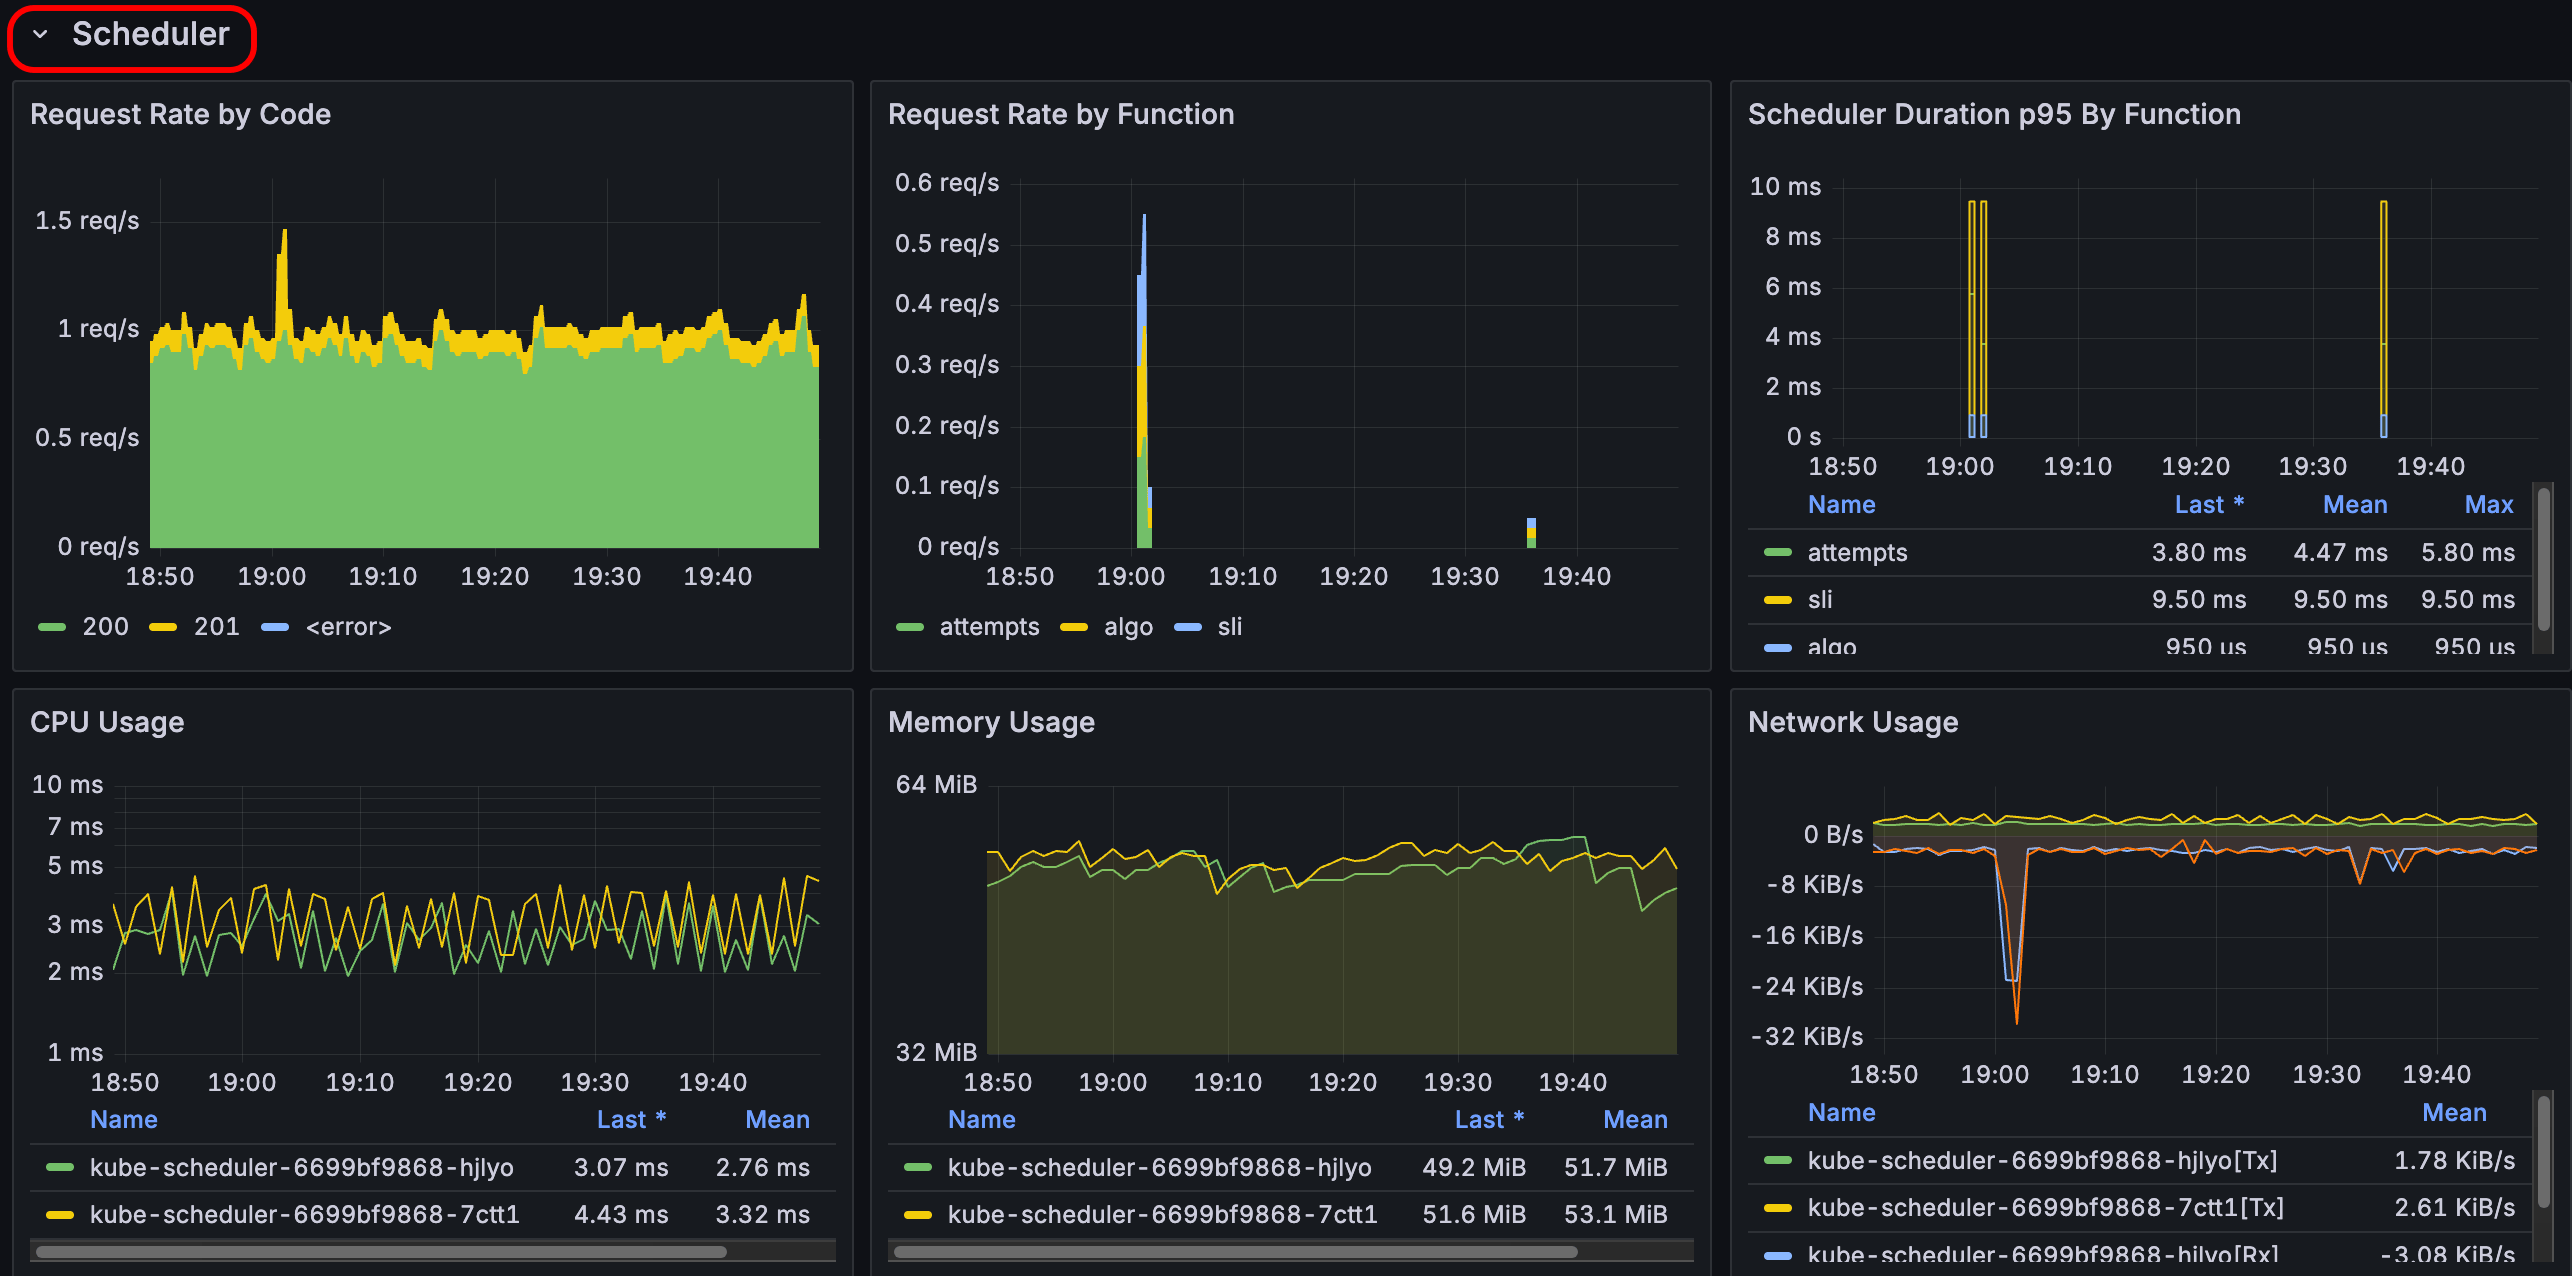
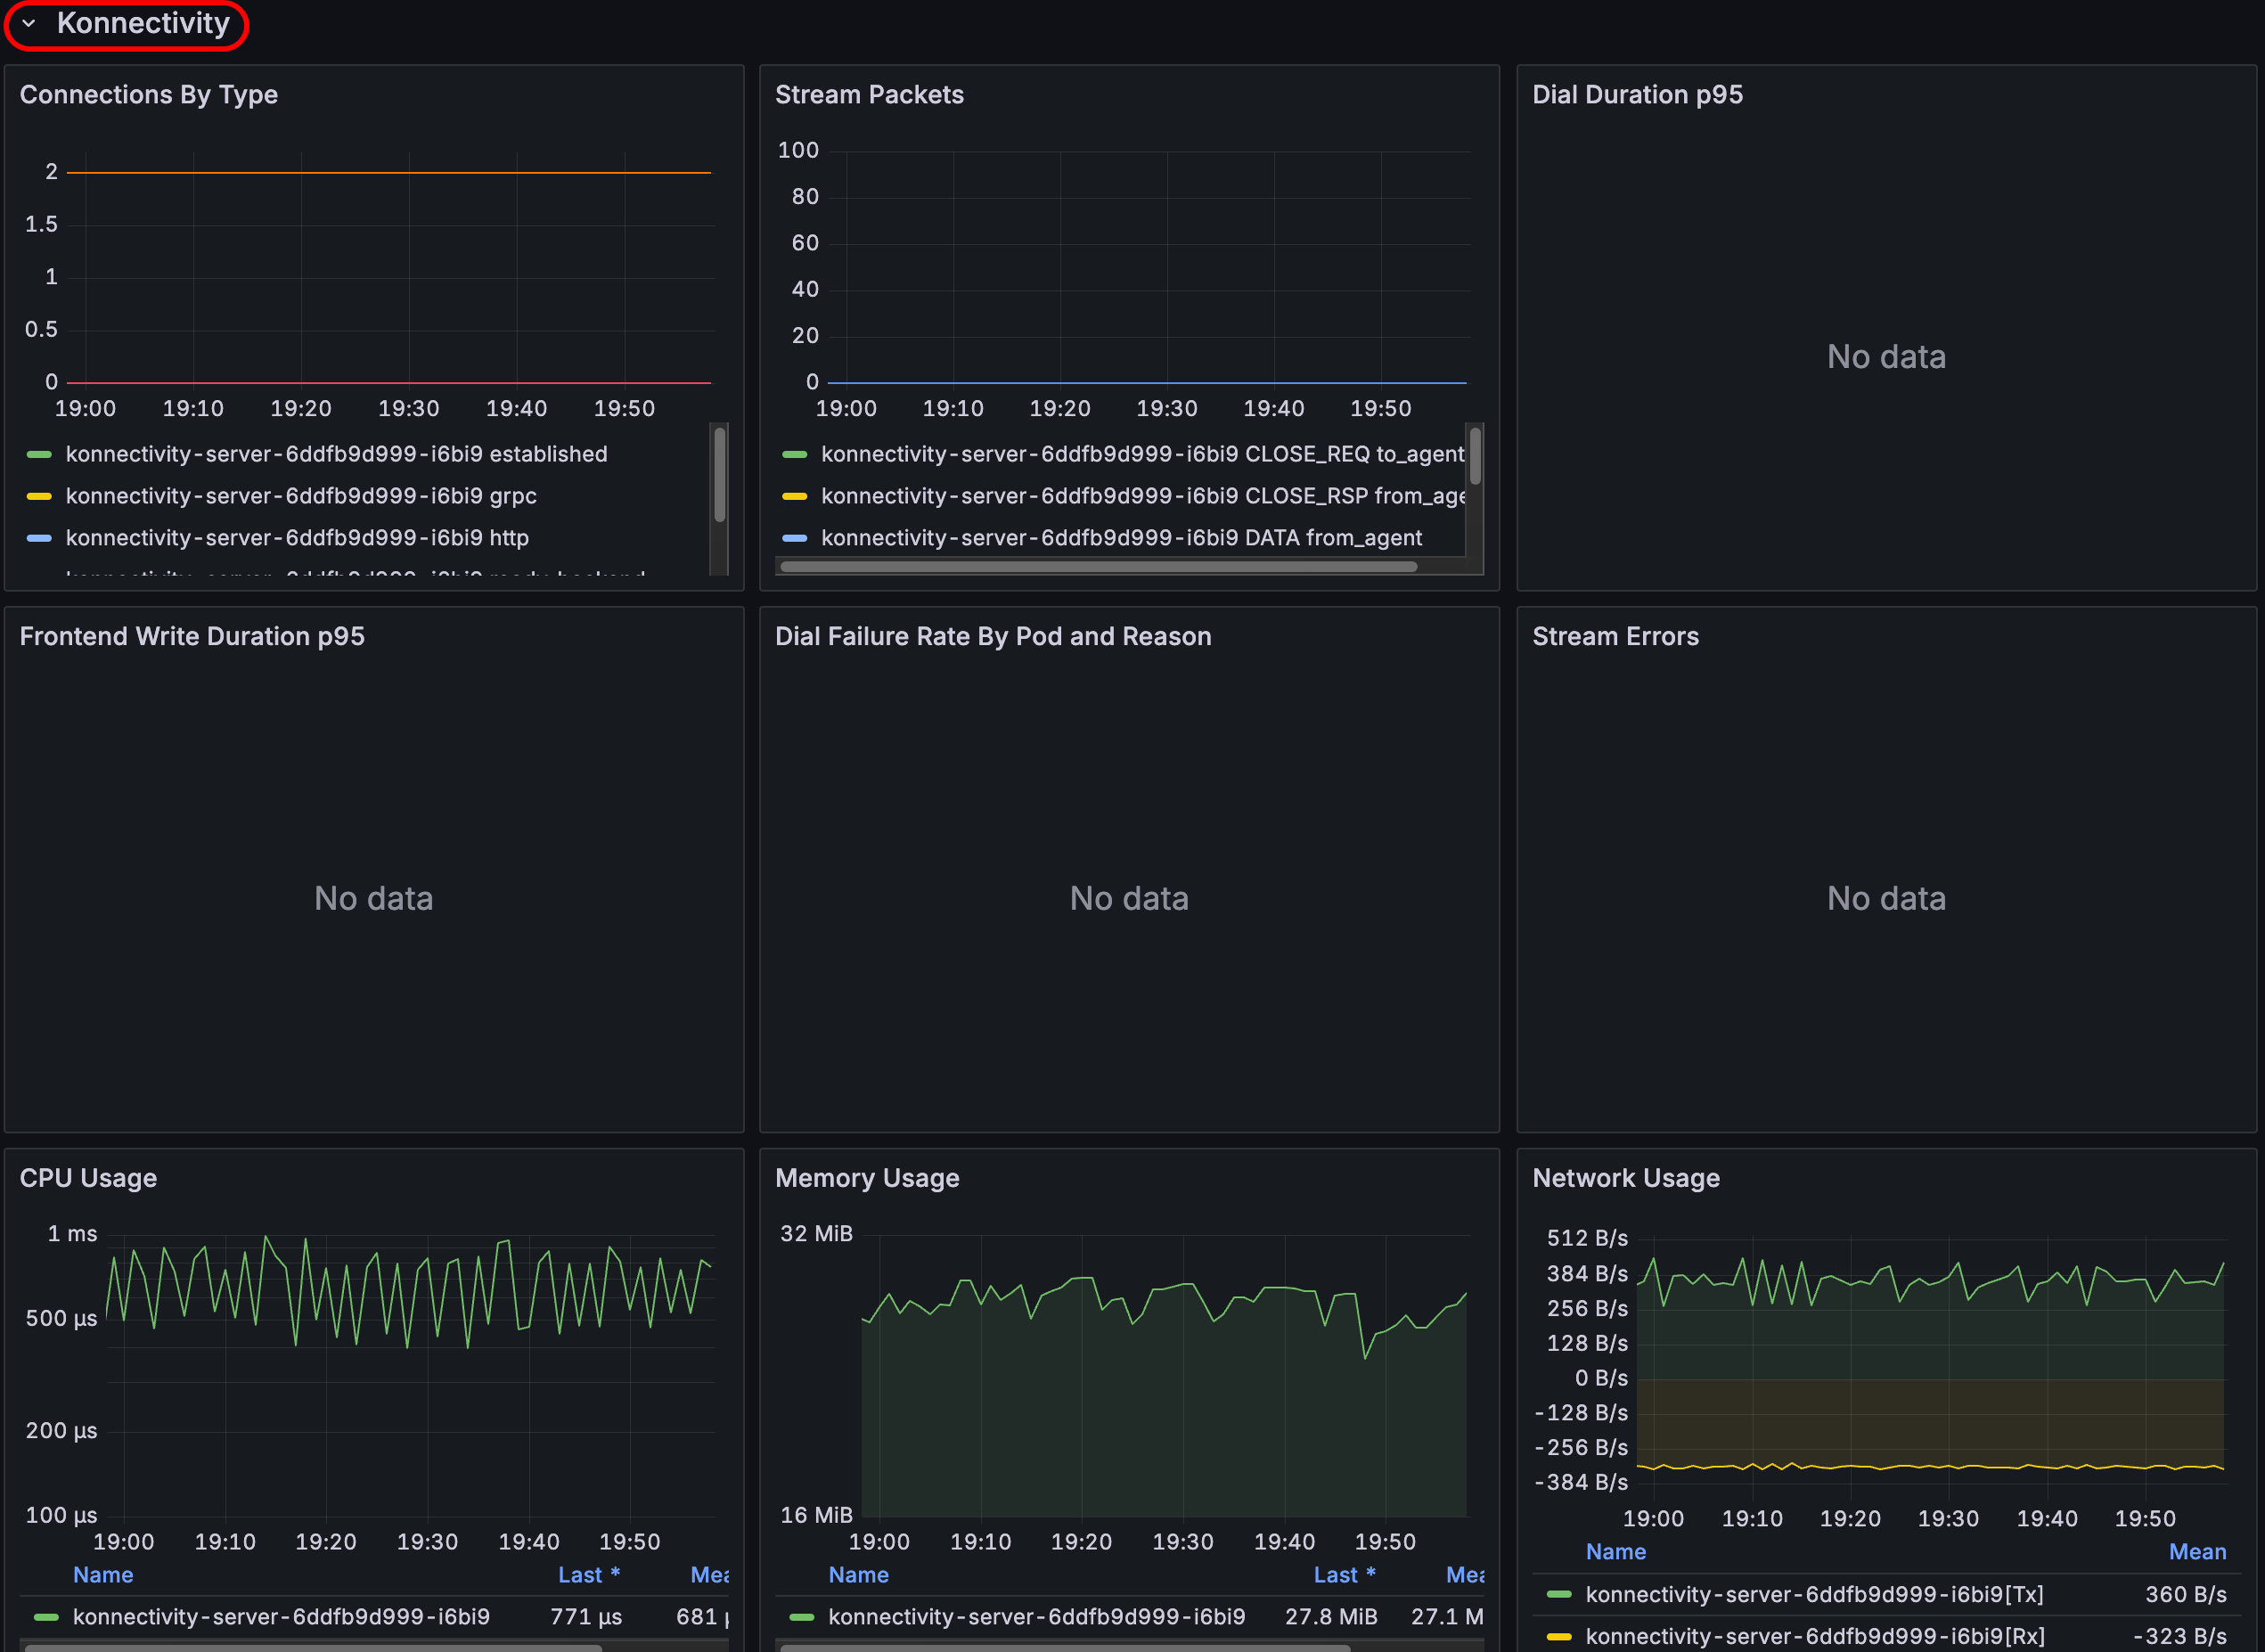
Konnectivity
The Konnectivity panels show metrics related to network connectivity and communication within the cluster, such as the number of established connections, stream packets, dial durations, and CPU and memory usage for connectivity-related components.