Evaluate models with Weave
W&B Weave is a purpose-built toolkit for evaluating LLMs and GenAI applications. It provides comprehensive evaluation capabilities including scorers, judges, and detailed tracing to help you understand and improve model performance. Weave integrates with Weights & Biases, allowing you to evaluate models stored in your Model Registry.
Key features for model evaluation
- Scorers and judges: Pre-built and custom evaluation metrics for accuracy, relevance, coherence, and more
- Evaluation datasets: Structured test sets with ground truth for systematic evaluation
- Model versioning: Track and compare different versions of your models
- Detailed tracing: Debug model behavior with complete input/output traces
- Cost tracking: Monitor API costs and token usage across evaluations
Getting started: Evaluate a model from Registry
Download a model from Registry and evaluate it using Weave:
Integrate Weave evaluations with Weights & Biases
The Models and Weave Integration Demo shows the complete workflow for:
- Load models from Registry: Download fine-tuned models stored in Registry
- Create evaluation pipelines: Build comprehensive evaluations with custom scorers
- Log results back to Weights & Biases: Connect evaluation metrics to your model runs
- Version evaluated models: Save improved models back to the Registry
Log evaluation results to both Weave and Weights & Biases:
Advanced Weave features
Custom scorers and judges
Create sophisticated evaluation metrics tailored to your use case:
Batch evaluations
Evaluate multiple model versions or configurations:
Next steps
Evaluate models with tables
Use W&B Tables to:
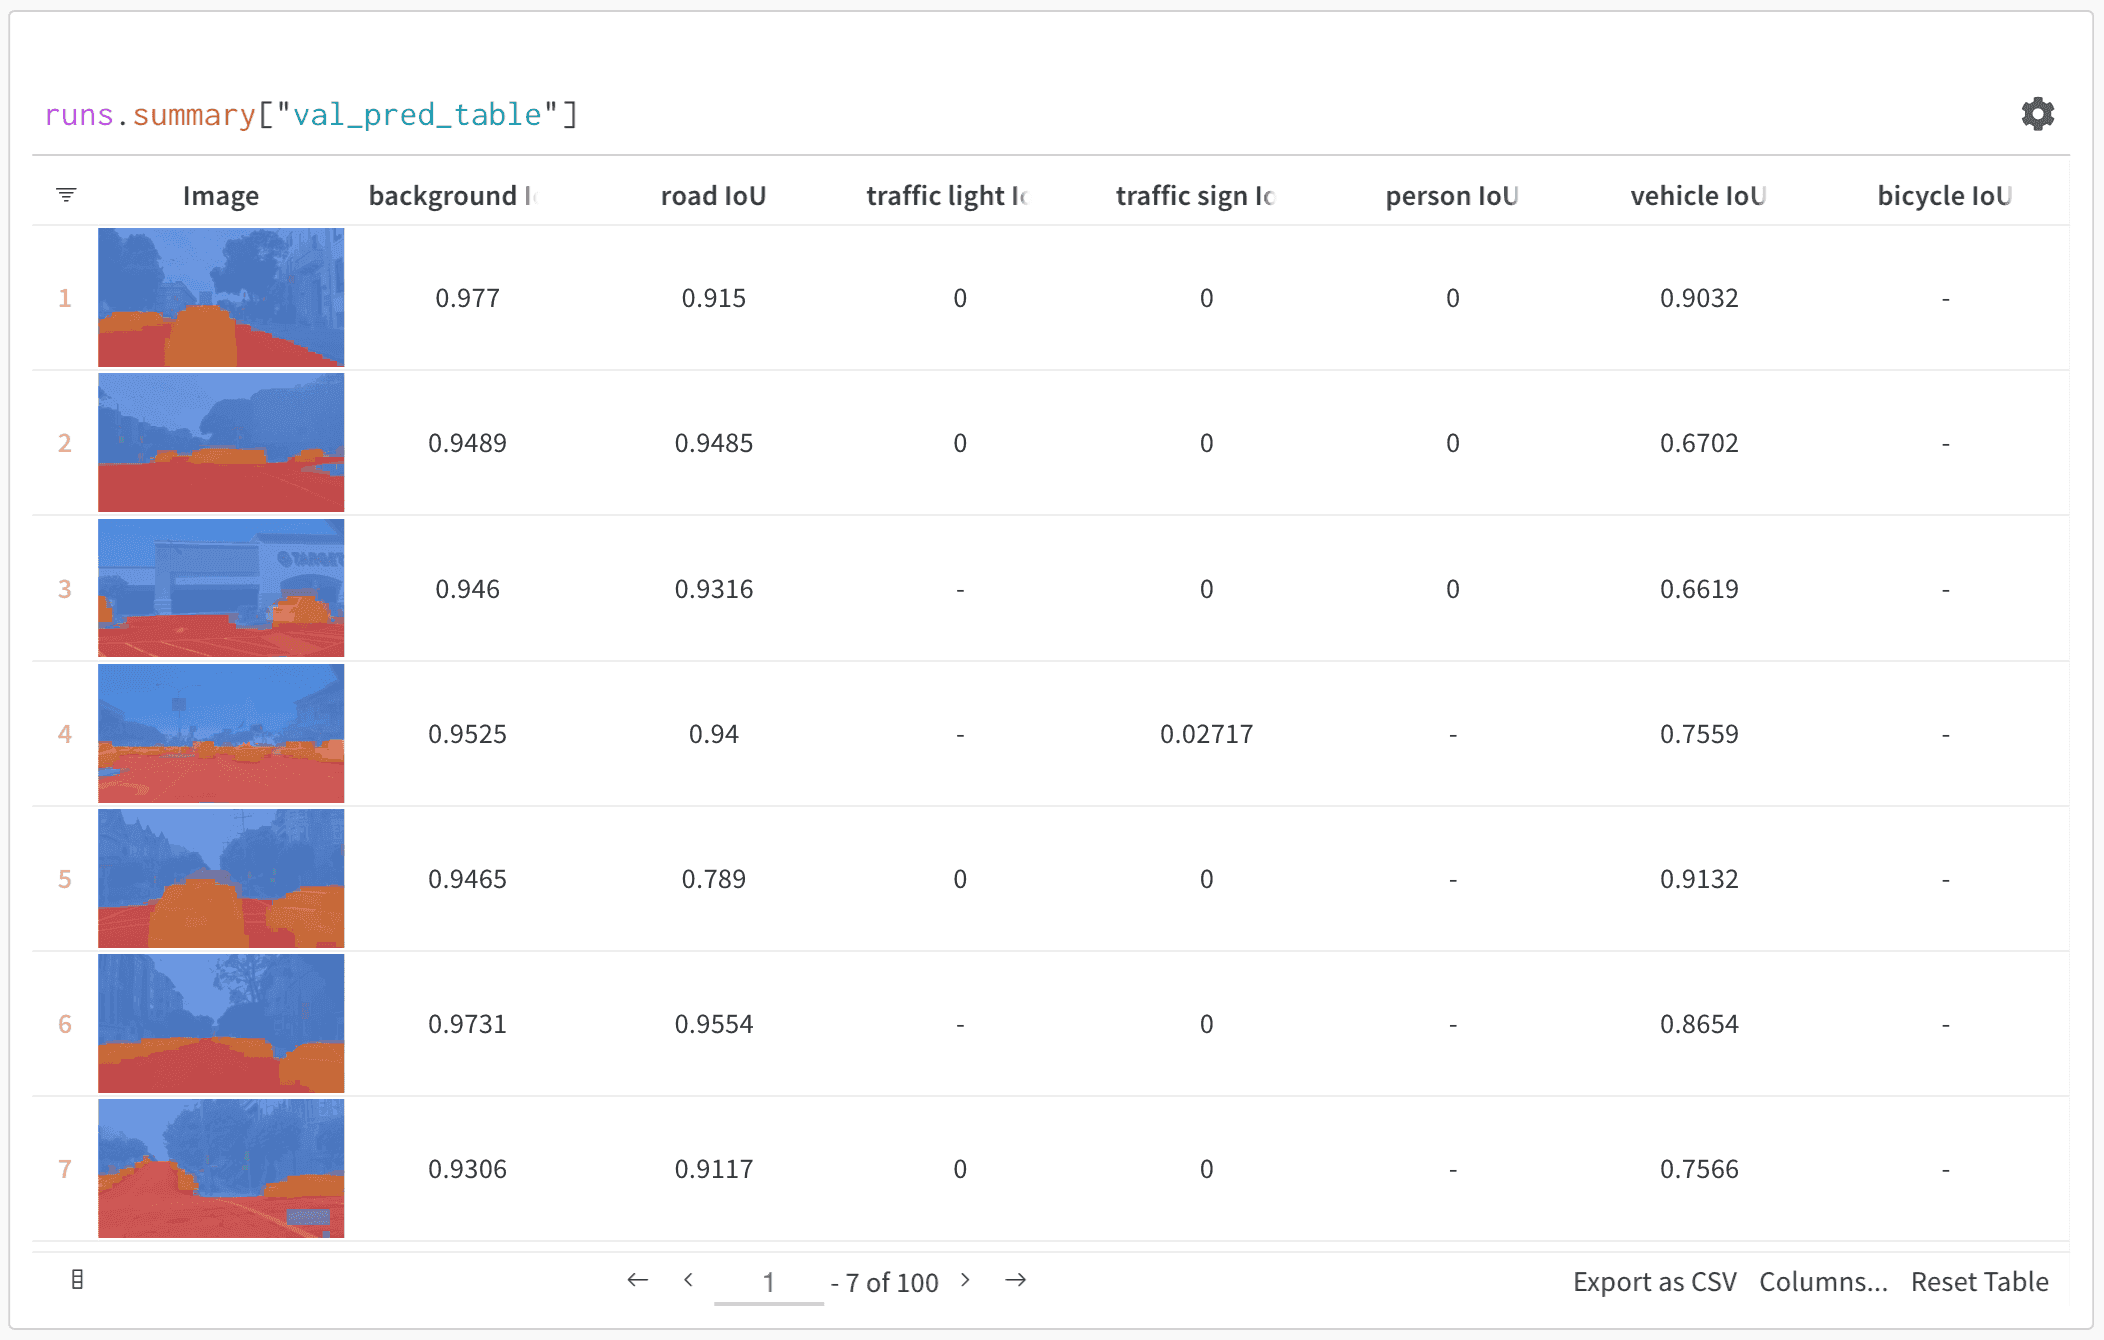
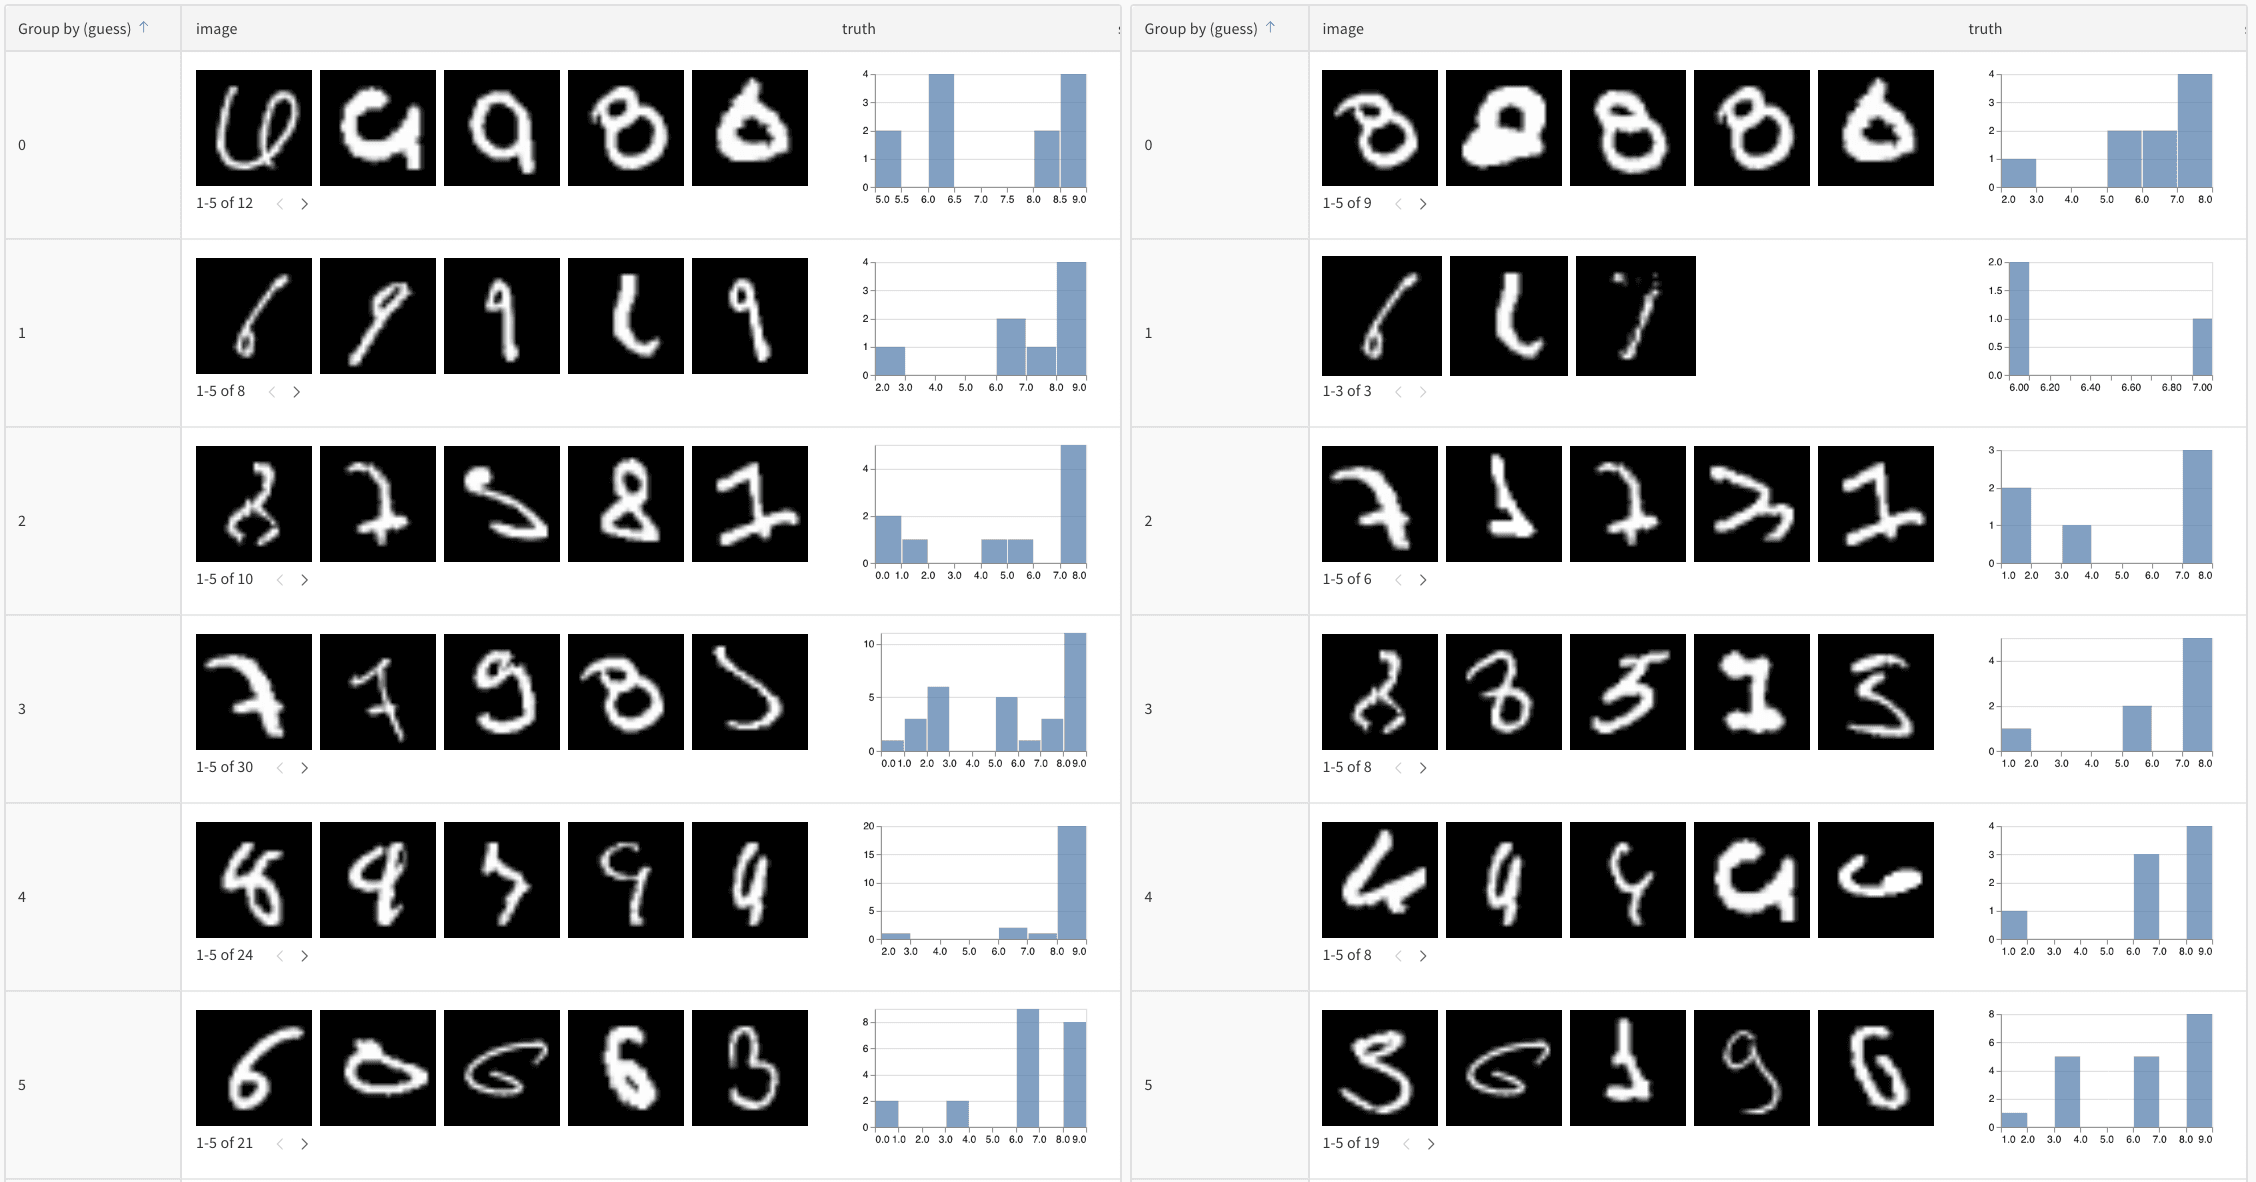
- Compare model predictions: View side-by-side comparisons of how different models perform on the same test set
- Track prediction changes: Monitor how predictions evolve across training epochs or model versions
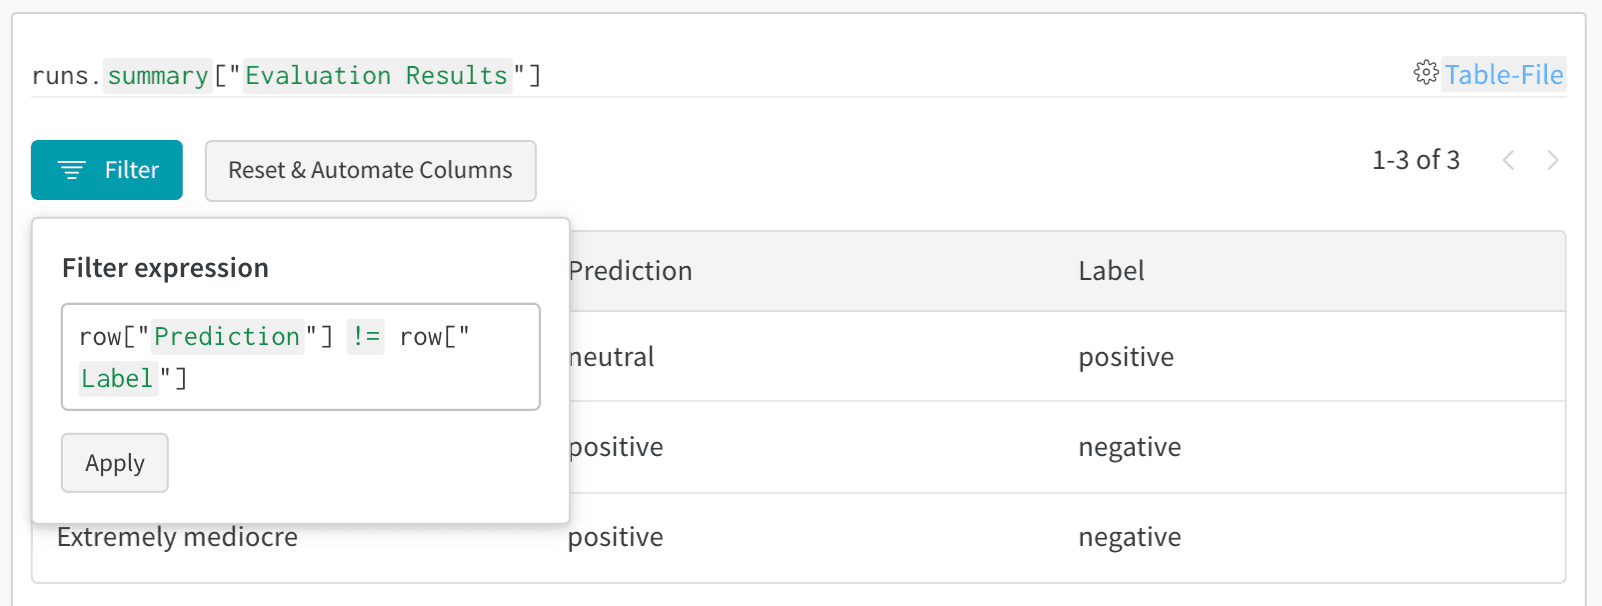
- Analyze errors: Filter and query to find commonly misclassified examples and error patterns
- Visualize rich media: Display images, audio, text, and other media types alongside predictions and metrics
Basic example: Log evaluation results
Advanced table workflows
Compare multiple models
Log eval tables from different models to the same key for direct comparison:
Track predictions over time
Log tables at different training epochs to visualize improvement:
Interactive analysis in the W&B UI
Once logged, you can:
- Filter results: Click on column headers to filter by prediction accuracy, confidence thresholds, or specific classes
- Compare tables: Select multiple table versions to see side-by-side comparisons
- Query data: Use the query bar to find specific patterns (for example,
"correct" = false AND "confidence" > 0.8)
- Group and aggregate: Group by predicted class to see per-class accuracy metrics
Example: Error analysis with enriched tables
Last modified on September 30, 2026