Agent Lens gives you a turn-by-turn record of every conversation your agent had, along with token usage, tool invocations, and execution spans.
The page covers how to view and navigate agent activity in Agent Lens’s Overview and Conversations tabs.
View agent activity in Overview
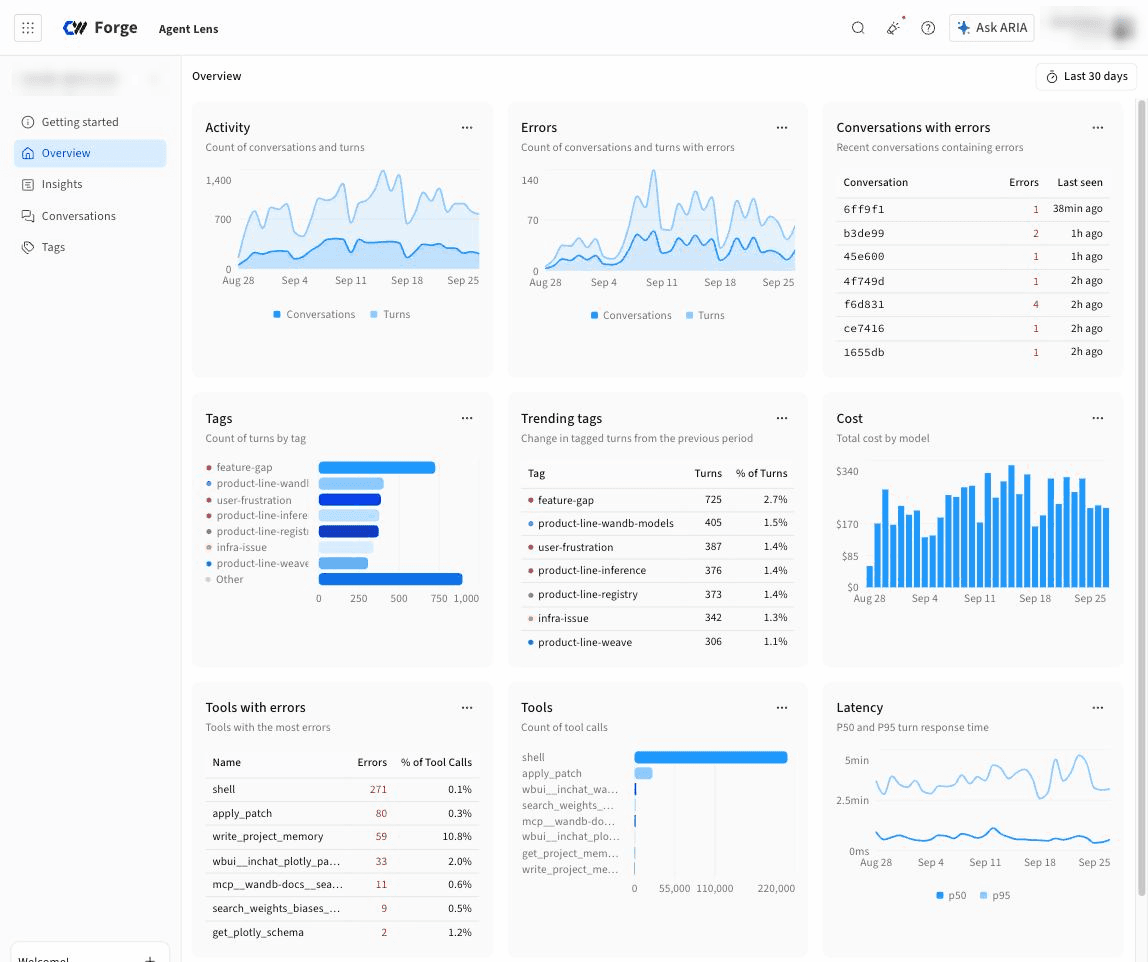
The Overview tab is a dashboard of project-level metrics. Use it to check whether your agent is healthy before you open individual conversations: how much traffic it handled, where errors and tool failures cluster, what it cost, and how its latency is trending.
By default, every pane displays activity for the last 30 days. Select the time range control in the top right to change it.
The dashboard contains the following panes:
- Activity: The total number of conversations and turns per day across the time window. Use this pane to spot traffic spikes, quiet periods, and changes in conversation length.
- Errors: The number of conversations and turns per day that contain at least one span with an error status.
- Conversations with errors: A table of the conversations with the most errors, showing the conversation ID, the error count, and when the conversation was last seen. Select a conversation ID to open it on the Conversations tab and find the failing turn.
- Tags: How often each tag was applied in the time window, as a distribution. The most common tags are listed by name and the rest are grouped as Other. Tags applied by the LLM judge and tags applied by hand are both counted, and a tag that was later removed is not. See Create a custom tag to add tags to your project.
- Trending tags: The tags whose frequency changed the most compared with the previous window of the same length. The table shows each tag, its count in the current window, and the change from the previous one. A tag that rises sharply here is usually a behavior worth selecting to open on the Conversations tab.
- Cost: The total estimated cost of your agent’s LLM calls per day, in US dollars, broken down by model. Agent Lens derives cost from the token usage and model ID recorded on each LLM span, so a span without usage or with an unknown model contributes nothing to this chart.
- Tools with errors: A table of the tools whose calls failed most often, showing the tool name, the number of failed calls, and the failure rate as a percentage of that tool’s calls. High failure rates are highlighted. Select a row to open the Conversations tab filtered to conversations that called that tool.
- Tools: The total number of calls to each tool in the time window, as a ranked bar chart. Use it to see which tools your agent relies on and to notice a tool that has stopped being called.
- Latency: Turn response time per day as p50 and p95 series. The p50 line shows the typical time to complete a turn, and the p95 line shows what your slowest users experience.
- Agents: The number of turns handled by each agent, as a ranked bar chart. Use it to compare traffic across agents that share a project.
- Providers: The number of model calls to each LLM provider, such as
openai.
- Models: The number of model calls to each model. Use it to confirm which models your agent actually calls, including dated model versions.
View agent conversations
To view your agent’s conversations in detail:
- Navigate to CoreWeave Forge and select Agent Lens from the App Launcher.
- In the project selector at the top of the side menu, select your project. Agent Lens opens the project you used most recently by default.
- In the Agent Lens side menu, select Conversations.
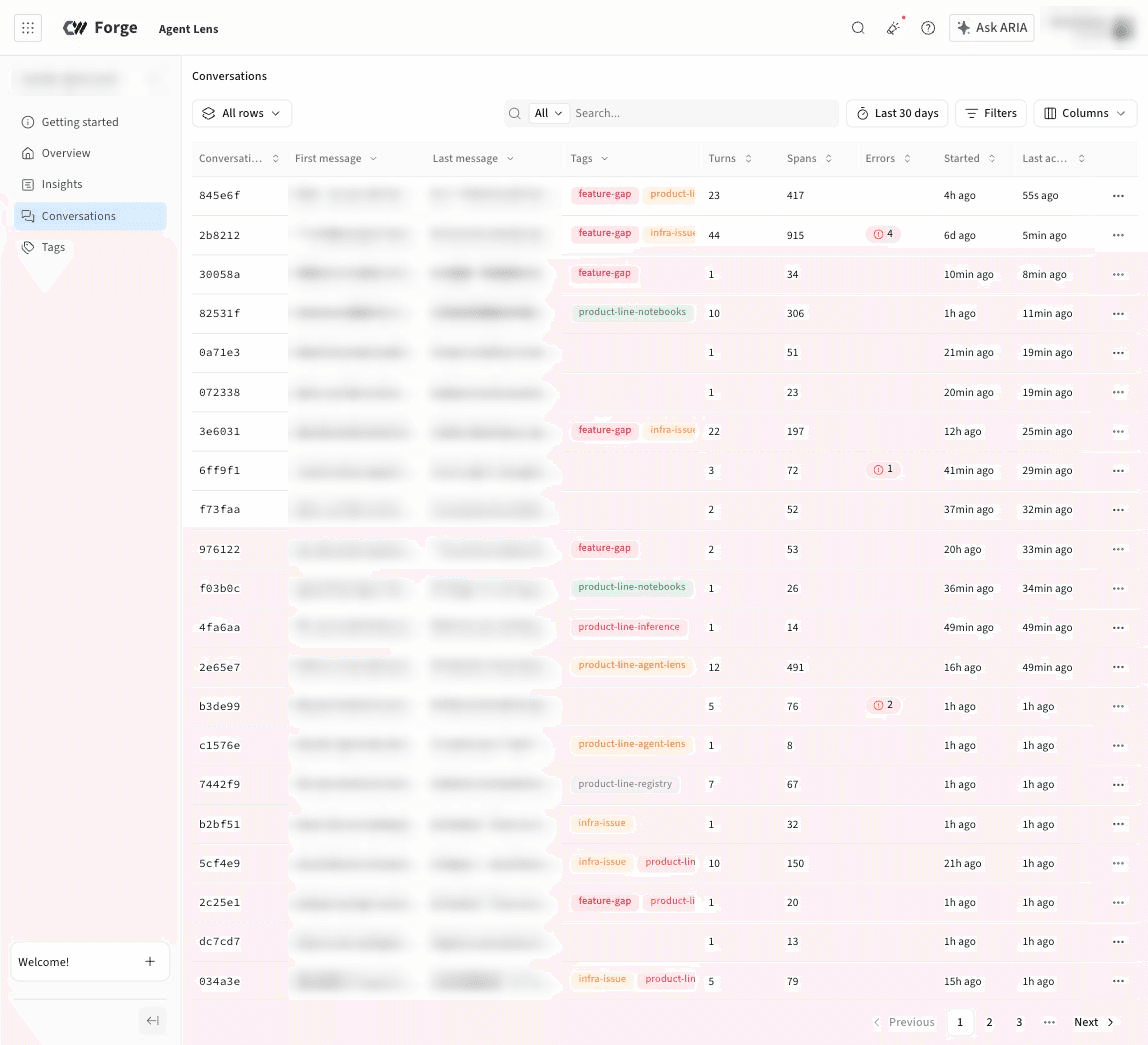
The Conversations tab displays a table of conversations logged to your project over the last 30 days. Select the time range control in the top right to change it.
You can change the columns displayed in the table by selecting Columns and then selecting the columns you want to add or remove, such as the agent’s name (Agent), the model the agent used (Model), and the tools used during a conversation (Tool).
You can filter the list by selecting Filters and setting a field, operator, and value that you want to filter on. To add more conditions, select Add a filter.
To switch to a saved view of the table, select the All rows menu.
View conversation turns, spans, and timelines
You can view detailed information about a conversation by selecting a conversation on the Conversations tab. This opens a drawer that contains three tabs of information about the selected conversation:
- Thread: Displays all of the captured turns during a conversation between the agent and the user, including tool calls and reasoning steps. Additionally, you can manually add reactions, notes, and tags to each turn by selecting their respective icons in the upper-right of each turn.
- Spans: Displays the conversation as a tree of spans, the individual operations your agent performed. The left pane lists the conversation, each turn under it, and the spans within each turn. The conversation and turn rows show a duration and cost, and turns with errors show an error count. Span rows show the operation name, such as
chat gpt-5.6 for a model call or execute_tool shell for a tool call, together with duration and, for model calls, token count and model. Select any row to inspect it in the right pane, which has two sub-tabs:
- Overview: Key details for the selection. For a conversation, this includes the conversation ID, turn count, duration, cost, and last activity. For a span, this includes the span ID, name, duration, start and end times, tool or provider, status, and the span’s input and output.
- Raw: The span’s attributes as JSON, useful for confirming exactly what your instrumentation sent.
- Timeline: Displays each turn as a waterfall chart, with the spans in the turn drawn as horizontal bars against a time axis that starts at the beginning of the turn. Bar position shows when a span started, bar width shows how long it ran, and nested spans appear in rows beneath their parent.
Last modified on September 30, 2026