The CAIOS Usage dashboard shows the performance, resource utilization, and quotas of your CoreWeave AI Object Storage. Use this dashboard to understand how your storage is consumed, spot latency issues in object operations, and confirm you’re operating within allocated quotas.
This dashboard lets you:
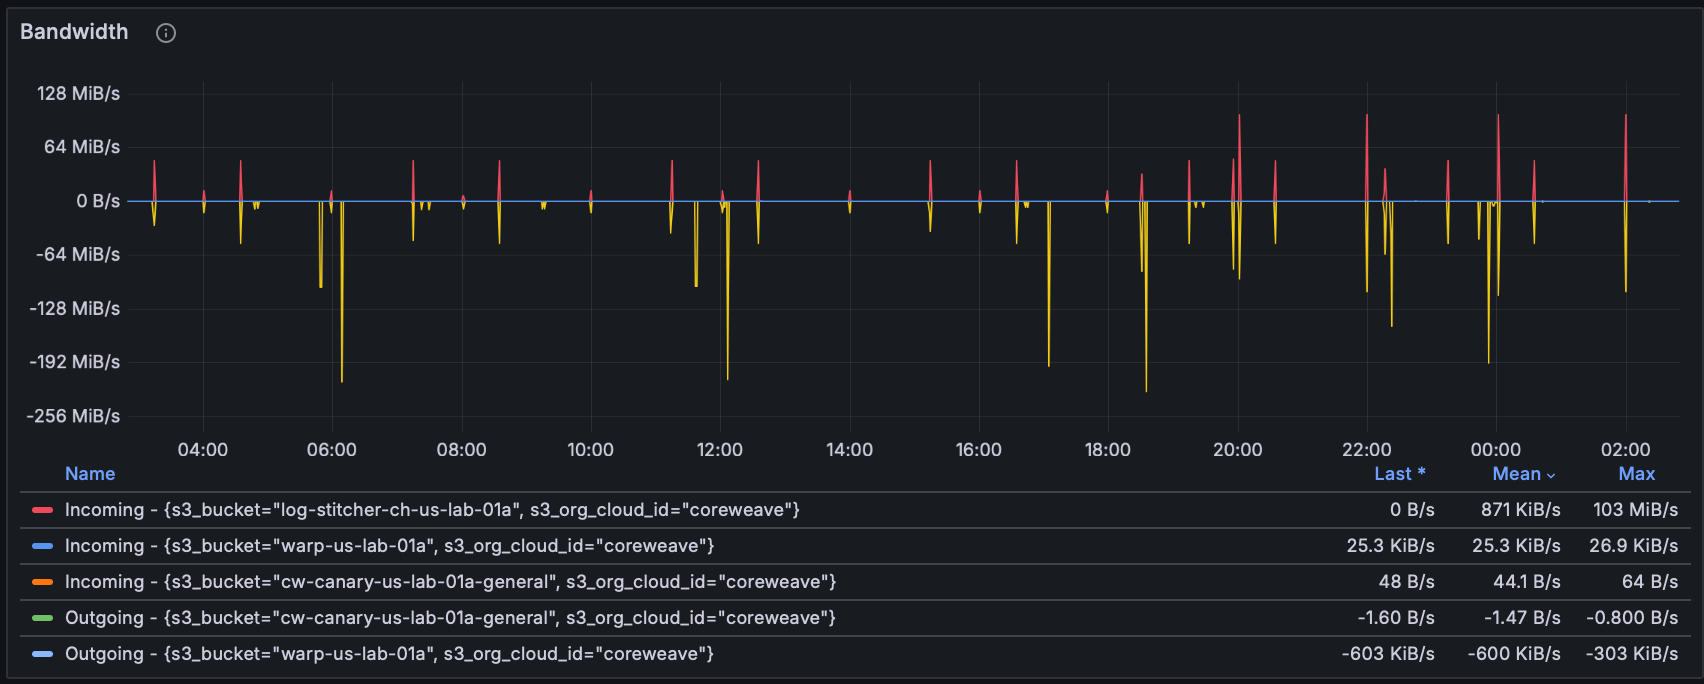
- Monitor request rates and bandwidth usage.
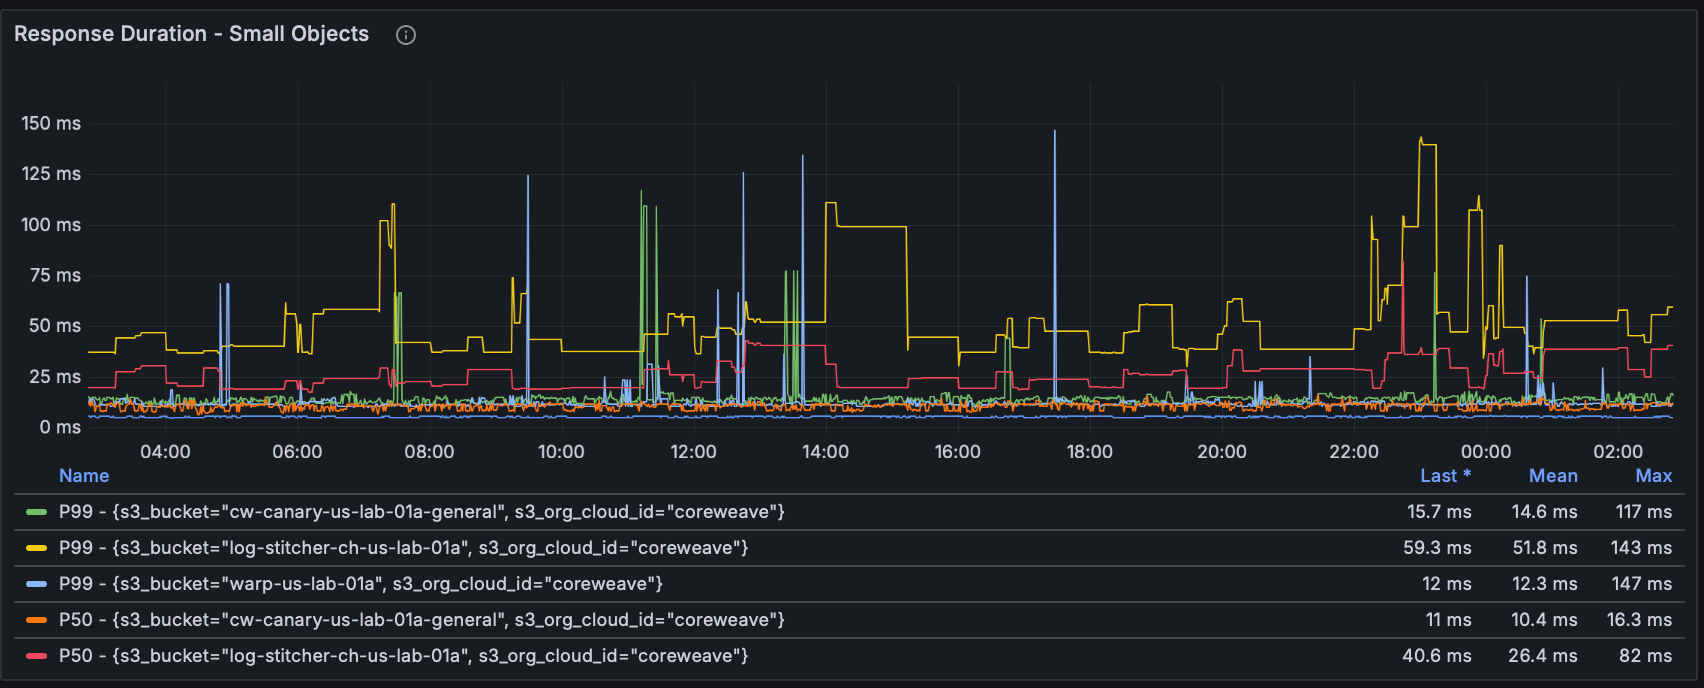
- Track response and request durations for different object sizes.
- Evaluate storage quotas and actual usage.
To view the dashboard, go to the CAIOS Usage dashboard.
Filters and parameters
Use the following filters at the top of the dashboard to customize your data view:
| Field | Description |
|---|
| Data Source | Prometheus data source selector. |
| Zone | Availability zone for data viewing. |
| User | Cloud user or principal accessing the storage. |
| Bucket | Specific storage bucket to monitor. |
| Operation | Type of storage operation (for example, read, write). |
| Response Code | HTTP response code filter. |
| Response Flags | HTTP response flags filter. |
Set the time range and refresh rate parameters at the top-right corner of the dashboard. The default time range is 24 hours.
Panel descriptions
The CAIOS Usage dashboard contains the following panels, grouped into logical sections. The following sections describe the usage metrics, quota metrics, and notes on the UNKNOWN storage class.
Usage metrics
| Panel | Description |
|---|
| Total Requests per Second | Shows the rate of HTTP requests to AI Object Storage. |
| Bandwidth | Visualizes incoming (downloads) and outgoing (uploads) bandwidth. |
| Response Duration - Small Objects | Time between “Time to First Byte” and “Time to Last Byte” for responses up to 100 KiB. |
| Response Duration - Small Reads | Same as the previous row, specifically for read operations up to 100 KiB. |
| Request Duration - Small Objects | Duration from client request initiation to completion for requests up to 100 KiB. |
| Request Duration - Small Reads | Same as the previous row, but for read requests up to 100 KiB. |
The panels related to response and request durations help you monitor latency in data transfers and identify potential bottlenecks or performance issues in object storage operations.
- P50: Median duration, representing typical performance.
- P99: 99th percentile duration, indicating peak latency that 1% of requests experience.
Regular monitoring can help optimize your storage performance and efficiently manage storage quotas and resources.
Quota metrics
The following panels help you track storage consumption against allocated quotas so you can plan capacity and avoid hitting limits.
| Panel | Description |
|---|
| Total stored bytes quota & usage | Tracks storage quota versus actual usage in bytes, broken down by storage class and zone. |
| Bucket count quota & usage | Shows the number of buckets used versus quota allocated. |
| Stored bytes usage per bucket | Displays total stored bytes for each bucket, categorized by storage class and zone. |
UNKNOWN storage class
You may occasionally see an UNKNOWN storage class on the CAIOS Usage dashboard or in custom Grafana queries. This indicates versioned objects contain “deleted” versions. In other words, delete markers haven’t been permanently removed from the objects. These markers are reported, but don’t have a storage class associated with them. Last modified on June 10, 2026