これはインタラクティブなノートブックです。ローカルで実行するか、以下のリンクを使用してください。
strict: true を指定すると、応答が指定したスキーマに必ず準拠するようになります。
マルチエージェントシステムで構造化出力を使用すると、エージェント間で受け渡されるデータの一貫性が保たれ、予測どおりに処理できるようになります。また、明示的な拒否にも対応しているため、再試行や応答の検証が不要になります。
ソース: このクックブックは OpenAI の構造化出力のサンプルコードをベースに、Weave での可視化を改善するための変更を加えたものです。
依存関係をインストールする
まず、このチュートリアルで必要なライブラリをインストールします。このチュートリアルでは、次のライブラリを使用します。!pip install -qU openai weave wandb
python
%%capture
# openai のバグに対する一時的な回避策:
# TypeError: Client.__init__() got an unexpected keyword argument 'proxies'
# 詳細: https://community.openai.com/t/error-with-openai-1-56-0-client-init-got-an-unexpected-keyword-argument-proxies/1040332/15
!pip install "httpx<0.28"
wandb.login() でログインできるよう、環境変数 WANDB_API_KEY を設定します。この値はシークレットとして Colab に登録してください。
ログ先の Weights & Biases の project を name_of_wandb_project に指定します。
name_of_wandb_project は [YOUR-TEAM]/[YOUR-PROJECT] の形式でも指定でき、トレースのログ先となるチームを指定できます。weave.init() を呼び出して Weave クライアントを取得します。
このチュートリアルでは OpenAI API を使用するため、OpenAI APIキーも必要です。OpenAI プラットフォームでサインアップして、APIキーを取得してください。このキーもシークレットとして Colab に登録してください。
import base64
import json
import os
from io import BytesIO, StringIO

import matplotlib.pyplot as plt
import numpy as np
import pandas as pd
import wandb
from google.colab import userdata
from openai import OpenAI

import weave
python
os.environ["WANDB_API_KEY"] = userdata.get("WANDB_API_KEY")
os.environ["OPENAI_API_KEY"] = userdata.get("OPENAI_API_KEY")

wandb.login()
name_of_wandb_project = "multi-agent-structured-output"
weave.init(name_of_wandb_project)

client = OpenAI()
MODEL = "gpt-4o-2024-08-06"
エージェントを設定する
Weave を初期化したら、システムを構成するエージェントを定義します。このチュートリアルでは、データ分析タスクをユースケースとして取り上げます。 まず、4 つのエージェントで構成されるシステムを設定します。- トリアージエージェント: どのエージェントを呼び出すかを判断します。
- データ前処理エージェント: データのクリーンアップなどを行い、分析できる状態にデータを整えます。
- データ分析エージェント: データを分析します。
- データ可視化エージェント: 分析結果を可視化し、インサイトを引き出します。
triaging_system_prompt = """You are a Triaging Agent. Your role is to assess the user's query and route it to the relevant agents. The agents available are:
- Data Processing Agent: Cleans, transforms, and aggregates data.
- Analysis Agent: Performs statistical, correlation, and regression analysis.
- Visualization Agent: Creates bar charts, line charts, and pie charts.

Use the send_query_to_agents tool to forward the user's query to the relevant agents. Also, use the speak_to_user tool to get more information from the user if needed."""

processing_system_prompt = """You are a Data Processing Agent. Your role is to clean, transform, and aggregate data using the following tools:
- clean_data
- transform_data
- aggregate_data"""

analysis_system_prompt = """You are an Analysis Agent. Your role is to perform statistical, correlation, and regression analysis using the following tools:
- stat_analysis
- correlation_analysis
- regression_analysis"""

visualization_system_prompt = """You are a Visualization Agent. Your role is to create bar charts, line charts, and pie charts using the following tools:
- create_bar_chart
- create_line_chart
- create_pie_chart"""
triage_tools = [
    {
        "type": "function",
        "function": {
            "name": "send_query_to_agents",
            "description": "Sends the user query to relevant agents based on their capabilities.",
            "parameters": {
                "type": "object",
                "properties": {
                    "agents": {
                        "type": "array",
                        "items": {"type": "string"},
                        "description": "An array of agent names to send the query to.",
                    },
                    "query": {
                        "type": "string",
                        "description": "The user query to send.",
                    },
                },
                "required": ["agents", "query"],
            },
        },
        "strict": True,
    }
]

preprocess_tools = [
    {
        "type": "function",
        "function": {
            "name": "clean_data",
            "description": "Cleans the provided data by removing duplicates and handling missing values.",
            "parameters": {
                "type": "object",
                "properties": {
                    "data": {
                        "type": "string",
                        "description": "The dataset to clean. Should be in a suitable format such as JSON or CSV.",
                    }
                },
                "required": ["data"],
                "additionalProperties": False,
            },
        },
        "strict": True,
    },
    {
        "type": "function",
        "function": {
            "name": "transform_data",
            "description": "Transforms data based on specified rules.",
            "parameters": {
                "type": "object",
                "properties": {
                    "data": {
                        "type": "string",
                        "description": "The data to transform. Should be in a suitable format such as JSON or CSV.",
                    },
                    "rules": {
                        "type": "string",
                        "description": "Transformation rules to apply, specified in a structured format.",
                    },
                },
                "required": ["data", "rules"],
                "additionalProperties": False,
            },
        },
        "strict": True,
    },
    {
        "type": "function",
        "function": {
            "name": "aggregate_data",
            "description": "Aggregates data by specified columns and operations.",
            "parameters": {
                "type": "object",
                "properties": {
                    "data": {
                        "type": "string",
                        "description": "The data to aggregate. Should be in a suitable format such as JSON or CSV.",
                    },
                    "group_by": {
                        "type": "array",
                        "items": {"type": "string"},
                        "description": "Columns to group by.",
                    },
                    "operations": {
                        "type": "string",
                        "description": "Aggregation operations to perform, specified in a structured format.",
                    },
                },
                "required": ["data", "group_by", "operations"],
                "additionalProperties": False,
            },
        },
        "strict": True,
    },
]

analysis_tools = [
    {
        "type": "function",
        "function": {
            "name": "stat_analysis",
            "description": "Performs statistical analysis on the given dataset.",
            "parameters": {
                "type": "object",
                "properties": {
                    "data": {
                        "type": "string",
                        "description": "The dataset to analyze. Should be in a suitable format such as JSON or CSV.",
                    }
                },
                "required": ["data"],
                "additionalProperties": False,
            },
        },
        "strict": True,
    },
    {
        "type": "function",
        "function": {
            "name": "correlation_analysis",
            "description": "Calculates correlation coefficients between variables in the dataset.",
            "parameters": {
                "type": "object",
                "properties": {
                    "data": {
                        "type": "string",
                        "description": "The dataset to analyze. Should be in a suitable format such as JSON or CSV.",
                    },
                    "variables": {
                        "type": "array",
                        "items": {"type": "string"},
                        "description": "List of variables to calculate correlations for.",
                    },
                },
                "required": ["data", "variables"],
                "additionalProperties": False,
            },
        },
        "strict": True,
    },
    {
        "type": "function",
        "function": {
            "name": "regression_analysis",
            "description": "Performs regression analysis on the dataset.",
            "parameters": {
                "type": "object",
                "properties": {
                    "data": {
                        "type": "string",
                        "description": "The dataset to analyze. Should be in a suitable format such as JSON or CSV.",
                    },
                    "dependent_var": {
                        "type": "string",
                        "description": "The dependent variable for regression.",
                    },
                    "independent_vars": {
                        "type": "array",
                        "items": {"type": "string"},
                        "description": "List of independent variables.",
                    },
                },
                "required": ["data", "dependent_var", "independent_vars"],
                "additionalProperties": False,
            },
        },
        "strict": True,
    },
]

visualization_tools = [
    {
        "type": "function",
        "function": {
            "name": "create_bar_chart",
            "description": "Creates a bar chart from the provided data.",
            "parameters": {
                "type": "object",
                "properties": {
                    "data": {
                        "type": "string",
                        "description": "The data for the bar chart. Should be in a suitable format such as JSON or CSV.",
                    },
                    "x": {"type": "string", "description": "Column for the x-axis."},
                    "y": {"type": "string", "description": "Column for the y-axis."},
                },
                "required": ["data", "x", "y"],
                "additionalProperties": False,
            },
        },
        "strict": True,
    },
    {
        "type": "function",
        "function": {
            "name": "create_line_chart",
            "description": "Creates a line chart from the provided data.",
            "parameters": {
                "type": "object",
                "properties": {
                    "data": {
                        "type": "string",
                        "description": "The data for the line chart. Should be in a suitable format such as JSON or CSV.",
                    },
                    "x": {"type": "string", "description": "Column for the x-axis."},
                    "y": {"type": "string", "description": "Column for the y-axis."},
                },
                "required": ["data", "x", "y"],
                "additionalProperties": False,
            },
        },
        "strict": True,
    },
    {
        "type": "function",
        "function": {
            "name": "create_pie_chart",
            "description": "Creates a pie chart from the provided data.",
            "parameters": {
                "type": "object",
                "properties": {
                    "data": {
                        "type": "string",
                        "description": "The data for the pie chart. Should be in a suitable format such as JSON or CSV.",
                    },
                    "labels": {
                        "type": "string",
                        "description": "Column for the labels.",
                    },
                    "values": {
                        "type": "string",
                        "description": "Column for the values.",
                    },
                },
                "required": ["data", "labels", "values"],
                "additionalProperties": False,
            },
        },
        "strict": True,
    },
]
Weave でマルチエージェントのトラッキングを有効にする
エージェントとそのツールを定義したら、次はそれらを連携させ、Weave のトレースを有効にします。次の処理を行うコードロジックを記述します。- ユーザーのクエリをマルチエージェントシステムに渡す。
- マルチエージェントシステム内部の処理を行う。
- ツール呼び出しを実行する。
# クエリの例

user_query = """
Below is some data. I want you to first remove the duplicates then analyze the statistics of the data as well as plot a line chart.

house_size (m3), house_price ($)
90, 100
80, 90
100, 120
90, 100
"""
clean_data、start_analysis、use_line_chart であると判断できます。
まず、ツール呼び出しを実行する関数を定義します。
Python の関数を @weave.op() でデコレートすると、言語モデルの入力、出力、トレースをログしてデバッグできます。
マルチエージェントシステムには多数の関数が含まれますが、各関数の先頭に @weave.op() を付けるだけで十分です。
@weave.op()
def clean_data(data):
    data_io = StringIO(data)
    df = pd.read_csv(data_io, sep=",")
    df_deduplicated = df.drop_duplicates()
    return df_deduplicated

@weave.op()
def stat_analysis(data):
    data_io = StringIO(data)
    df = pd.read_csv(data_io, sep=",")
    return df.describe()

@weave.op()
def plot_line_chart(data):
    data_io = StringIO(data)
    df = pd.read_csv(data_io, sep=",")

    x = df.iloc[:, 0]
    y = df.iloc[:, 1]

    coefficients = np.polyfit(x, y, 1)
    polynomial = np.poly1d(coefficients)
    y_fit = polynomial(x)

    plt.figure(figsize=(10, 6))
    plt.plot(x, y, "o", label="Data Points")
    plt.plot(x, y_fit, "-", label="Best Fit Line")
    plt.title("Line Chart with Best Fit Line")
    plt.xlabel(df.columns[0])
    plt.ylabel(df.columns[1])
    plt.legend()
    plt.grid(True)

    # 表示する前にプロットを BytesIO バッファに保存します
    buf = BytesIO()
    plt.savefig(buf, format="png")
    buf.seek(0)

    # プロットを表示します
    plt.show()

    # データ URL 用に画像を base64 でエンコードします
    image_data = buf.getvalue()
    base64_encoded_data = base64.b64encode(image_data)
    base64_string = base64_encoded_data.decode("utf-8")
    data_url = f"data:image/png;base64,{base64_string}"

    return data_url

# ツールを実行する関数を定義します
@weave.op()
def execute_tool(tool_calls, messages):
    for tool_call in tool_calls:
        tool_name = tool_call.function.name
        tool_arguments = json.loads(tool_call.function.arguments)

        if tool_name == "clean_data":
            # データクレンジングをシミュレートします
            cleaned_df = clean_data(tool_arguments["data"])
            cleaned_data = {"cleaned_data": cleaned_df.to_dict()}
            messages.append(
                {"role": "tool", "name": tool_name, "content": json.dumps(cleaned_data)}
            )
            print("Cleaned data: ", cleaned_df)
        elif tool_name == "transform_data":
            # データ変換をシミュレートします
            transformed_data = {"transformed_data": "sample_transformed_data"}
            messages.append(
                {
                    "role": "tool",
                    "name": tool_name,
                    "content": json.dumps(transformed_data),
                }
            )
        elif tool_name == "aggregate_data":
            # データ集約をシミュレートします
            aggregated_data = {"aggregated_data": "sample_aggregated_data"}
            messages.append(
                {
                    "role": "tool",
                    "name": tool_name,
                    "content": json.dumps(aggregated_data),
                }
            )
        elif tool_name == "stat_analysis":
            # 統計分析をシミュレートします
            stats_df = stat_analysis(tool_arguments["data"])
            stats = {"stats": stats_df.to_dict()}
            messages.append(
                {"role": "tool", "name": tool_name, "content": json.dumps(stats)}
            )
            print("Statistical Analysis: ", stats_df)
        elif tool_name == "correlation_analysis":
            # 相関分析をシミュレートします
            correlations = {"correlations": "sample_correlations"}
            messages.append(
                {"role": "tool", "name": tool_name, "content": json.dumps(correlations)}
            )
        elif tool_name == "regression_analysis":
            # 回帰分析をシミュレートします
            regression_results = {"regression_results": "sample_regression_results"}
            messages.append(
                {
                    "role": "tool",
                    "name": tool_name,
                    "content": json.dumps(regression_results),
                }
            )
        elif tool_name == "create_bar_chart":
            # 棒グラフの作成をシミュレートします
            bar_chart = {"bar_chart": "sample_bar_chart"}
            messages.append(
                {"role": "tool", "name": tool_name, "content": json.dumps(bar_chart)}
            )
        elif tool_name == "create_line_chart":
            # 折れ線グラフの作成をシミュレートします
            line_chart = {"line_chart": plot_line_chart(tool_arguments["data"])}
            messages.append(
                {"role": "tool", "name": tool_name, "content": json.dumps(line_chart)}
            )
        elif tool_name == "create_pie_chart":
            # 円グラフの作成をシミュレートします
            pie_chart = {"pie_chart": "sample_pie_chart"}
            messages.append(
                {"role": "tool", "name": tool_name, "content": json.dumps(pie_chart)}
            )
    return messages
# 各エージェントの処理を担う関数を定義する
@weave.op()
def handle_data_processing_agent(query, conversation_messages):
    messages = [{"role": "system", "content": processing_system_prompt}]
    messages.append({"role": "user", "content": query})

    response = client.chat.completions.create(
        model=MODEL,
        messages=messages,
        temperature=0,
        tools=preprocess_tools,
    )

    conversation_messages.append(
        [tool_call.function for tool_call in response.choices[0].message.tool_calls]
    )
    execute_tool(response.choices[0].message.tool_calls, conversation_messages)

@weave.op()
def handle_analysis_agent(query, conversation_messages):
    messages = [{"role": "system", "content": analysis_system_prompt}]
    messages.append({"role": "user", "content": query})

    response = client.chat.completions.create(
        model=MODEL,
        messages=messages,
        temperature=0,
        tools=analysis_tools,
    )

    conversation_messages.append(
        [tool_call.function for tool_call in response.choices[0].message.tool_calls]
    )
    execute_tool(response.choices[0].message.tool_calls, conversation_messages)

@weave.op()
def handle_visualization_agent(query, conversation_messages):
    messages = [{"role": "system", "content": visualization_system_prompt}]
    messages.append({"role": "user", "content": query})

    response = client.chat.completions.create(
        model=MODEL,
        messages=messages,
        temperature=0,
        tools=visualization_tools,
    )

    conversation_messages.append(
        [tool_call.function for tool_call in response.choices[0].message.tool_calls]
    )
    execute_tool(response.choices[0].message.tool_calls, conversation_messages)
# ユーザー入力の処理とトリアージを行う関数
@weave.op()
def handle_user_message(user_query, conversation_messages=None):
    if conversation_messages is None:
        conversation_messages = []
    user_message = {"role": "user", "content": user_query}
    conversation_messages.append(user_message)

    messages = [{"role": "system", "content": triaging_system_prompt}]
    messages.extend(conversation_messages)

    response = client.chat.completions.create(
        model=MODEL,
        messages=messages,
        temperature=0,
        tools=triage_tools,
    )

    conversation_messages.append(
        [tool_call.function for tool_call in response.choices[0].message.tool_calls]
    )

    for tool_call in response.choices[0].message.tool_calls:
        if tool_call.function.name == "send_query_to_agents":
            agents = json.loads(tool_call.function.arguments)["agents"]
            query = json.loads(tool_call.function.arguments)["query"]
            for agent in agents:
                if agent == "Data Processing Agent":
                    handle_data_processing_agent(query, conversation_messages)
                elif agent == "Analysis Agent":
                    handle_analysis_agent(query, conversation_messages)
                elif agent == "Visualization Agent":
                    handle_visualization_agent(query, conversation_messages)

    outputs = extract_tool_contents(conversation_messages)

    return outputs

functions = [
    "clean_data",
    "transform_data",
    "stat_analysis",
    "aggregate_data",
    "correlation_analysis",
    "regression_analysis",
    "create_bar_chart",
    "create_line_chart",
    "create_pie_chart",
]

@weave.op()
def extract_tool_contents(data):
    contents = {}
    contents["all"] = data
    for element in data:
        if (
            isinstance(element, dict)
            and element.get("role") == "tool"
            and element.get("name") in functions
        ):
            name = element["name"]
            content_str = element["content"]
            try:
                content_json = json.loads(content_str)
                if "chart" not in element.get("name"):
                    contents[name] = [content_json]
                else:
                    first_key = next(iter(content_json))
                    second_level = content_json[first_key]
                    if isinstance(second_level, dict):
                        second_key = next(iter(second_level))
                        contents[name] = second_level[second_key]
                    else:
                        contents[name] = second_level
            except json.JSONDecodeError:
                print(f"Error decoding JSON for {name}")
                contents[name] = None

    return contents
マルチエージェントシステムを実行して Weave で可視化する
エージェント、ツール、ハンドラがすべてそろったので、システムを実行する準備が整いました。最後に、ユーザーの入力を使用してメインのhandle_user_message 関数を実行し、結果を確認します。
handle_user_message(user_query)
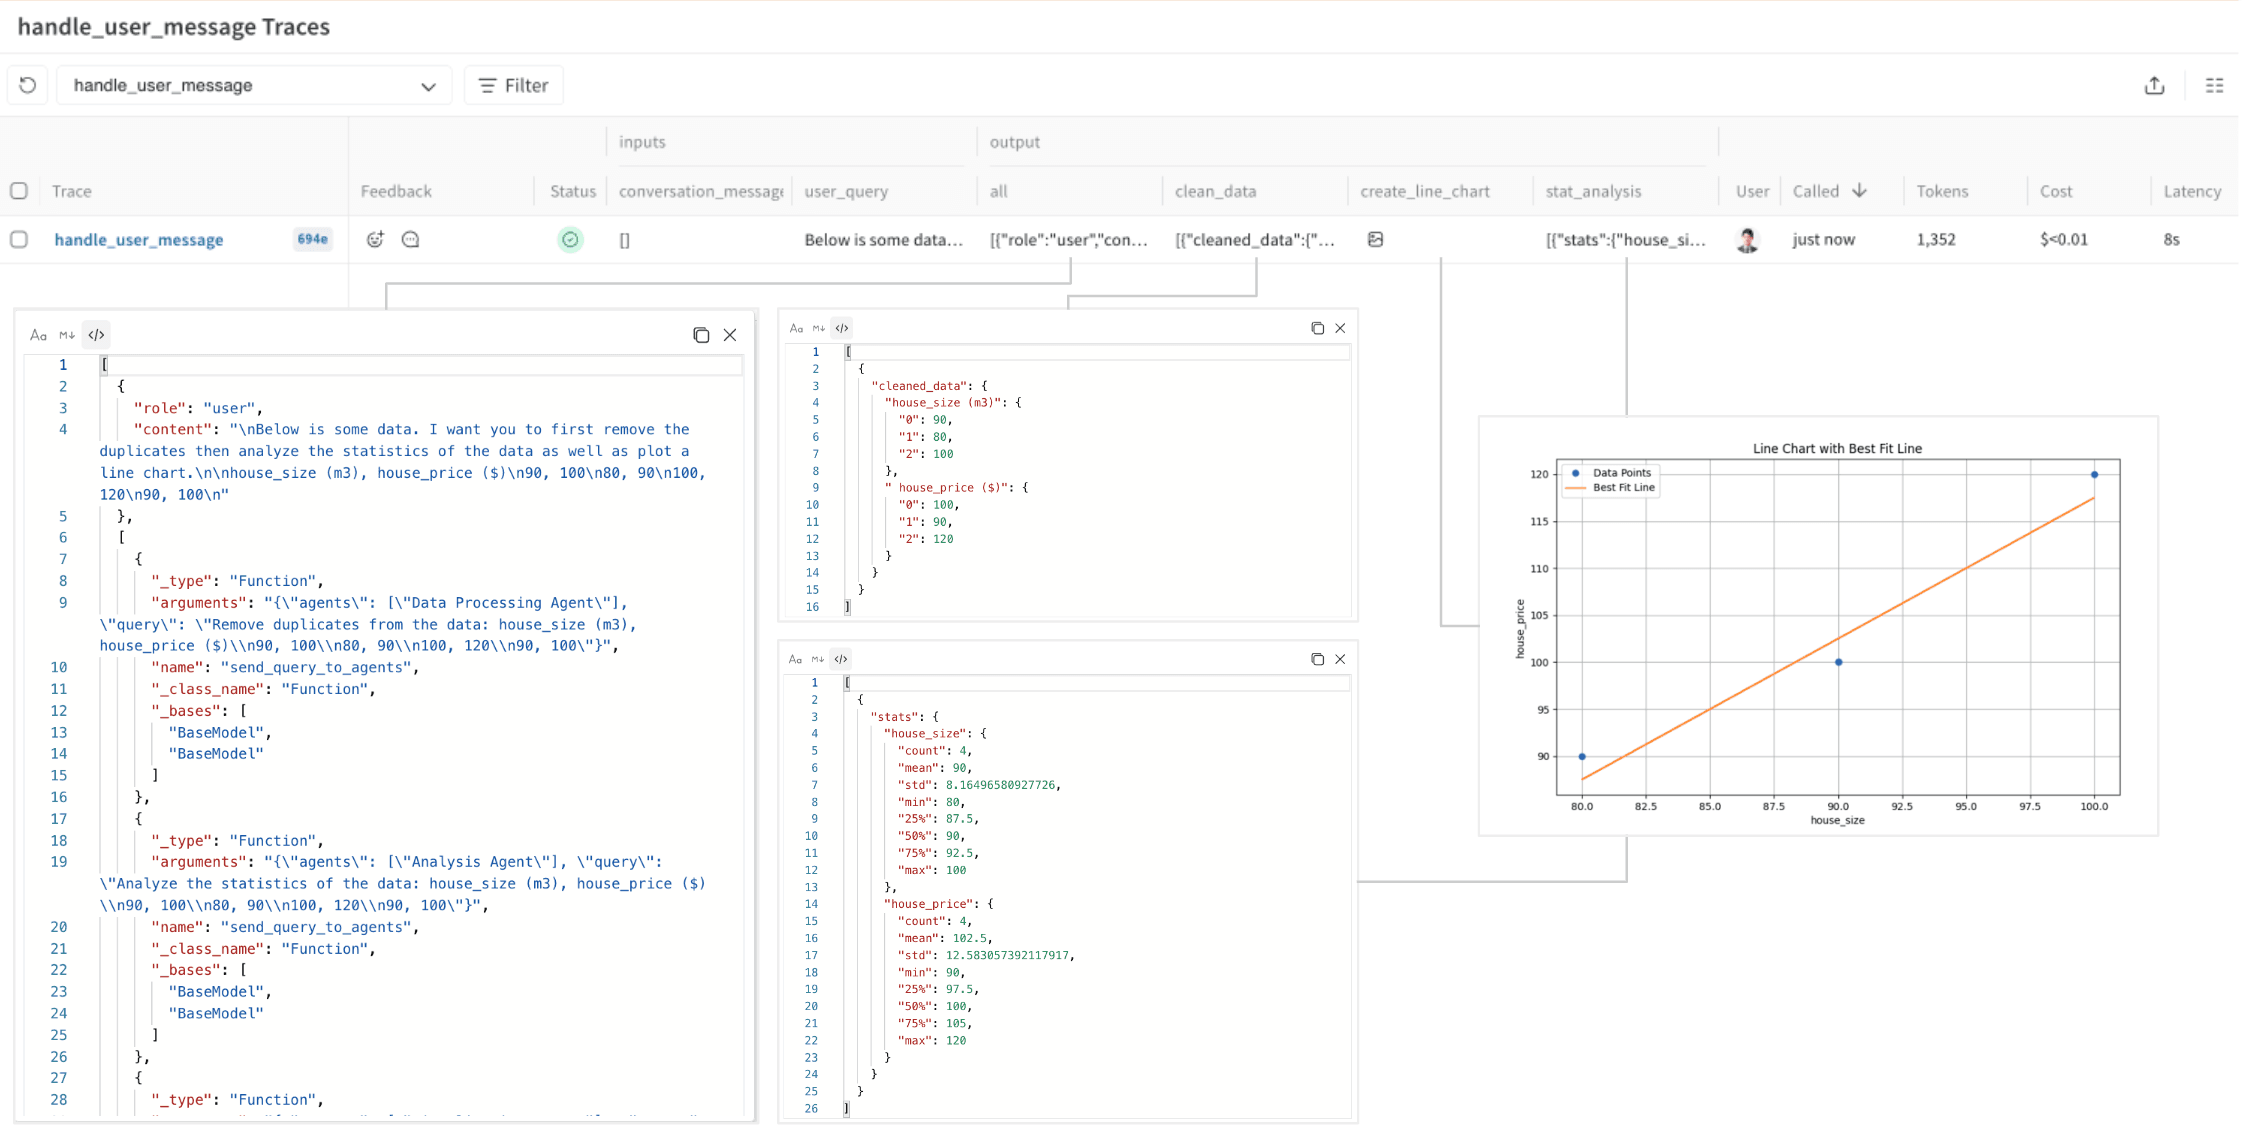
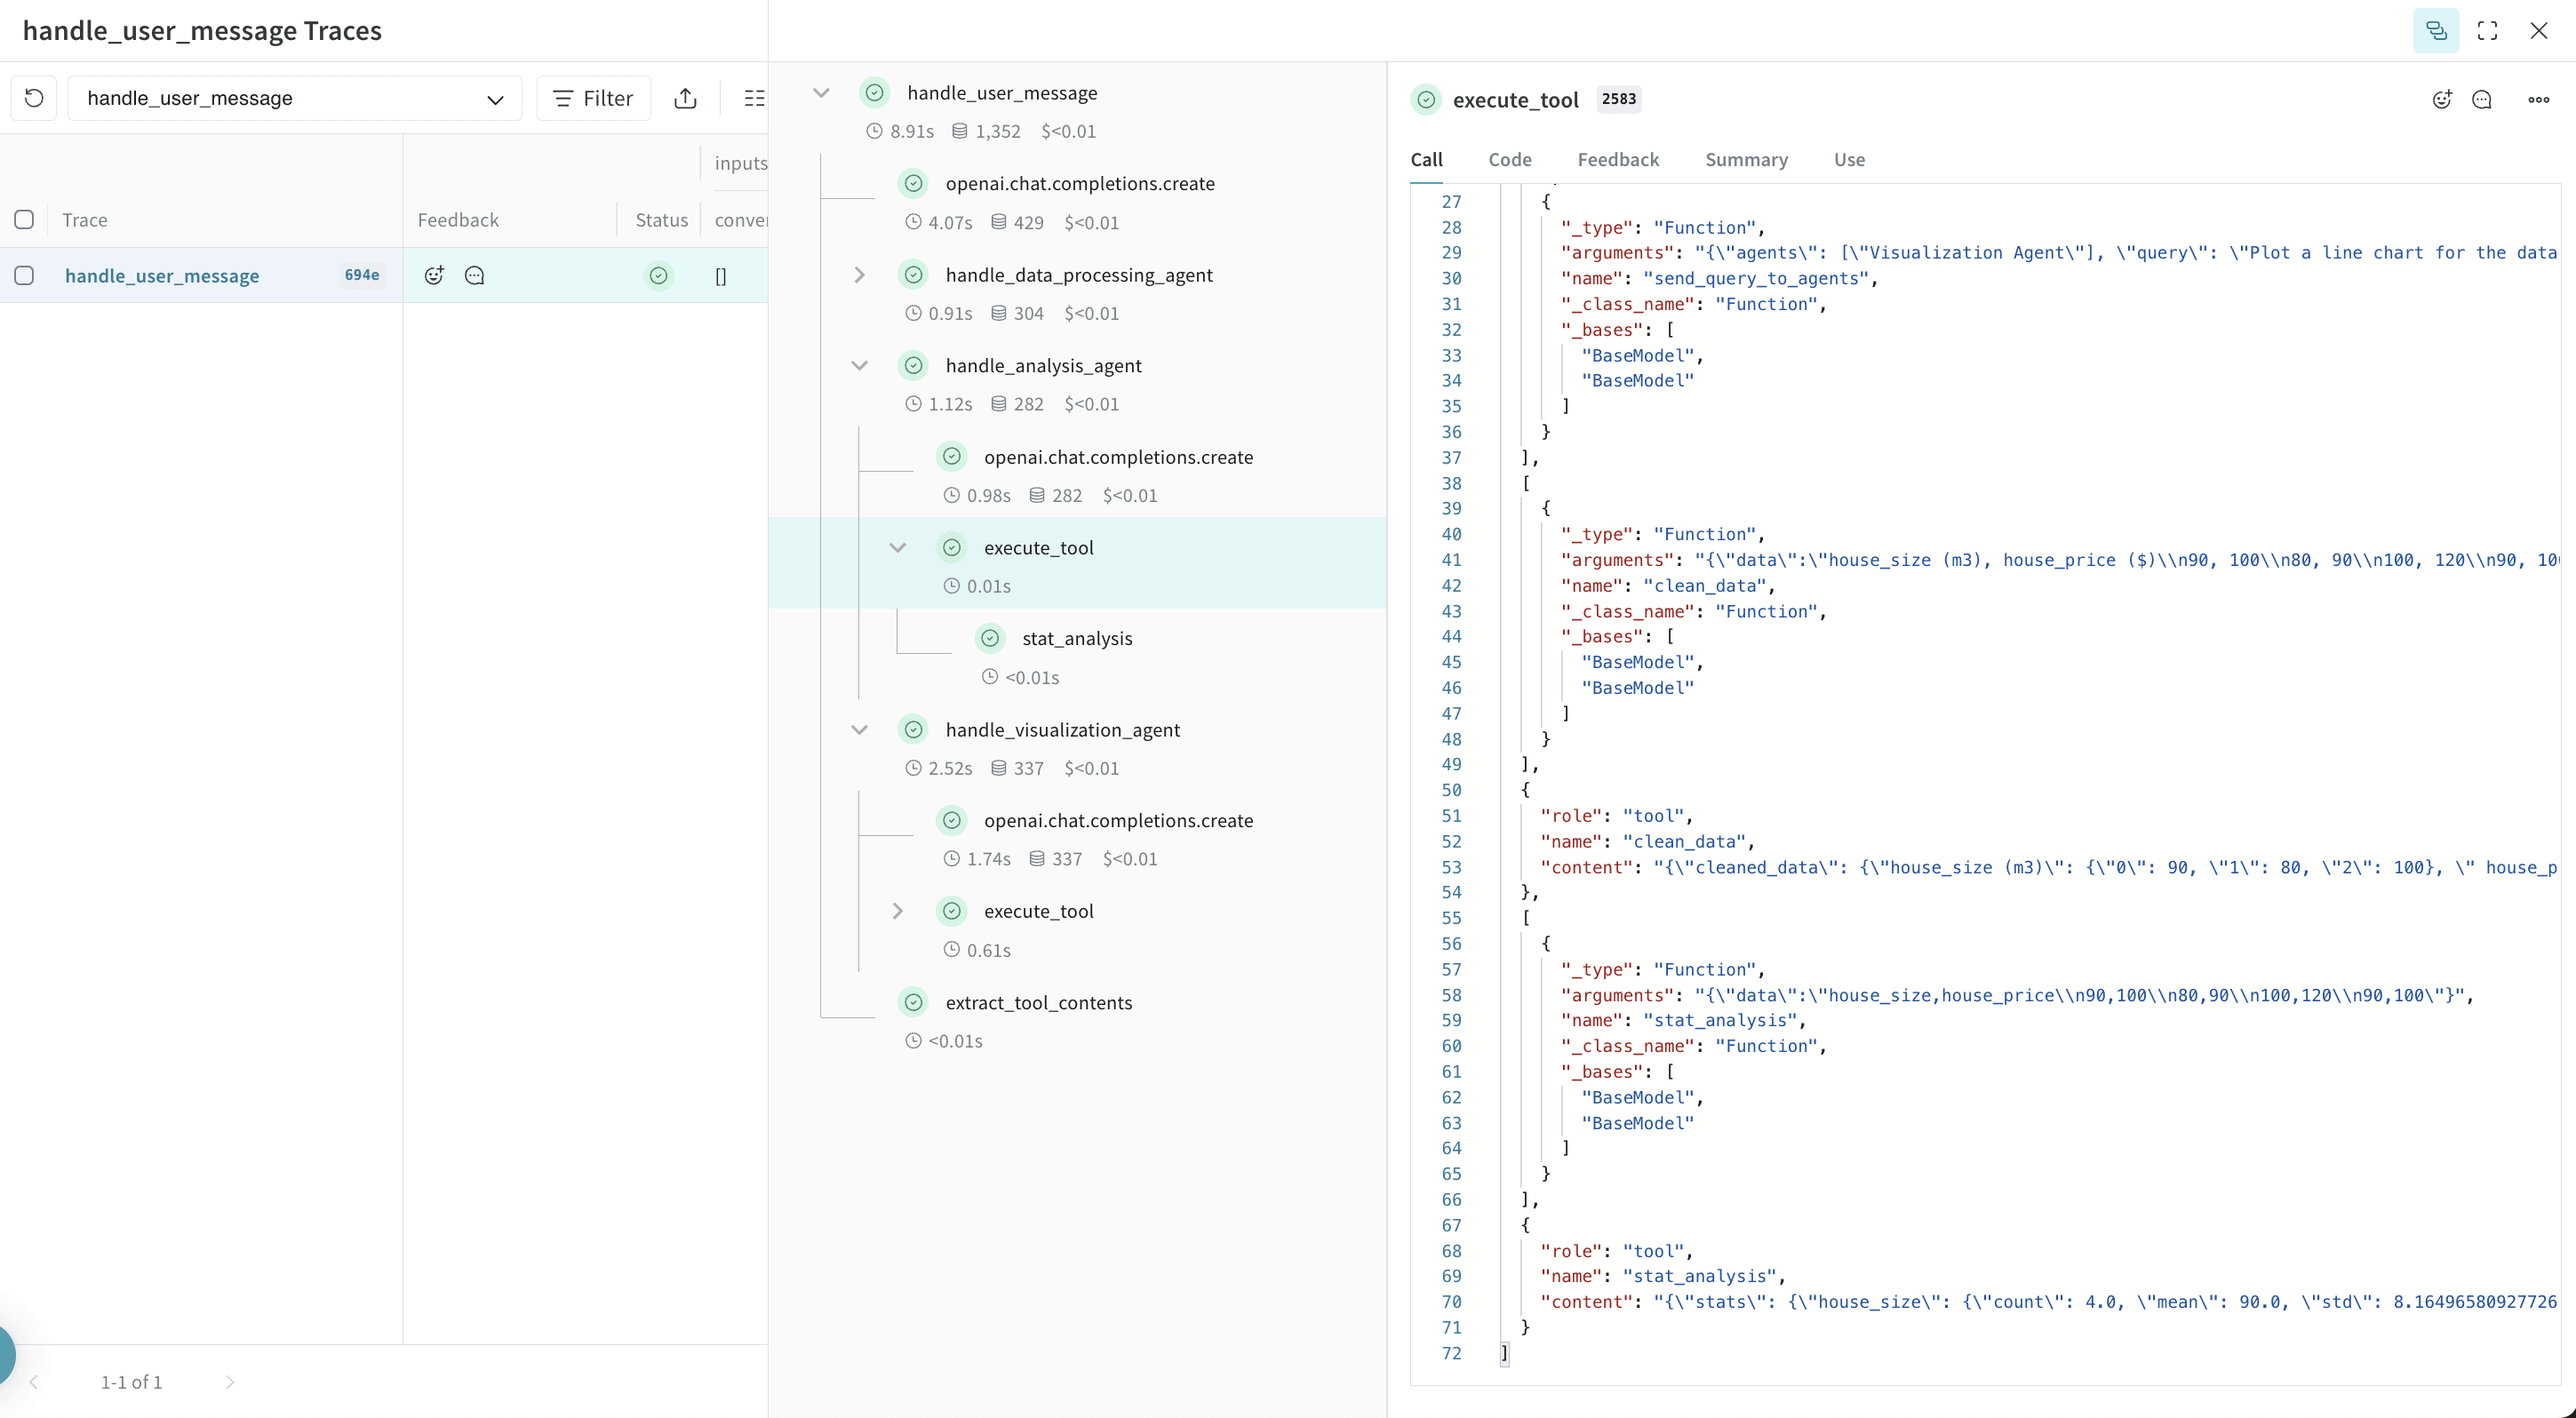
analysis_agent の入力と出力は構造化された形式で表示されます。OpenAI の 構造化出力 はエージェント同士の連携に役立ちますが、システムが複雑になるほど、やり取りの形式を把握するのは難しくなります。Weave を使用すると、こうした中間プロセスとその入出力を詳しく調べることができます。