> ## Documentation Index
> Fetch the complete documentation index at: https://docs.coreweave.com/llms.txt
> Use this file to discover all available pages before exploring further.
> Import CSV files into Weights & Biases as Tables and Artifacts to visualize, compare, and analyze data in dashboards.
# Track CSV files with experiments
Use the W\&B Python Library to log a CSV file and visualize it in a [W\&B Dashboard](/products/wandb/track/workspaces). W\&B Dashboard are the central place to organize and visualize results from your machine learning models. This is particularly useful if you have a [CSV file that contains information of previous machine learning experiments](#import-and-log-your-csv-of-experiments) that are not logged in Weights & Biases or if you have [CSV file that contains a dataset](#import-and-log-your-dataset-csv-file).
## Import and log your dataset CSV file
We suggest you use W\&B Artifacts to make the contents of the CSV file easier to re-use.
1. To get started, first import your CSV file. In the following code snippet, replace the `iris.csv` filename with the name of your CSV filename:
```python theme={"system"}
import wandb
import pandas as pd
# Read our CSV into a new DataFrame
new_iris_dataframe = pd.read_csv("iris.csv")
```
2. Convert the CSV file to a W\&B Table to utilize [W\&B Dashboards](/products/wandb/track/workspaces).
```python theme={"system"}
# Convert the DataFrame into a W&B Table
iris_table = wandb.Table(dataframe=new_iris_dataframe)
```
3. Next, create a W\&B Artifact and add the table to the Artifact:
```python theme={"system"}
# Add the table to an Artifact to increase the row
# limit to 200000 and make it easier to reuse
iris_table_artifact = wandb.Artifact("iris_artifact", type="dataset")
iris_table_artifact.add(iris_table, "iris_table")
# Log the raw csv file within an artifact to preserve our data
iris_table_artifact.add_file("iris.csv")
```
For more information about W\&B Artifacts, see the [Artifacts chapter](/products/wandb/artifacts).
4. Lastly, start a new W\&B Run to track and log to Weights & Biases with `wandb.init()`:
```python theme={"system"}
# Start a W&B run to log data
with wandb.init(project="tables-walkthrough") as run:
# Log the table to visualize with a run...
run.log({"iris": iris_table})
# and Log as an Artifact to increase the available row limit!
run.log_artifact(iris_table_artifact)
```
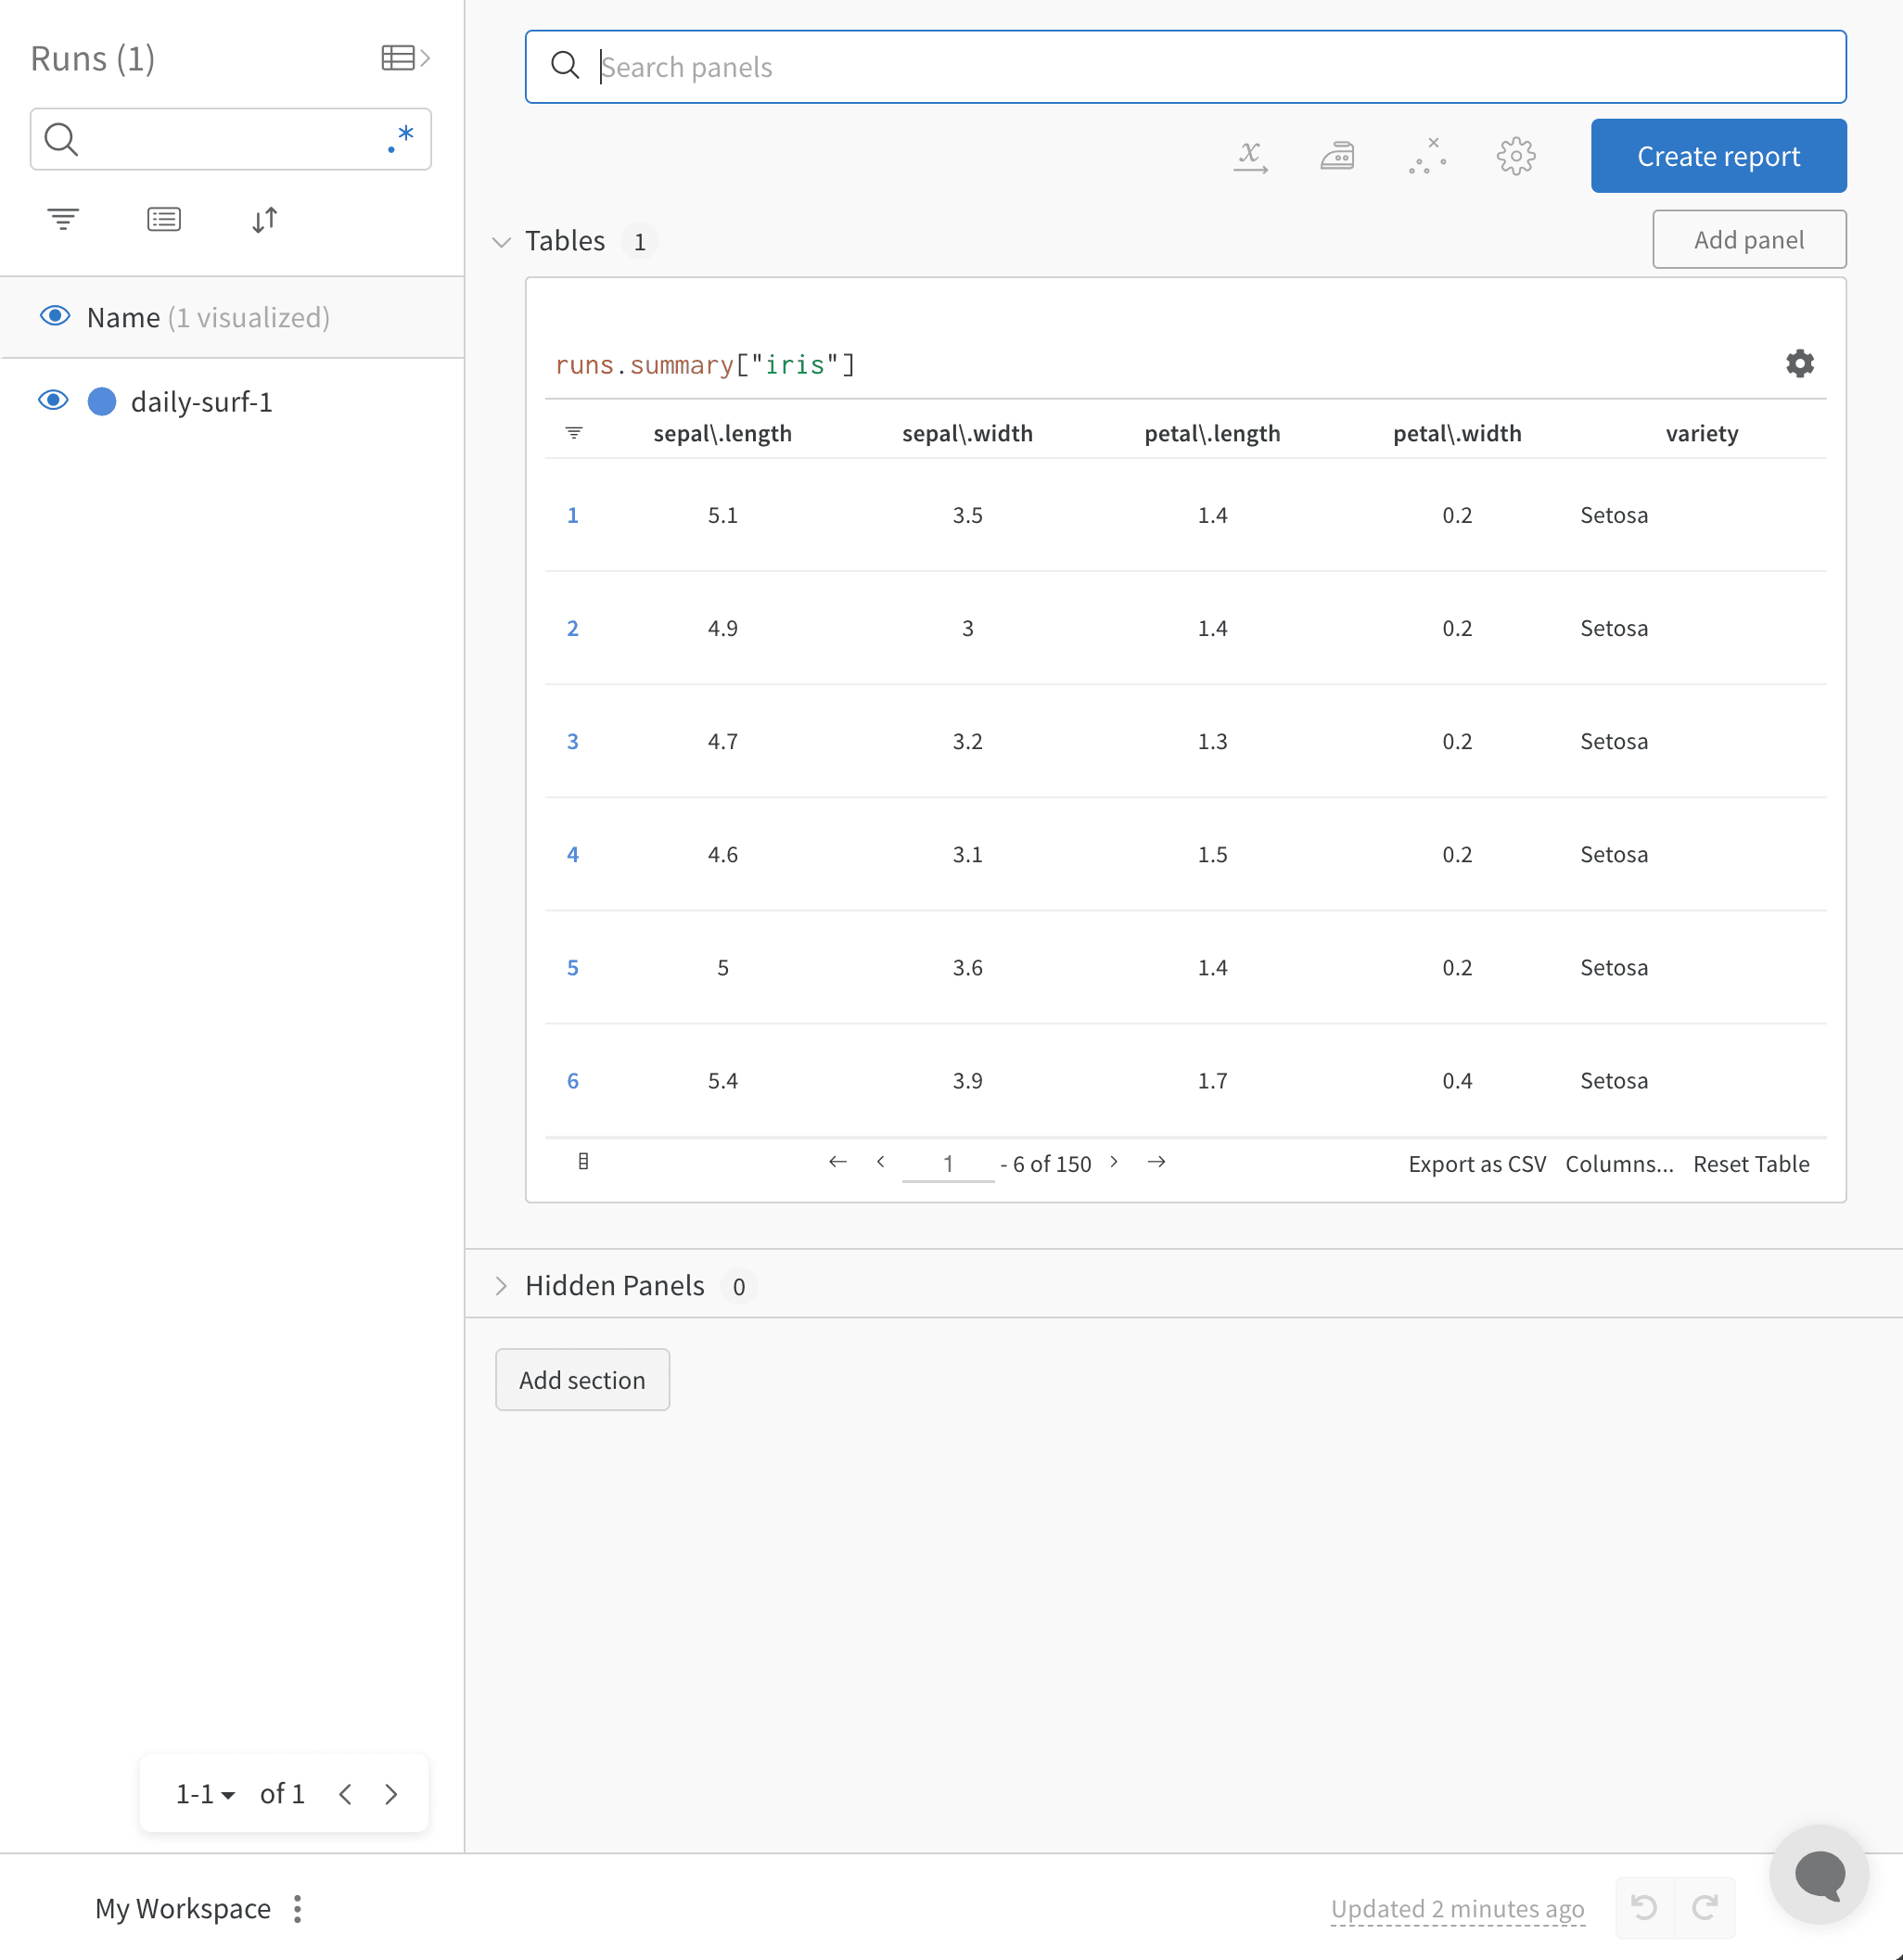
The `wandb.init()` API spawns a new background process to log data to a Run, and it synchronizes data to wandb.ai (by default). View live visualizations on your W\&B Workspace Dashboard. The following image demonstrates the output of the code snippet demonstration.
 The full script with the preceding code snippets is found below:
```python theme={"system"}
import wandb
import pandas as pd
# Read our CSV into a new DataFrame
new_iris_dataframe = pd.read_csv("iris.csv")
# Convert the DataFrame into a W&B Table
iris_table = wandb.Table(dataframe=new_iris_dataframe)
# Add the table to an Artifact to increase the row
# limit to 200000 and make it easier to reuse
iris_table_artifact = wandb.Artifact("iris_artifact", type="dataset")
iris_table_artifact.add(iris_table, "iris_table")
# log the raw csv file within an artifact to preserve our data
iris_table_artifact.add_file("iris.csv")
# Start a W&B run to log data
with wandb.init(project="tables-walkthrough") as run:
# Log the table to visualize with a run...
run.log({"iris": iris_table})
# and Log as an Artifact to increase the available row limit!
run.log_artifact(iris_table_artifact)
```
## Import and log your CSV of Experiments
In some cases, you might have your experiment details in a CSV file. Common details found in such CSV files include:
* A name for the experiment run
* Initial [notes](/products/wandb/runs#add-a-note-to-a-run)
* [Tags](/products/wandb/runs/tags) to differentiate the experiments
* Configurations needed for your experiment (with the added benefit of being able to utilize our [Sweeps Hyperparameter Tuning](/products/wandb/sweeps)).
| Experiment | Model Name | Notes | Tags | Num Layers | Final Train Acc | Final Val Acc | Training Losses |
| - | - | - | - | - | - | - | - |
| Experiment 1 | mnist-300-layers | Overfit way too much on training data | \[latest] | 300 | 0.99 | 0.90 | \[0.55, 0.45, 0.44, 0.42, 0.40, 0.39] |
| Experiment 2 | mnist-250-layers | Current best model | \[prod, best] | 250 | 0.95 | 0.96 | \[0.55, 0.45, 0.44, 0.42, 0.40, 0.39] |
| Experiment 3 | mnist-200-layers | Did worse than the baseline model. Need to debug | \[debug] | 200 | 0.76 | 0.70 | \[0.55, 0.45, 0.44, 0.42, 0.40, 0.39] |
| ... | ... | ... | ... | ... | ... | ... | |
| Experiment N | mnist-X-layers | NOTES | ... | ... | ... | ... | \[..., ...] |
Weights & Biases can take CSV files of experiments and convert it into a W\&B Experiment Run. The following code snippets and code script demonstrates how to import and log your CSV file of experiments:
1. To get started, first read in your CSV file and convert it into a Pandas DataFrame. Replace `"experiments.csv"` with the name of your CSV file:
```python theme={"system"}
import wandb
import pandas as pd
FILENAME = "experiments.csv"
loaded_experiment_df = pd.read_csv(FILENAME)
PROJECT_NAME = "Converted Experiments"
EXPERIMENT_NAME_COL = "Experiment"
NOTES_COL = "Notes"
TAGS_COL = "Tags"
CONFIG_COLS = ["Num Layers"]
SUMMARY_COLS = ["Final Train Acc", "Final Val Acc"]
METRIC_COLS = ["Training Losses"]
# Format Pandas DataFrame to make it easier to work with
for i, row in loaded_experiment_df.iterrows():
run_name = row[EXPERIMENT_NAME_COL]
notes = row[NOTES_COL]
tags = row[TAGS_COL]
config = {}
for config_col in CONFIG_COLS:
config[config_col] = row[config_col]
metrics = {}
for metric_col in METRIC_COLS:
metrics[metric_col] = row[metric_col]
summaries = {}
for summary_col in SUMMARY_COLS:
summaries[summary_col] = row[summary_col]
```
2. Next, start a new W\&B Run to track and log to Weights & Biases with [`wandb.init()`](/products/wandb/ref/python/functions/init):
```python theme={"system"}
with wandb.init(
project=PROJECT_NAME, name=run_name, tags=tags, notes=notes, config=config
) as run:
```
As an experiment runs, you might want to log every instance of your metrics so they are available to view, query, and analyze with Weights & Biases. Use the [`run.log()`](/products/wandb/ref/python/experiments/run#method-runlog) command to accomplish this:
```python theme={"system"}
run.log({key: val})
```
You can optionally log a final summary metric to define the outcome of the run using the [`define_metric`](/products/wandb/ref/python/experiments/run#define_metric) API. This example adds the summary metrics to our run with `run.summary.update()`:
```python theme={"system"}
run.summary.update(summaries)
```
For more information about summary metrics, see [Log Summary Metrics](/products/wandb/track/log/log-summary).
Below is the full example script that converts the above sample table into a [W\&B Dashboard](/products/wandb/track/workspaces):
```python theme={"system"}
FILENAME = "experiments.csv"
loaded_experiment_df = pd.read_csv(FILENAME)
PROJECT_NAME = "Converted Experiments"
EXPERIMENT_NAME_COL = "Experiment"
NOTES_COL = "Notes"
TAGS_COL = "Tags"
CONFIG_COLS = ["Num Layers"]
SUMMARY_COLS = ["Final Train Acc", "Final Val Acc"]
METRIC_COLS = ["Training Losses"]
for i, row in loaded_experiment_df.iterrows():
run_name = row[EXPERIMENT_NAME_COL]
notes = row[NOTES_COL]
tags = row[TAGS_COL]
config = {}
for config_col in CONFIG_COLS:
config[config_col] = row[config_col]
metrics = {}
for metric_col in METRIC_COLS:
metrics[metric_col] = row[metric_col]
summaries = {}
for summary_col in SUMMARY_COLS:
summaries[summary_col] = row[summary_col]
with wandb.init(
project=PROJECT_NAME, name=run_name, tags=tags, notes=notes, config=config
) as run:
for key, val in metrics.items():
if isinstance(val, list):
for _val in val:
run.log({key: _val})
else:
run.log({key: val})
run.summary.update(summaries)
```
## Related topics
- [Why are steps missing from a CSV metric export?](/support/models/articles/why-are-steps-missing-from-a-csv-metric-.md)
The full script with the preceding code snippets is found below:
```python theme={"system"}
import wandb
import pandas as pd
# Read our CSV into a new DataFrame
new_iris_dataframe = pd.read_csv("iris.csv")
# Convert the DataFrame into a W&B Table
iris_table = wandb.Table(dataframe=new_iris_dataframe)
# Add the table to an Artifact to increase the row
# limit to 200000 and make it easier to reuse
iris_table_artifact = wandb.Artifact("iris_artifact", type="dataset")
iris_table_artifact.add(iris_table, "iris_table")
# log the raw csv file within an artifact to preserve our data
iris_table_artifact.add_file("iris.csv")
# Start a W&B run to log data
with wandb.init(project="tables-walkthrough") as run:
# Log the table to visualize with a run...
run.log({"iris": iris_table})
# and Log as an Artifact to increase the available row limit!
run.log_artifact(iris_table_artifact)
```
## Import and log your CSV of Experiments
In some cases, you might have your experiment details in a CSV file. Common details found in such CSV files include:
* A name for the experiment run
* Initial [notes](/products/wandb/runs#add-a-note-to-a-run)
* [Tags](/products/wandb/runs/tags) to differentiate the experiments
* Configurations needed for your experiment (with the added benefit of being able to utilize our [Sweeps Hyperparameter Tuning](/products/wandb/sweeps)).
| Experiment | Model Name | Notes | Tags | Num Layers | Final Train Acc | Final Val Acc | Training Losses |
| - | - | - | - | - | - | - | - |
| Experiment 1 | mnist-300-layers | Overfit way too much on training data | \[latest] | 300 | 0.99 | 0.90 | \[0.55, 0.45, 0.44, 0.42, 0.40, 0.39] |
| Experiment 2 | mnist-250-layers | Current best model | \[prod, best] | 250 | 0.95 | 0.96 | \[0.55, 0.45, 0.44, 0.42, 0.40, 0.39] |
| Experiment 3 | mnist-200-layers | Did worse than the baseline model. Need to debug | \[debug] | 200 | 0.76 | 0.70 | \[0.55, 0.45, 0.44, 0.42, 0.40, 0.39] |
| ... | ... | ... | ... | ... | ... | ... | |
| Experiment N | mnist-X-layers | NOTES | ... | ... | ... | ... | \[..., ...] |
Weights & Biases can take CSV files of experiments and convert it into a W\&B Experiment Run. The following code snippets and code script demonstrates how to import and log your CSV file of experiments:
1. To get started, first read in your CSV file and convert it into a Pandas DataFrame. Replace `"experiments.csv"` with the name of your CSV file:
```python theme={"system"}
import wandb
import pandas as pd
FILENAME = "experiments.csv"
loaded_experiment_df = pd.read_csv(FILENAME)
PROJECT_NAME = "Converted Experiments"
EXPERIMENT_NAME_COL = "Experiment"
NOTES_COL = "Notes"
TAGS_COL = "Tags"
CONFIG_COLS = ["Num Layers"]
SUMMARY_COLS = ["Final Train Acc", "Final Val Acc"]
METRIC_COLS = ["Training Losses"]
# Format Pandas DataFrame to make it easier to work with
for i, row in loaded_experiment_df.iterrows():
run_name = row[EXPERIMENT_NAME_COL]
notes = row[NOTES_COL]
tags = row[TAGS_COL]
config = {}
for config_col in CONFIG_COLS:
config[config_col] = row[config_col]
metrics = {}
for metric_col in METRIC_COLS:
metrics[metric_col] = row[metric_col]
summaries = {}
for summary_col in SUMMARY_COLS:
summaries[summary_col] = row[summary_col]
```
2. Next, start a new W\&B Run to track and log to Weights & Biases with [`wandb.init()`](/products/wandb/ref/python/functions/init):
```python theme={"system"}
with wandb.init(
project=PROJECT_NAME, name=run_name, tags=tags, notes=notes, config=config
) as run:
```
As an experiment runs, you might want to log every instance of your metrics so they are available to view, query, and analyze with Weights & Biases. Use the [`run.log()`](/products/wandb/ref/python/experiments/run#method-runlog) command to accomplish this:
```python theme={"system"}
run.log({key: val})
```
You can optionally log a final summary metric to define the outcome of the run using the [`define_metric`](/products/wandb/ref/python/experiments/run#define_metric) API. This example adds the summary metrics to our run with `run.summary.update()`:
```python theme={"system"}
run.summary.update(summaries)
```
For more information about summary metrics, see [Log Summary Metrics](/products/wandb/track/log/log-summary).
Below is the full example script that converts the above sample table into a [W\&B Dashboard](/products/wandb/track/workspaces):
```python theme={"system"}
FILENAME = "experiments.csv"
loaded_experiment_df = pd.read_csv(FILENAME)
PROJECT_NAME = "Converted Experiments"
EXPERIMENT_NAME_COL = "Experiment"
NOTES_COL = "Notes"
TAGS_COL = "Tags"
CONFIG_COLS = ["Num Layers"]
SUMMARY_COLS = ["Final Train Acc", "Final Val Acc"]
METRIC_COLS = ["Training Losses"]
for i, row in loaded_experiment_df.iterrows():
run_name = row[EXPERIMENT_NAME_COL]
notes = row[NOTES_COL]
tags = row[TAGS_COL]
config = {}
for config_col in CONFIG_COLS:
config[config_col] = row[config_col]
metrics = {}
for metric_col in METRIC_COLS:
metrics[metric_col] = row[metric_col]
summaries = {}
for summary_col in SUMMARY_COLS:
summaries[summary_col] = row[summary_col]
with wandb.init(
project=PROJECT_NAME, name=run_name, tags=tags, notes=notes, config=config
) as run:
for key, val in metrics.items():
if isinstance(val, list):
for _val in val:
run.log({key: _val})
else:
run.log({key: val})
run.summary.update(summaries)
```
## Related topics
- [Why are steps missing from a CSV metric export?](/support/models/articles/why-are-steps-missing-from-a-csv-metric-.md)