> ## Documentation Index
> Fetch the complete documentation index at: https://docs.coreweave.com/llms.txt
> Use this file to discover all available pages before exploring further.
# 4. Monitor jobs with Grafana
> Monitor Slurm training jobs using CoreWeave's Grafana dashboards for GPU utilization and performance metrics
This is the fourth page of the **Train on SUNK** tutorial series. After submitting your training job in the previous step, you need a way to observe how it runs on the cluster. This page shows you how to use CoreWeave's Grafana dashboards to monitor Slurm training jobs, inspect GPU utilization, and identify performance bottlenecks so you can confirm your job is progressing as expected.
## Monitor Slurm jobs with CoreWeave Grafana
The following sections describe how to open Grafana and locate the dashboard used to inspect Slurm job activity.
To open CoreWeave Grafana, first log in to the [CoreWeave Cloud Console](https://console.coreweave.com/).
From the Console, either navigate to **Grafana** from the left-hand navigation or access it directly at `https://cks-grafana.coreweave.com`. From there, select **Dashboards**, then select the **[Slurm / Job metrics dashboard](https://grafana.int.coreweave.com/d/slurm-job-metrics/slurm-job-metrics?orgId=1\&refresh=1m)**.
### Slurm job metrics dashboard
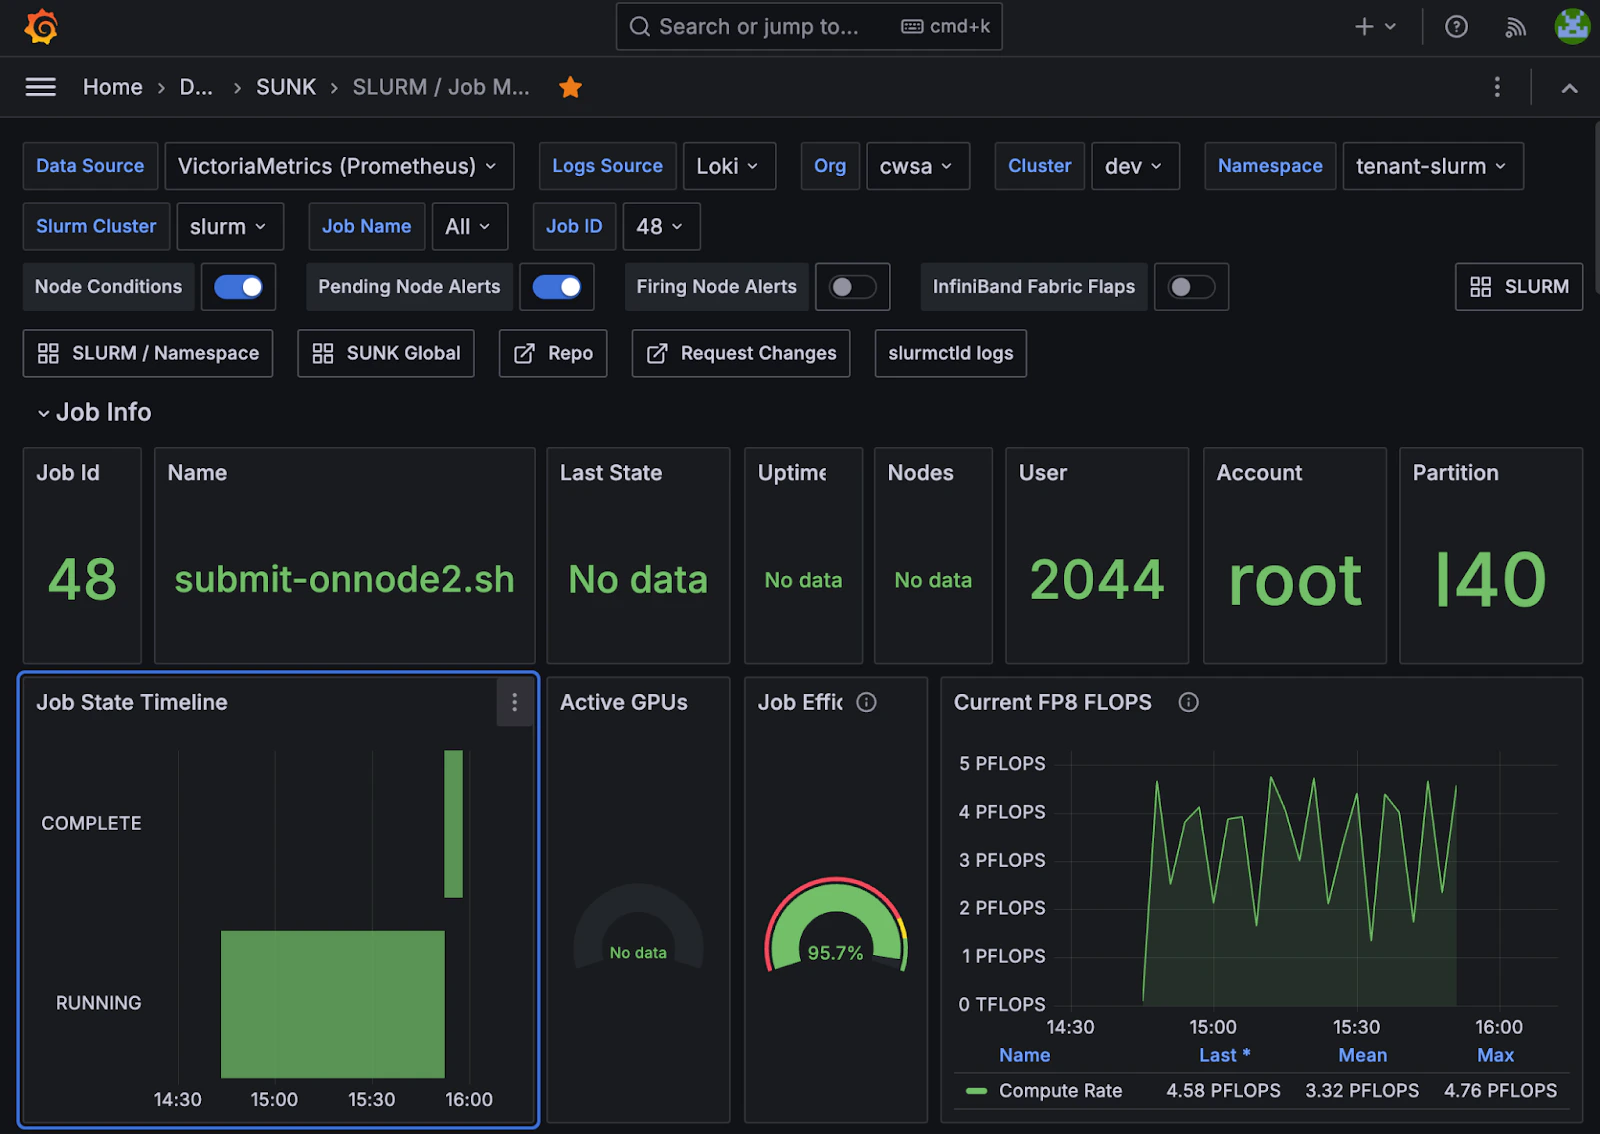 This dashboard displays metrics used for debugging and analyzing the performance of specific jobs within your cluster. It provides detailed information about the nodes running a given job, including alerts and node details.
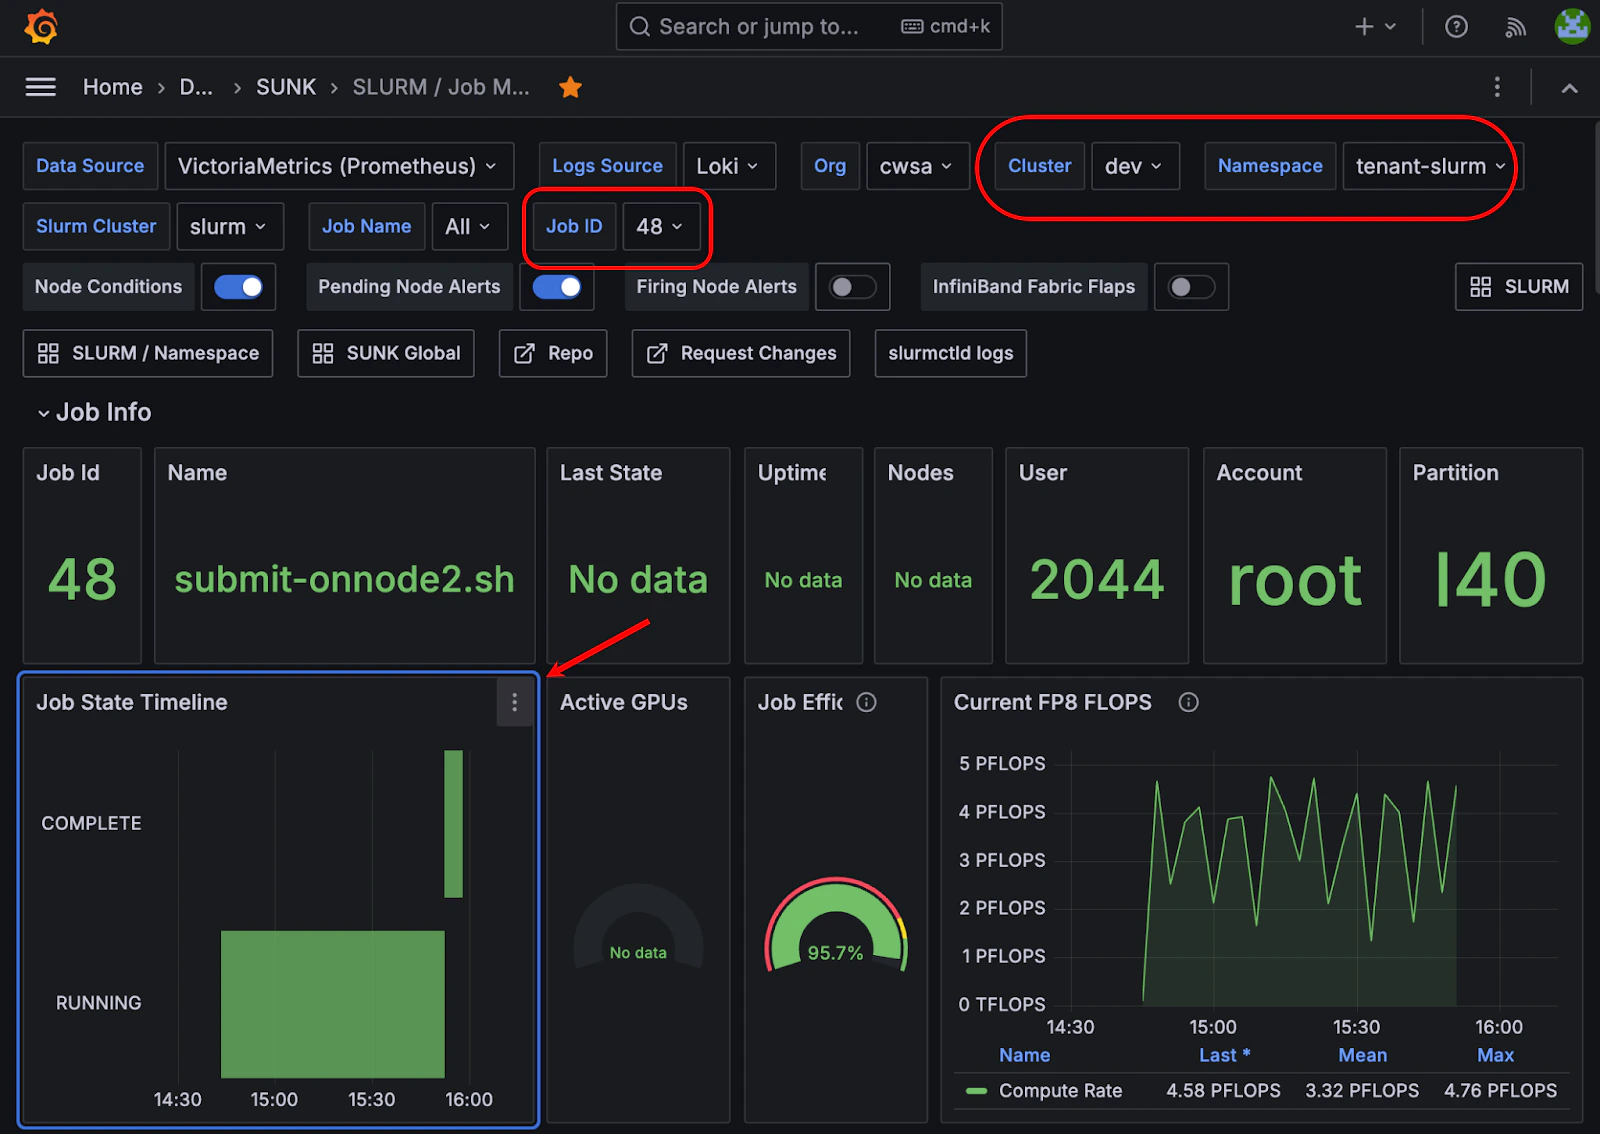
To display details about a specific job, including information about the nodes the job ran on, select the cluster and job of interest from the top of the dashboard. For example, the following image displays details on job `48`. The **Job State Timeline** in the lower left-hand corner shows that the job ran for over one hour.
This dashboard displays metrics used for debugging and analyzing the performance of specific jobs within your cluster. It provides detailed information about the nodes running a given job, including alerts and node details.
To display details about a specific job, including information about the nodes the job ran on, select the cluster and job of interest from the top of the dashboard. For example, the following image displays details on job `48`. The **Job State Timeline** in the lower left-hand corner shows that the job ran for over one hour.
 The dashboard also captures the states of the job (`Pending`, `Running`, `Complete`, and so on) chronologically. This information can be useful for debugging and performance analysis.
On the right, you can see two key metrics:
* **Job Efficiency** captures an estimate of GPU usage during the job's run.
* **Current FP8 FLOPS** shows the compute rate as the job runs. It is common to see a regular pattern of peaks and valleys as the job runs. Typically, areas with less compute usage appear when the job loads data or saves checkpoints.
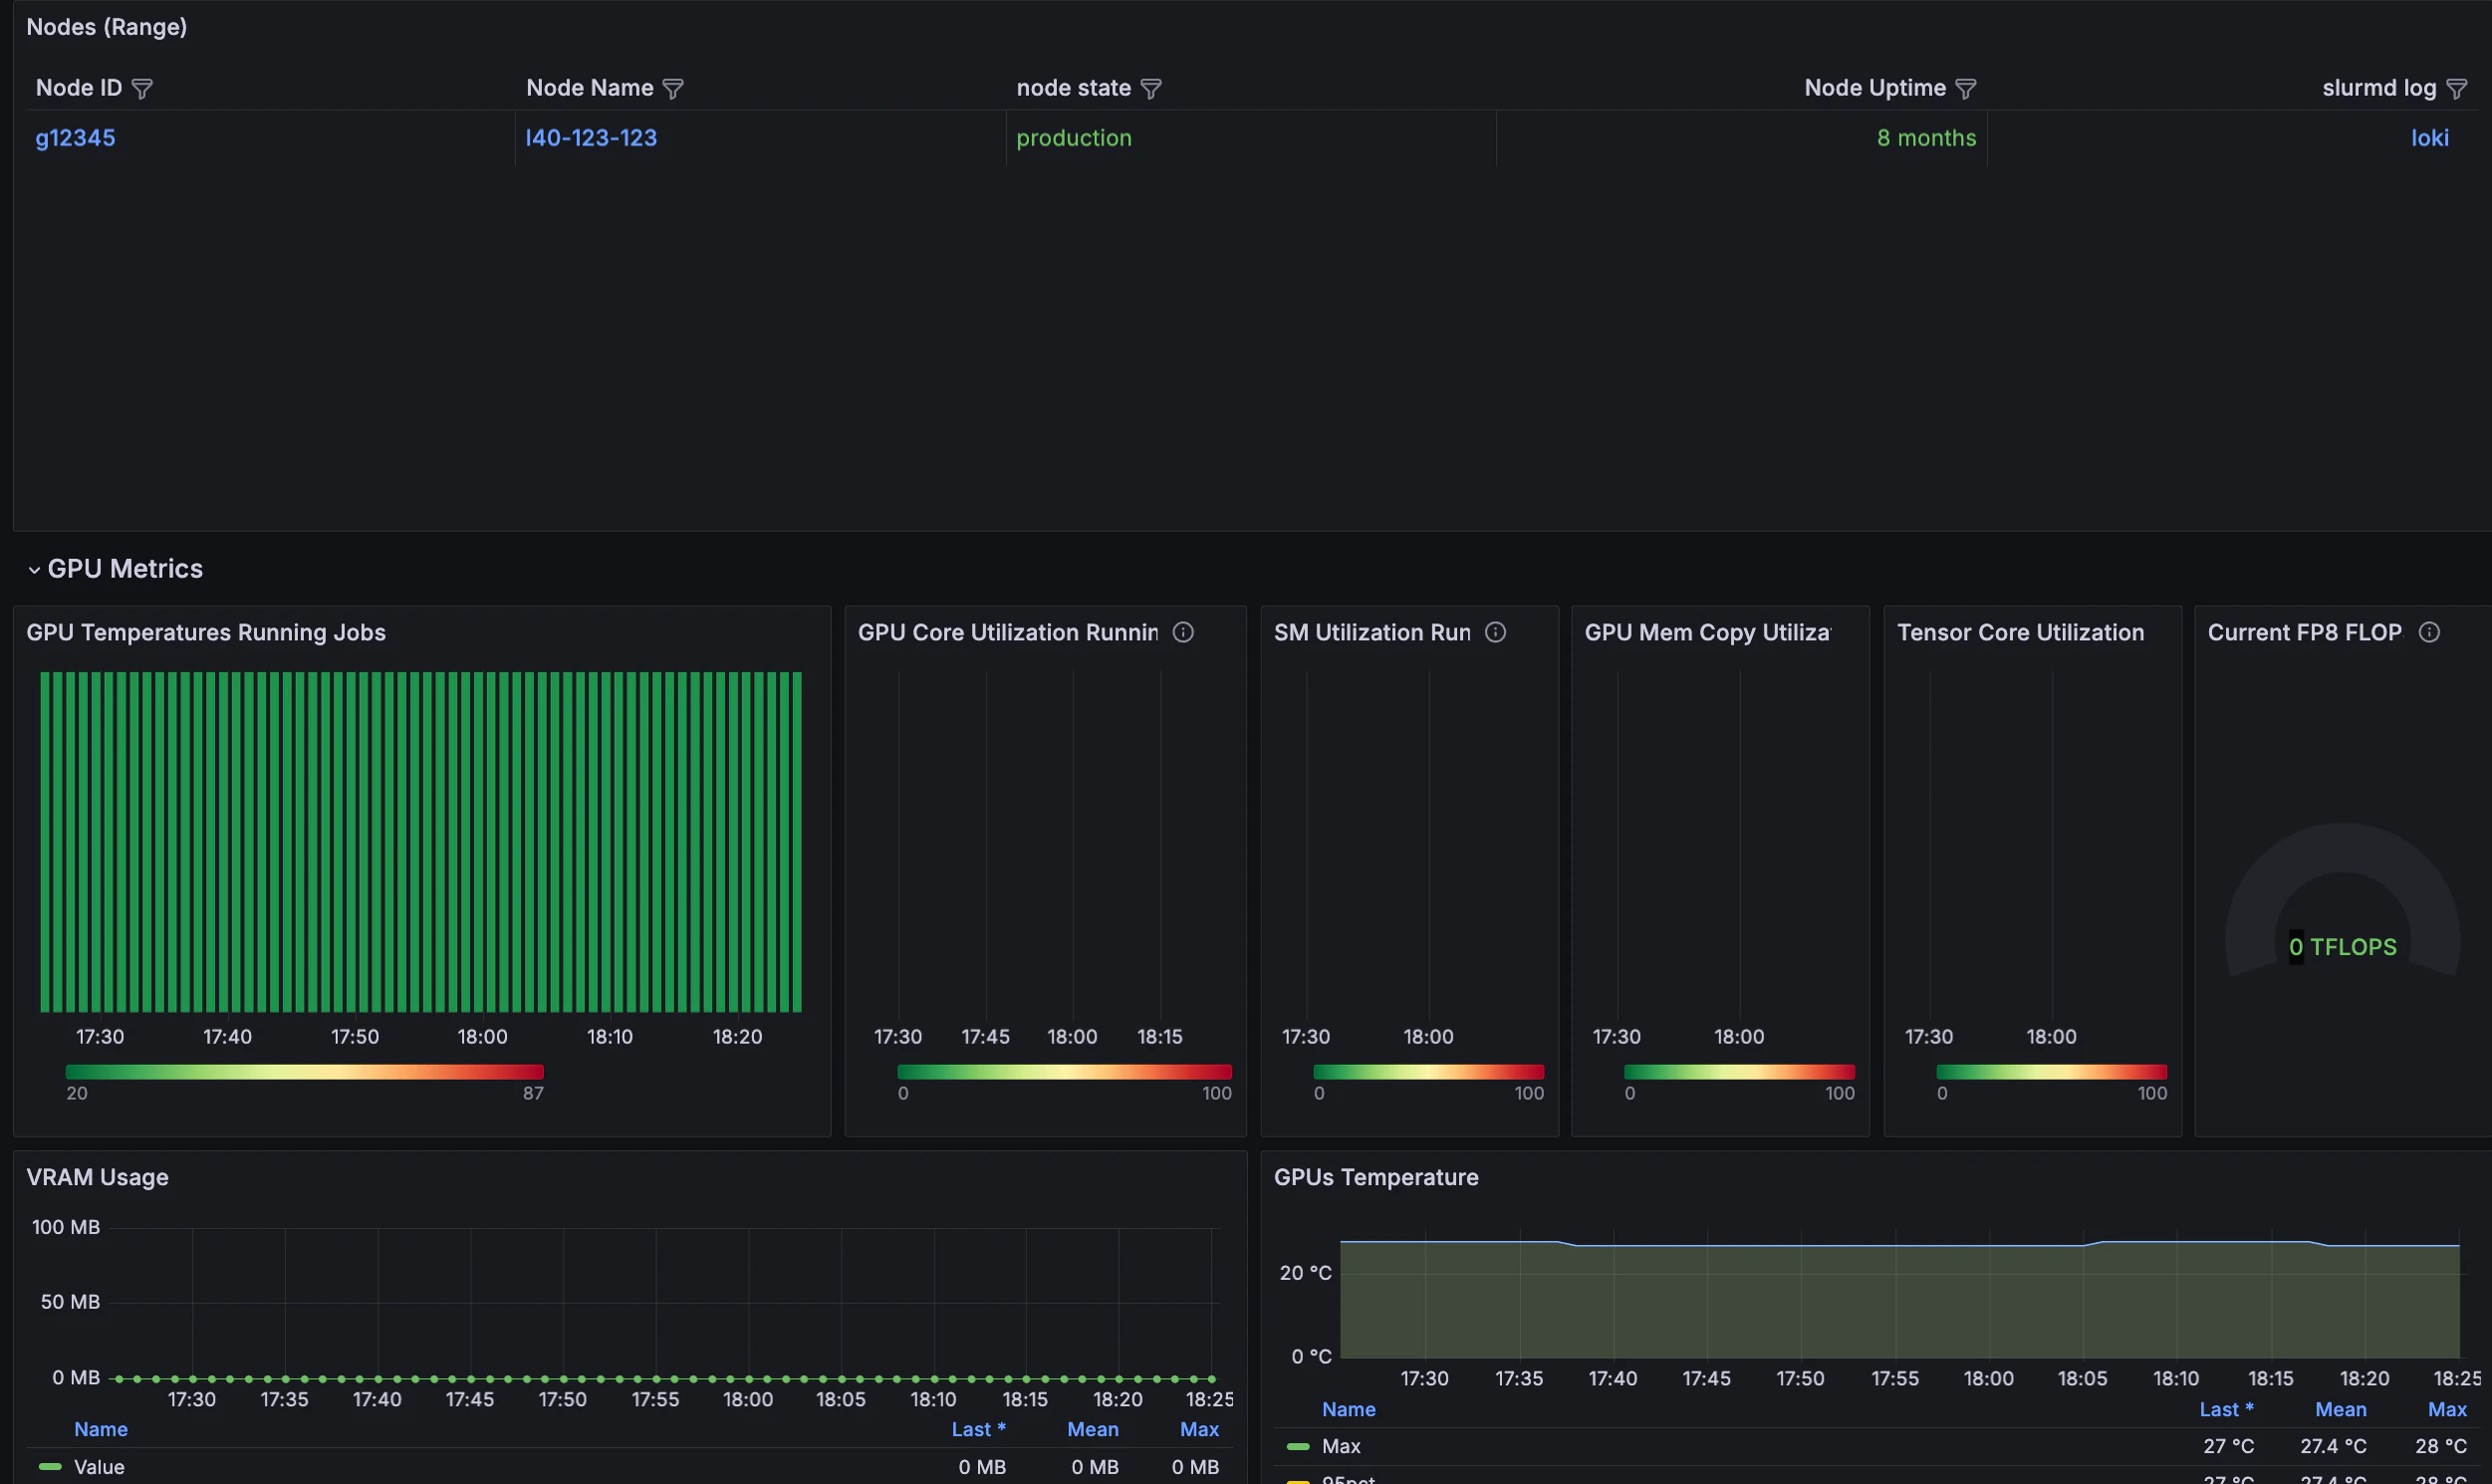
More information is displayed further down the dashboard page, including the nodes used to run the job and additional GPU metrics. To open a Grafana page on a specific node, select the displayed node ID.
The dashboard also captures the states of the job (`Pending`, `Running`, `Complete`, and so on) chronologically. This information can be useful for debugging and performance analysis.
On the right, you can see two key metrics:
* **Job Efficiency** captures an estimate of GPU usage during the job's run.
* **Current FP8 FLOPS** shows the compute rate as the job runs. It is common to see a regular pattern of peaks and valleys as the job runs. Typically, areas with less compute usage appear when the job loads data or saves checkpoints.
More information is displayed further down the dashboard page, including the nodes used to run the job and additional GPU metrics. To open a Grafana page on a specific node, select the displayed node ID.
 ### GPU metrics
Further down the dashboard, GPU-specific panels help you confirm that the hardware runs as expected during the run.
The included GPU metrics display information on the job's run. At its most abstracted level, the presence of red indicates that the given aspect of the GPU is working hard, whereas the presence of green signifies that the given part of the GPU is working less hard.
This example runs a 124M cell GPT2 test model on two L40 nodes, without InfiniBand.
### GPU metrics
Further down the dashboard, GPU-specific panels help you confirm that the hardware runs as expected during the run.
The included GPU metrics display information on the job's run. At its most abstracted level, the presence of red indicates that the given aspect of the GPU is working hard, whereas the presence of green signifies that the given part of the GPU is working less hard.
This example runs a 124M cell GPT2 test model on two L40 nodes, without InfiniBand.
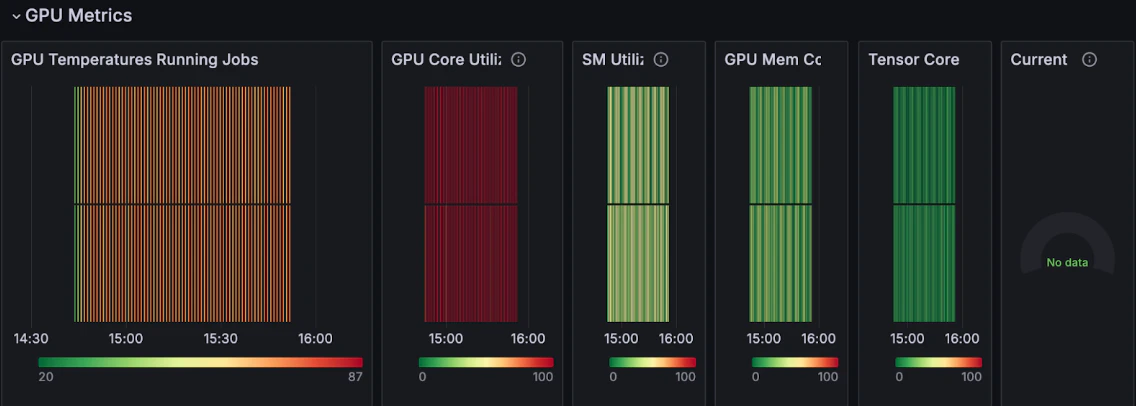 Different codes and data stress different parts of the GPU. A quick glance at the graphs is a way to check if the job runs correctly.
At a glance, you can see that:
* The **GPU temperature** rises (progressing from a green average into an orange average) while the job runs. This is a clear indication that the GPUs are busy.
* The **GPU Core Utilization** is high, while **GPU Mem** is less used, an expected outcome for a small model.
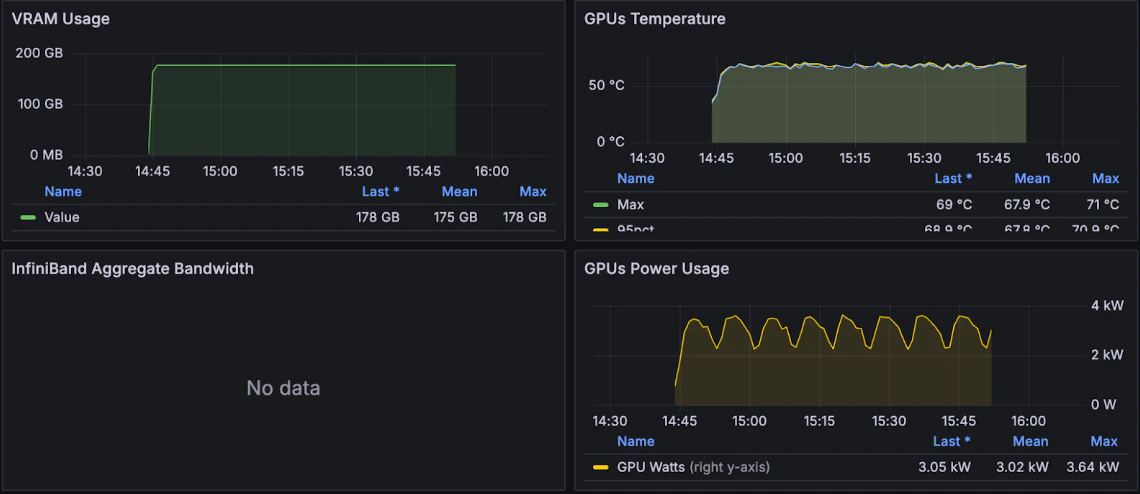
Even further down on this same dashboard, you can see the job uses about 175 GB of memory, and the GPU temperature hovers around 68°C, both indicators that the job is progressing well. You also see the **GPU power usage** levels.
Different codes and data stress different parts of the GPU. A quick glance at the graphs is a way to check if the job runs correctly.
At a glance, you can see that:
* The **GPU temperature** rises (progressing from a green average into an orange average) while the job runs. This is a clear indication that the GPUs are busy.
* The **GPU Core Utilization** is high, while **GPU Mem** is less used, an expected outcome for a small model.
Even further down on this same dashboard, you can see the job uses about 175 GB of memory, and the GPU temperature hovers around 68°C, both indicators that the job is progressing well. You also see the **GPU power usage** levels.
 ### Filesystem metrics
Storage performance can affect training throughput, so the dashboard also surfaces filesystem activity for the job.
Even further down the dashboard is information on the filesystem. Two metrics of importance displayed on the bottom left-hand side of the dashboard are the **NFS Average Response/Request** and **NFS Total Read/Write** rate.
* The **NFS Average** graphs indicate how well the filesystem performs. A slowdown or spike indicates that the storage is slowing down, and that the job may perform better with faster or different storage, such as [CoreWeave AI Object Storage](/products/storage/object-storage).
* The **NFS Total Read / Write Rate** demonstrates the total `read` and `write` operations on the filesystem. When a job first begins, it is typical to see a large `read` spike as the job reads in the model and data. While the job runs, a regular `write` spike is typical. This indicates when the job writes out checkpoints.
For more information about the metrics displayed in this dashboard, see [Slurm / Job Metrics](/observability/managed-grafana/sunk/slurm-job-metrics).
With these dashboards, you now have visibility into how your training job uses GPU, memory, and storage resources on the cluster, and you can use that information to validate runs or investigate performance issues in future jobs.
### Filesystem metrics
Storage performance can affect training throughput, so the dashboard also surfaces filesystem activity for the job.
Even further down the dashboard is information on the filesystem. Two metrics of importance displayed on the bottom left-hand side of the dashboard are the **NFS Average Response/Request** and **NFS Total Read/Write** rate.
* The **NFS Average** graphs indicate how well the filesystem performs. A slowdown or spike indicates that the storage is slowing down, and that the job may perform better with faster or different storage, such as [CoreWeave AI Object Storage](/products/storage/object-storage).
* The **NFS Total Read / Write Rate** demonstrates the total `read` and `write` operations on the filesystem. When a job first begins, it is typical to see a large `read` spike as the job reads in the model and data. While the job runs, a regular `write` spike is typical. This indicates when the job writes out checkpoints.
For more information about the metrics displayed in this dashboard, see [Slurm / Job Metrics](/observability/managed-grafana/sunk/slurm-job-metrics).
With these dashboards, you now have visibility into how your training job uses GPU, memory, and storage resources on the cluster, and you can use that information to validate runs or investigate performance issues in future jobs.