> ## Documentation Index
> Fetch the complete documentation index at: https://docs.coreweave.com/llms.txt
> Use this file to discover all available pages before exploring further.
# Configure Telemetry Relay
> Forward CoreWeave audit logs to an HTTPS endpoint using the Cloud Console or the Telemetry Relay API
You can configure Telemetry Relay using the Cloud Console or the [Telemetry Relay API](/observability/telemetry-forwarding/telemetry-relay-api).
To configure Telemetry Relay, you define the following:
* **Destinations**: Where telemetry is sent, such as an HTTPS endpoint.
* **Streams**: Predefined telemetry categories, such as audit logs.
* **Pipelines**: A configuration that links a stream to a destination (endpoint).
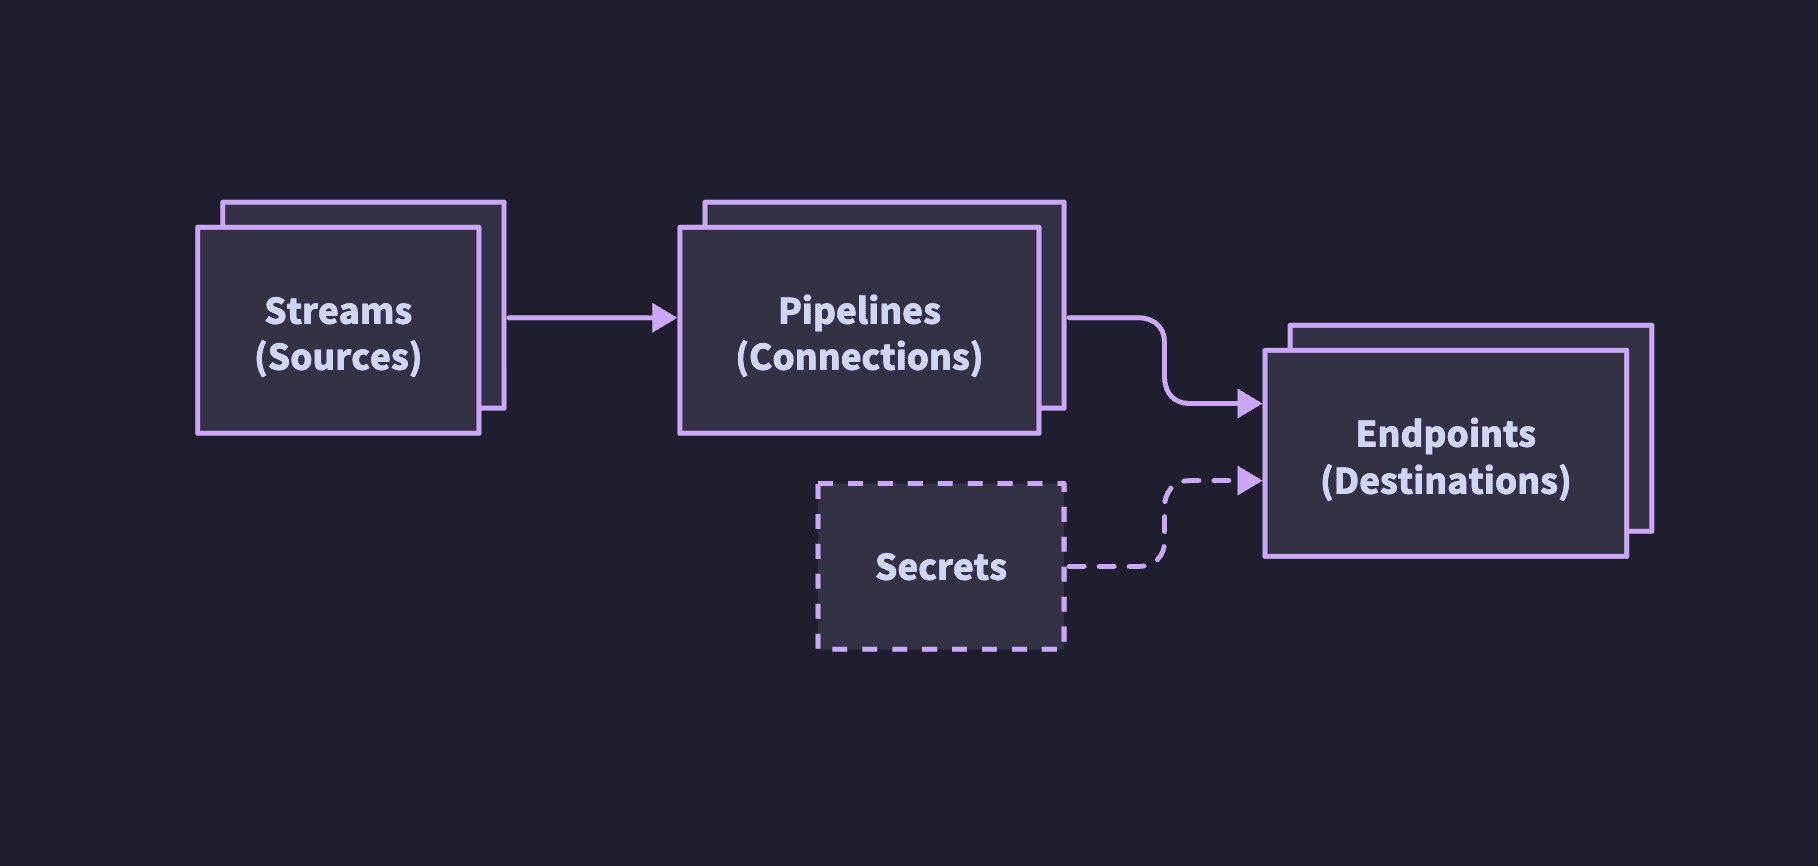 For information about supported telemetry, see [Introduction to Telemetry Relay](/observability/telemetry-forwarding/relay).
## Prerequisites
Before you can create destinations or pipelines, your organization must be enabled for Telemetry Relay self-service. Self-service is limited to forwarding audit logs to HTTPS endpoints. If your organization is not yet enabled, or you want to forward other telemetry or use a different destination type, [contact Support](/support).
To configure Telemetry Relay or view destinations and pipelines, you need one of the following [roles](/security/iam/access-policies#roles):
| Role | Permissions |
| :--------------------- | :----------------------------------------------------------- |
| Telemetry Relay Admin | Create, read, update, and delete Telemetry Relay components. |
| Telemetry Relay Reader | Read Telemetry Relay components. |
To manage Telemetry Relay through the API, see the [Telemetry Relay API reference](/observability/telemetry-forwarding/telemetry-relay-api).
If you use the API and your organization is not yet enabled, write requests return `404` with `"reason": "TELEMETRYRELAY_ORGANIZATION_NOT_FOUND"`. [Contact Support](/support) to request enablement.
## Create a destination
Self-service supports only HTTPS endpoints as destinations. For other destination types, [contact Support](/support).
Create a destination using the Cloud Console:
1. Navigate to [Telemetry Relay](https://console.coreweave.com/telemetry-relay/pipelines) in the Cloud Console and select **Destinations**.
2. Click **Create destination**.
3. On the **Create destination** page, fill in the following fields:
* **Display name**: A label for the destination. The display name appears in the **Destinations** table and in the **Destination** dropdown when you create a pipeline.
* **Endpoint type**: The protocol the destination uses to receive telemetry. Self-service supports HTTPS endpoints only.
* **Endpoint URL**: The URL where Telemetry Relay sends telemetry.
* **Authentication type**: The credential scheme Telemetry Relay uses when it connects to the endpoint.
4. Click **Submit**.
The new destination appears in the **Destinations** table.
## Create a pipeline
Create a pipeline using the Cloud Console:
1. Navigate to [Telemetry Relay](https://console.coreweave.com/telemetry-relay/pipelines) in the Cloud Console.
2. Click **Create pipeline**.
3. On the **Create pipeline** page, fill in the following fields:
* **Source**: The telemetry stream to forward. Streams are predefined categories of CoreWeave telemetry, such as **Console Audit Logs** or **Kubernetes API Audit Logs**.
* **Destination**: An existing destination to receive the stream. The dropdown lists destinations created in the **Destinations** tab.
After you fill in both fields, a read-only **Generated Pipeline Name** field shows the resulting slug, which combines the source and destination names (for example, `logs-audit-console-my-endpoint`). You don't enter a name yourself.
4. Click **Submit**.
The new pipeline appears in the **Pipelines** table. To leave the **Create pipeline** page without saving, click **Back to Pipelines**.
## List destinations
To view destinations in the Cloud Console, navigate to [Telemetry Relay](https://console.coreweave.com/telemetry-relay/pipelines) and select **Destinations**. The table lists each destination's **Name**, **Type**, **Region**, and **Endpoint**.
## List streams
To view available telemetry streams:
1. Navigate to [Telemetry Relay](https://console.coreweave.com/telemetry-relay/pipelines) and select **Create pipeline**.
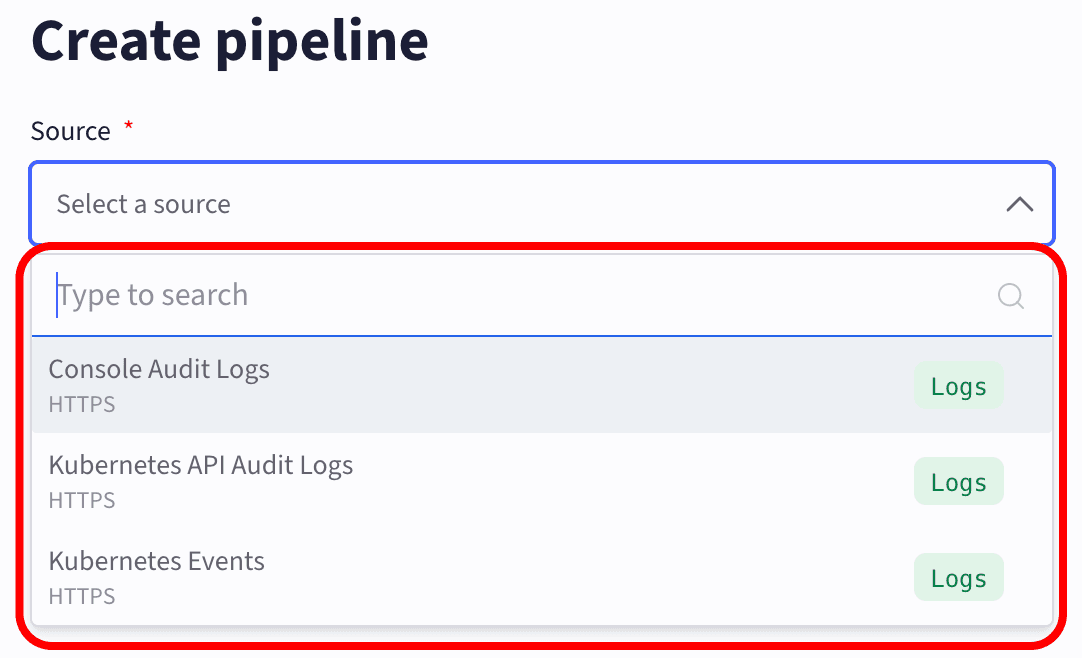
2. Select **Source** to view the available streams.
Streams appear by display name (for example, **Console Audit Logs**, **Kubernetes API Audit Logs**). These are the same streams the [Telemetry Relay API](/observability/telemetry-forwarding/telemetry-relay-api) exposes through slug identifiers like `logs-audit-console`. To leave the **Create pipeline** page without creating a pipeline, click **Back to Pipelines**.
The **Source** dropdown lists every telemetry stream available to your organization, including streams that are outside the self-service scope. Self-service supports forwarding audit-log streams to HTTPS endpoints. To forward other streams, [contact Support](/support).
For information about supported telemetry, see [Introduction to Telemetry Relay](/observability/telemetry-forwarding/relay).
## Prerequisites
Before you can create destinations or pipelines, your organization must be enabled for Telemetry Relay self-service. Self-service is limited to forwarding audit logs to HTTPS endpoints. If your organization is not yet enabled, or you want to forward other telemetry or use a different destination type, [contact Support](/support).
To configure Telemetry Relay or view destinations and pipelines, you need one of the following [roles](/security/iam/access-policies#roles):
| Role | Permissions |
| :--------------------- | :----------------------------------------------------------- |
| Telemetry Relay Admin | Create, read, update, and delete Telemetry Relay components. |
| Telemetry Relay Reader | Read Telemetry Relay components. |
To manage Telemetry Relay through the API, see the [Telemetry Relay API reference](/observability/telemetry-forwarding/telemetry-relay-api).
If you use the API and your organization is not yet enabled, write requests return `404` with `"reason": "TELEMETRYRELAY_ORGANIZATION_NOT_FOUND"`. [Contact Support](/support) to request enablement.
## Create a destination
Self-service supports only HTTPS endpoints as destinations. For other destination types, [contact Support](/support).
Create a destination using the Cloud Console:
1. Navigate to [Telemetry Relay](https://console.coreweave.com/telemetry-relay/pipelines) in the Cloud Console and select **Destinations**.
2. Click **Create destination**.
3. On the **Create destination** page, fill in the following fields:
* **Display name**: A label for the destination. The display name appears in the **Destinations** table and in the **Destination** dropdown when you create a pipeline.
* **Endpoint type**: The protocol the destination uses to receive telemetry. Self-service supports HTTPS endpoints only.
* **Endpoint URL**: The URL where Telemetry Relay sends telemetry.
* **Authentication type**: The credential scheme Telemetry Relay uses when it connects to the endpoint.
4. Click **Submit**.
The new destination appears in the **Destinations** table.
## Create a pipeline
Create a pipeline using the Cloud Console:
1. Navigate to [Telemetry Relay](https://console.coreweave.com/telemetry-relay/pipelines) in the Cloud Console.
2. Click **Create pipeline**.
3. On the **Create pipeline** page, fill in the following fields:
* **Source**: The telemetry stream to forward. Streams are predefined categories of CoreWeave telemetry, such as **Console Audit Logs** or **Kubernetes API Audit Logs**.
* **Destination**: An existing destination to receive the stream. The dropdown lists destinations created in the **Destinations** tab.
After you fill in both fields, a read-only **Generated Pipeline Name** field shows the resulting slug, which combines the source and destination names (for example, `logs-audit-console-my-endpoint`). You don't enter a name yourself.
4. Click **Submit**.
The new pipeline appears in the **Pipelines** table. To leave the **Create pipeline** page without saving, click **Back to Pipelines**.
## List destinations
To view destinations in the Cloud Console, navigate to [Telemetry Relay](https://console.coreweave.com/telemetry-relay/pipelines) and select **Destinations**. The table lists each destination's **Name**, **Type**, **Region**, and **Endpoint**.
## List streams
To view available telemetry streams:
1. Navigate to [Telemetry Relay](https://console.coreweave.com/telemetry-relay/pipelines) and select **Create pipeline**.
2. Select **Source** to view the available streams.
Streams appear by display name (for example, **Console Audit Logs**, **Kubernetes API Audit Logs**). These are the same streams the [Telemetry Relay API](/observability/telemetry-forwarding/telemetry-relay-api) exposes through slug identifiers like `logs-audit-console`. To leave the **Create pipeline** page without creating a pipeline, click **Back to Pipelines**.
The **Source** dropdown lists every telemetry stream available to your organization, including streams that are outside the self-service scope. Self-service supports forwarding audit-log streams to HTTPS endpoints. To forward other streams, [contact Support](/support).
 ## List pipelines
Navigate to [Telemetry Relay](https://console.coreweave.com/telemetry-relay/pipelines) in the Cloud Console. The **Pipelines** tab is the default landing view. Each row shows the auto-generated pipeline name, source stream, and destination.
## Advanced configuration
For other destination types and telemetry streams that are not supported through self-service, [contact Support](/support).
Examples of custom capabilities that Support can enable:
* Destinations including CoreWeave AI Object Storage buckets (for logs) and Prometheus Remote Write v1 compatible endpoints (for metrics).
* Forwarding for streams outside the self-service scope, such as Kubernetes events, system journal logs, customer cluster metrics, and platform metrics.
## List pipelines
Navigate to [Telemetry Relay](https://console.coreweave.com/telemetry-relay/pipelines) in the Cloud Console. The **Pipelines** tab is the default landing view. Each row shows the auto-generated pipeline name, source stream, and destination.
## Advanced configuration
For other destination types and telemetry streams that are not supported through self-service, [contact Support](/support).
Examples of custom capabilities that Support can enable:
* Destinations including CoreWeave AI Object Storage buckets (for logs) and Prometheus Remote Write v1 compatible endpoints (for metrics).
* Forwarding for streams outside the self-service scope, such as Kubernetes events, system journal logs, customer cluster metrics, and platform metrics.