> ## Documentation Index
> Fetch the complete documentation index at: https://docs.coreweave.com/llms.txt
> Use this file to discover all available pages before exploring further.
# Self-hosted Prometheus
> Deploy Prometheus in CKS to collect custom application metrics and visualize them in self-hosted Grafana
CoreWeave's observability platform provides infrastructure metrics and logs for your clusters, but it does not collect metrics from your own applications. To collect custom application metrics and visualize them alongside CoreWeave's metrics, you can deploy a self-hosted Prometheus instance in your CKS cluster.
This guide covers:
* Deploying Prometheus in a CKS cluster using Helm
* Adding Prometheus as a data source in your self-hosted Grafana instance
* Configuring Prometheus to scrape custom metrics from your application pods
Customers who self-host Prometheus are responsible for all setup, maintenance, and resource costs associated with hosting. See [CoreWeave Grafana](/observability/managed-grafana) for the fully-managed observability option.
## Prerequisites
* A CKS cluster with at least one CPU Node available for Prometheus
* [`kubectl`](https://kubernetes.io/docs/tasks/tools/) installed and configured for your cluster
* [`helm`](https://helm.sh/docs/intro/install/) installed
* A self-hosted Grafana instance. If you haven't set one up yet, see [Self-hosted Grafana](/observability/self-hosted-grafana) first.
## Deploy Prometheus
Prometheus is available via the `prometheus-community` Helm chart repository. Install it using the `kube-prometheus-stack` chart, which includes Prometheus and the Prometheus Operator.
This tutorial uses ephemeral storage. Prometheus stores its metrics in an `emptyDir` volume, so collected history is lost when the Prometheus Pod is deleted or replaced. For a durable deployment, configure persistent storage with `prometheus.prometheusSpec.storageSpec` before installing the chart.
1. Add the `prometheus-community` Helm chart repository:
```bash theme={"system"}
helm repo add prometheus-community https://prometheus-community.github.io/helm-charts
helm repo update
```
2. Create a values file named `prometheus-values.yaml` with the following content:
```yaml title="prometheus-values.yaml" theme={"system"}
grafana:
enabled: false
alertmanager:
enabled: false
nodeExporter:
enabled: false
kubeStateMetrics:
enabled: false
defaultRules:
create: false
```
These settings disable components that this tutorial does not use:
* `grafana.enabled: false` skips the bundled Grafana instance because you use the CoreWeave self-hosted Grafana chart instead.
* `alertmanager.enabled: false` skips Alertmanager.
* `nodeExporter.enabled: false` skips the bundled node exporter. CoreWeave already runs a node exporter on each CKS Node. The bundled exporter cannot bind host port `9100` because that port is already in use.
* `kubeStateMetrics.enabled: false` skips a second copy of kube-state-metrics, which watches Kubernetes API objects. CoreWeave runs kube-state-metrics on the managed control plane, rather than on each Node.
* `defaultRules.create: false` skips the chart's default alerting and recording rules. Those rules include checks for components that this configuration does not deploy or scrape, which can produce firing alerts even when your application metrics are available.
With the bundled collectors disabled, this Prometheus instance does not collect their metrics, such as `kube_pod_info` and `node_cpu_seconds_total`. Imported dashboards that depend on those metrics show no data. Use CoreWeave Grafana for the infrastructure metrics collected by CoreWeave. Kubelet and cAdvisor scraping remain enabled in this configuration.
3. Install Prometheus in a dedicated `monitoring` namespace:
```bash theme={"system"}
helm install prometheus prometheus-community/kube-prometheus-stack \
--namespace monitoring \
--create-namespace \
--values prometheus-values.yaml
```
You should see output similar to the following:
```text theme={"system"}
NAME: prometheus
LAST DEPLOYED: ...
NAMESPACE: monitoring
STATUS: deployed
REVISION: 1
```
## Verify the Prometheus deployment
Run the following command to confirm Prometheus is running:
```bash theme={"system"}
kubectl get pods -n monitoring
```
Wait until both Pods show `Running` and all containers are ready (`1/1` for the Operator and `2/2` for Prometheus). If they are still starting, rerun the command after a short wait.
You should see output similar to the following:
```text theme={"system"}
NAME READY STATUS RESTARTS AGE
prometheus-kube-prometheus-operator-6d4f9c8b9d-xxxx 1/1 Running 0 2m
prometheus-prometheus-kube-prometheus-prometheus-0 2/2 Running 0 90s
```
To confirm the Prometheus service is available, run:
```bash theme={"system"}
kubectl get svc -n monitoring
```
Copy the name of the Prometheus Service that exposes port `9090` from the command output. Use this exact name for `[PROMETHEUS-SERVICE]` in the URL and port-forward command below. The chart can truncate generated names, so do not infer the Service name from the Helm release name.
## Add Prometheus as a data source in Grafana
To query your custom application metrics from Grafana, add Prometheus as a data source.
1. Open your self-hosted Grafana instance and log in. If you need to access it, first find the namespace of its Service:
```bash theme={"system"}
kubectl get svc --all-namespaces --field-selector metadata.name=grafana
```
Copy the value in the `NAMESPACE` column for your Grafana instance. Then run the following port-forward command, replacing `[GRAFANA-NAMESPACE]` with that value:
```bash theme={"system"}
kubectl port-forward svc/grafana -n [GRAFANA-NAMESPACE] 8900:80
```
2. In the Grafana left-hand menu, navigate to **Connections** > **Data sources**, then click **+ Add new data source**.
3. Select **Prometheus** from the list of available data sources.
4. In the **Connection** section, set the **Prometheus server URL** to the Prometheus service address. If Grafana and Prometheus are deployed in different namespaces, use the fully qualified service URL. Replace `[PROMETHEUS-SERVICE]` with the Service name you copied in [Verify the Prometheus deployment](#verify-the-prometheus-deployment). Replace `[PROMETHEUS-NAMESPACE]` with `monitoring`, the namespace specified in the Helm install command. This is the Prometheus namespace, which can differ from `[GRAFANA-NAMESPACE]`:
```text theme={"system"}
http://[PROMETHEUS-SERVICE].[PROMETHEUS-NAMESPACE].svc.cluster.local:9090
```
For example, the Service `prometheus-kube-prometheus-prometheus` in the `monitoring` namespace has the URL `http://prometheus-kube-prometheus-prometheus.monitoring.svc.cluster.local:9090`.
5. Leave the remaining settings at their defaults, including **Authentication method** set to **No Authentication**. This tutorial connects to the in-cluster Prometheus Service without authentication or TLS.
6. Scroll to the bottom of the page and click **Save & test**. You should see a confirmation that the data source is working.
## Configure Prometheus to scrape custom metrics
Prometheus Operator uses `ServiceMonitor` resources to configure which services to scrape. Create a `ServiceMonitor` that targets your application.
### Expose metrics from your application
Your application must expose a Prometheus-compatible metrics endpoint, typically at `/metrics` on a designated port. Many frameworks provide this out of the box, including:
* Python: [`prometheus_client`](https://github.com/prometheus/client_python)
* Go: [`prometheus/client_golang`](https://github.com/prometheus/client_golang)
* Java: [Micrometer](https://micrometer.io/)
For example, a Python application using `prometheus_client` might expose metrics at port `8000`:
```python theme={"system"}
from prometheus_client import start_http_server, Counter
REQUEST_COUNT = Counter('app_requests_total', 'Total number of requests')
start_http_server(8000)
```
Integrate this snippet into your running application. It is not a standalone server script. The metrics server runs in a background thread, so your application must keep running to serve `/metrics`. Call `REQUEST_COUNT.inc()` in your application's request handler once per request you want to count. Creating the counter alone does not increment it.
### Create a Service for your application
Create a Kubernetes Service that exposes the metrics port with a named port. Prometheus uses the port name to identify which port to scrape. This example assumes your application is already deployed in the cluster, its Pods have the label `app: my-app`, and its metrics endpoint listens on port `8000`. Adjust `spec.selector` and `targetPort` to match your application.
```yaml title="app-service.yaml" theme={"system"}
apiVersion: v1
kind: Service
metadata:
name: my-app
namespace: [APP-NAMESPACE]
labels:
app: my-app
spec:
selector:
app: my-app
ports:
- name: metrics
port: 8000
targetPort: 8000
```
Replace `[APP-NAMESPACE]` with your application's namespace.
Apply the Service:
```bash theme={"system"}
kubectl apply -f app-service.yaml
```
### Create a ServiceMonitor
Create a `ServiceMonitor` resource that tells Prometheus to scrape the Service you just created:
```yaml title="app-servicemonitor.yaml" theme={"system"}
apiVersion: monitoring.coreos.com/v1
kind: ServiceMonitor
metadata:
name: my-app
namespace: monitoring
labels:
release: prometheus
spec:
namespaceSelector:
matchNames:
- [APP-NAMESPACE]
selector:
matchLabels:
app: my-app
endpoints:
- port: metrics
interval: 30s
```
Replace `[APP-NAMESPACE]` with your application's namespace.
The `release: prometheus` label on the `ServiceMonitor` must match the Helm release name used when installing `kube-prometheus-stack`. If you used a different release name, update this label accordingly.
Apply the `ServiceMonitor`:
```bash theme={"system"}
kubectl apply -f app-servicemonitor.yaml
```
### Verify Prometheus is scraping your application
To confirm Prometheus is scraping your application, port-forward to the Prometheus Service. Replace `[PROMETHEUS-SERVICE]` with the name you copied in [Verify the Prometheus deployment](#verify-the-prometheus-deployment) and `[PROMETHEUS-NAMESPACE]` with `monitoring`:
```bash theme={"system"}
kubectl port-forward svc/[PROMETHEUS-SERVICE] -n [PROMETHEUS-NAMESPACE] 9090:9090
```
Open `http://localhost:9090/targets` in your browser. Allow time for Prometheus to discover the ServiceMonitor and complete its first scrape. The configuration above scrapes every 30 seconds. Refresh the page until your application appears in the list of scrape targets with a status of **UP**.
These custom metrics appear only in your self-hosted Prometheus and Grafana. CoreWeave's managed observability collects infrastructure metrics and does not surface your application metrics in CoreWeave Grafana.
## Query custom metrics in Grafana
With Prometheus configured as a data source in Grafana, you can now query your custom metrics.
1. In Grafana, navigate to **Explore** from the left-hand menu.
2. Select your data source, such as **prometheus**, from the dropdown at the top of the page.
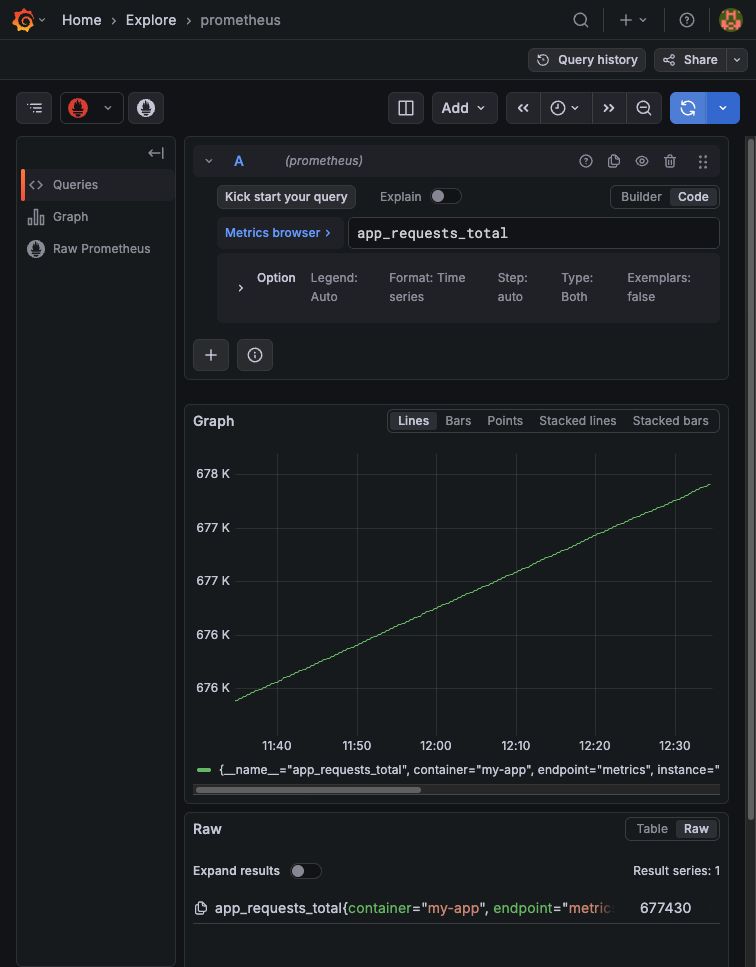
3. Select **Code** to enter a PromQL query using one of your application's metric names. For example:
```text theme={"system"}
app_requests_total
```
4. Click **Run query**. Your custom metric data should appear in the query results. If you see **No data**, confirm that the target is **UP**, allow time for a scrape, and run the query again. The counter increases only when your application increments it.
The following image shows `app_requests_total` in Grafana Explore for a sample application that increments the counter. Your values depend on your application's activity.
 You can build dashboards with your custom metrics by navigating to **Dashboards** > **New** > **New dashboard** and adding panels that reference your Prometheus data source.
## Learn more
* [Prometheus documentation](https://prometheus.io/docs/) on configuring scraping, alerting rules, and PromQL
* [Prometheus Operator documentation](https://prometheus-operator.dev/docs/getting-started/introduction/) on `ServiceMonitor`, `PodMonitor`, and other custom resources
* [Self-hosted Grafana](/observability/self-hosted-grafana) for setup instructions and configuring CoreWeave data sources
* [Forward application metrics](/observability/logs-metrics/forward-metrics) to send CKS metrics to an external Prometheus instance
You can build dashboards with your custom metrics by navigating to **Dashboards** > **New** > **New dashboard** and adding panels that reference your Prometheus data source.
## Learn more
* [Prometheus documentation](https://prometheus.io/docs/) on configuring scraping, alerting rules, and PromQL
* [Prometheus Operator documentation](https://prometheus-operator.dev/docs/getting-started/introduction/) on `ServiceMonitor`, `PodMonitor`, and other custom resources
* [Self-hosted Grafana](/observability/self-hosted-grafana) for setup instructions and configuring CoreWeave data sources
* [Forward application metrics](/observability/logs-metrics/forward-metrics) to send CKS metrics to an external Prometheus instance