> ## Documentation Index
> Fetch the complete documentation index at: https://docs.coreweave.com/llms.txt
> Use this file to discover all available pages before exploring further.
# Self-hosted Grafana
> Setting up a self-hosted Grafana instance inside CKS
This guide shows you how to deploy and configure a self-hosted Grafana instance inside a CoreWeave Kubernetes Service (CKS) cluster. If you need more customization and control than [CoreWeave Grafana](/observability/managed-grafana) provides, you can deploy a self-hosted Grafana instance. With self-hosting, you can create new dashboards, export or edit CoreWeave Grafana dashboards, and freely explore all available metrics in your environment.
[CoreWeave Charts](/products/cks/clusters/coreweave-charts/introduction) deploys self-hosted Grafana instances. This handles most of the process of configuring data sources, but [authentication](#configure-coreweave-metrics-data-source-credentials) requires some manual configuration.
By the end of this guide, you have a running self-hosted Grafana instance connected to CoreWeave Metrics and CoreWeave Logs data sources.
## Prerequisites
To set up a self-hosted Grafana instance, you need the following:
* A [CoreWeave API Access Token](/security/authn-authz/managed-auth/api-access) for an active CKS account.
* A CKS cluster where you intend to self-host (deploy and manage) Grafana.
* [`kubectl`](https://kubernetes.io/docs/tasks/tools/) installed.
* [`helm`](https://helm.sh/docs/intro/install/) installed.
Customers who self-host a Grafana instance are responsible for all setup, maintenance, and resource costs associated with hosting. CoreWeave recommends using [CoreWeave Grafana](/observability/managed-grafana).
## Install Grafana with CoreWeave Charts
This section installs the Grafana Helm chart into your cluster so the application is running and ready to configure.
1. Add the CoreWeave Charts repository:
```bash theme={"system"}
helm repo add coreweave https://charts.core-services.ingress.coreweave.com
```
2. Install the `grafana` chart:
```bash theme={"system"}
helm install -n "[MY-NAMESPACE]" grafana coreweave/grafana
```
The `grafana-dashboards` chart is a dependency of `grafana`, so it does not need to be installed independently.
## Log in to Grafana with admin credentials
With Grafana installed, the next step is to reach the application in your browser and sign in as the administrator so you can finish configuration. Before you log in to Grafana, you must port forward your Grafana service.
1. Port forward your Grafana service:
```bash theme={"system"}
kubectl port-forward svc/grafana -n "[MY-NAMESPACE]" 8900:80
```
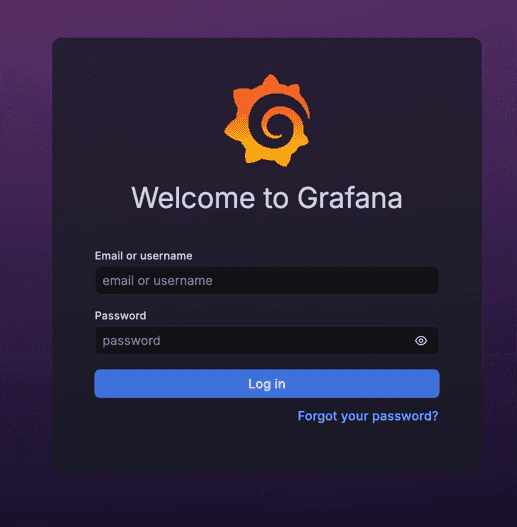
2. Navigate to `localhost:8900`. You see a login page similar to the following:
 3. Obtain the admin password, which is required to log in to Grafana for the first time. This password is stored as a Kubernetes Secret. Retrieve the Secret value, replacing `[MY-NAMESPACE]` with your namespace ID:
```bash theme={"system"}
kubectl get secret grafana -n "[MY-NAMESPACE]" -o=jsonpath='{.data.admin-password}' | base64 --decode
```
Note: If you use a Mac, you might need to remove the trailing `%`.
4. Use the returned value as your password when you log in to Grafana with the following credentials:
| Field | Value |
| -------- | ------------- |
| Username | `admin` |
| Password | `[MY-SECRET]` |
## Configure CoreWeave Metrics data source credentials
After you log in to Grafana with your admin credentials, you must configure credentials for the CoreWeave-provided data sources so Grafana can authenticate to the CoreWeave observability backend. First, configure the CoreWeave Metrics data source.
### Configure the data source HTTP headers
The following HTTP header values are required to connect to CoreWeave's data sources, where `[MY-TOKEN]` is your CoreWeave [API Access Token](/security/authn-authz/managed-auth/api-access).
| Field | Value |
| ------ | ------------------- |
| Header | `Authorization` |
| Value | `Bearer [MY-TOKEN]` |
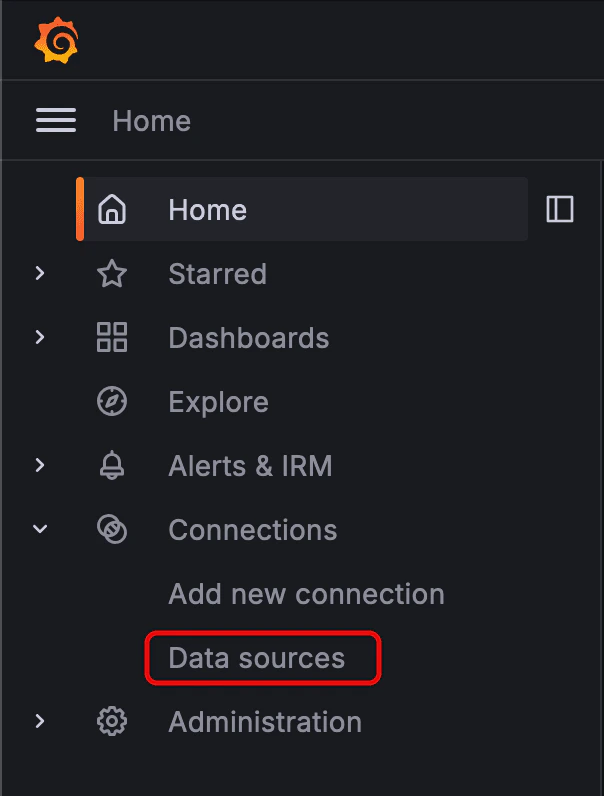
To configure these headers, navigate to **Connections** from Grafana's left-hand menu to display the dropdown options. Then, click **Data sources** to proceed to the **Data sources** page. Select **CoreWeave Metrics** from the options listed to proceed to the **Settings** menu for the new data source.
3. Obtain the admin password, which is required to log in to Grafana for the first time. This password is stored as a Kubernetes Secret. Retrieve the Secret value, replacing `[MY-NAMESPACE]` with your namespace ID:
```bash theme={"system"}
kubectl get secret grafana -n "[MY-NAMESPACE]" -o=jsonpath='{.data.admin-password}' | base64 --decode
```
Note: If you use a Mac, you might need to remove the trailing `%`.
4. Use the returned value as your password when you log in to Grafana with the following credentials:
| Field | Value |
| -------- | ------------- |
| Username | `admin` |
| Password | `[MY-SECRET]` |
## Configure CoreWeave Metrics data source credentials
After you log in to Grafana with your admin credentials, you must configure credentials for the CoreWeave-provided data sources so Grafana can authenticate to the CoreWeave observability backend. First, configure the CoreWeave Metrics data source.
### Configure the data source HTTP headers
The following HTTP header values are required to connect to CoreWeave's data sources, where `[MY-TOKEN]` is your CoreWeave [API Access Token](/security/authn-authz/managed-auth/api-access).
| Field | Value |
| ------ | ------------------- |
| Header | `Authorization` |
| Value | `Bearer [MY-TOKEN]` |
To configure these headers, navigate to **Connections** from Grafana's left-hand menu to display the dropdown options. Then, click **Data sources** to proceed to the **Data sources** page. Select **CoreWeave Metrics** from the options listed to proceed to the **Settings** menu for the new data source.
 Next, navigate to the **Authentication** section. This is the only section that requires editing.
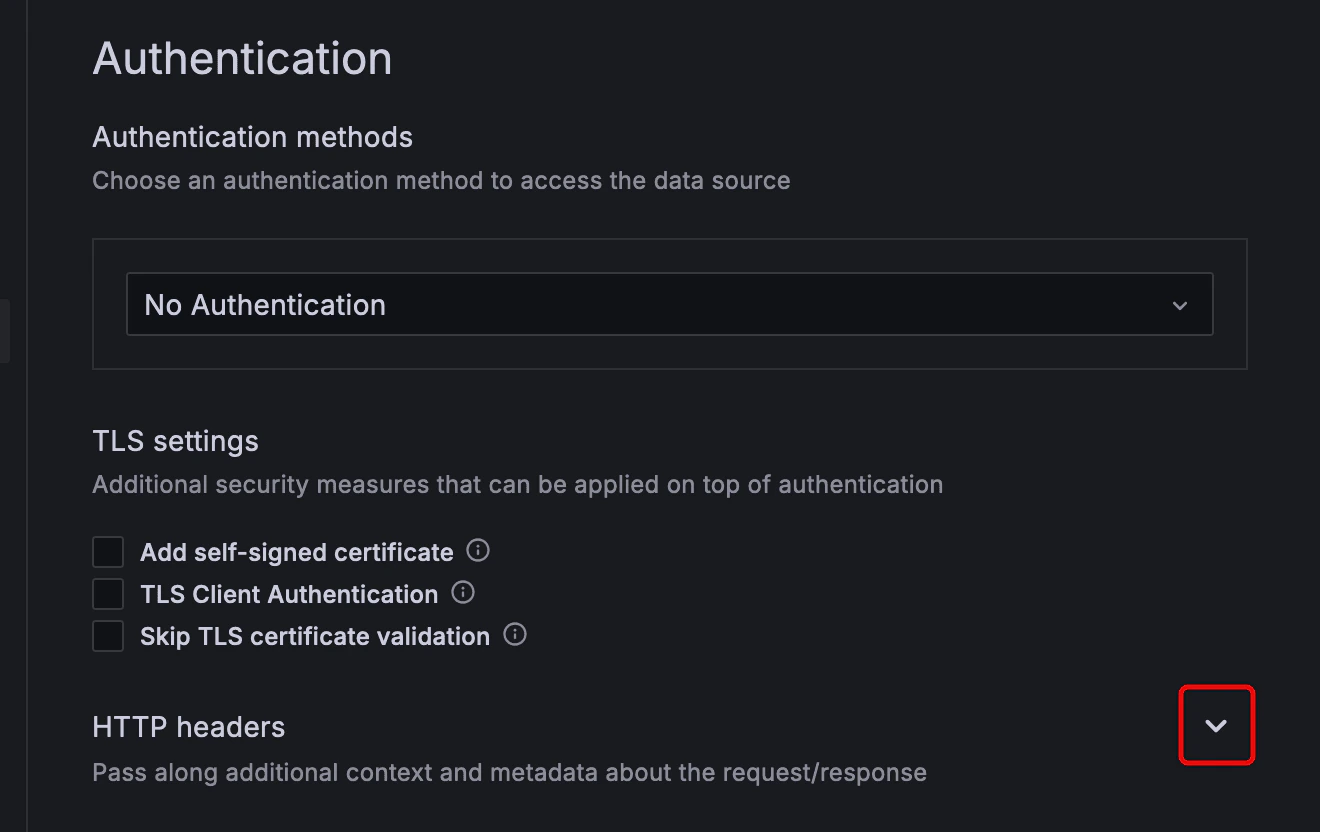 Then, click the dropdown arrow on the right-hand side of the **HTTP headers** subsection to display the **+ Add header** button.
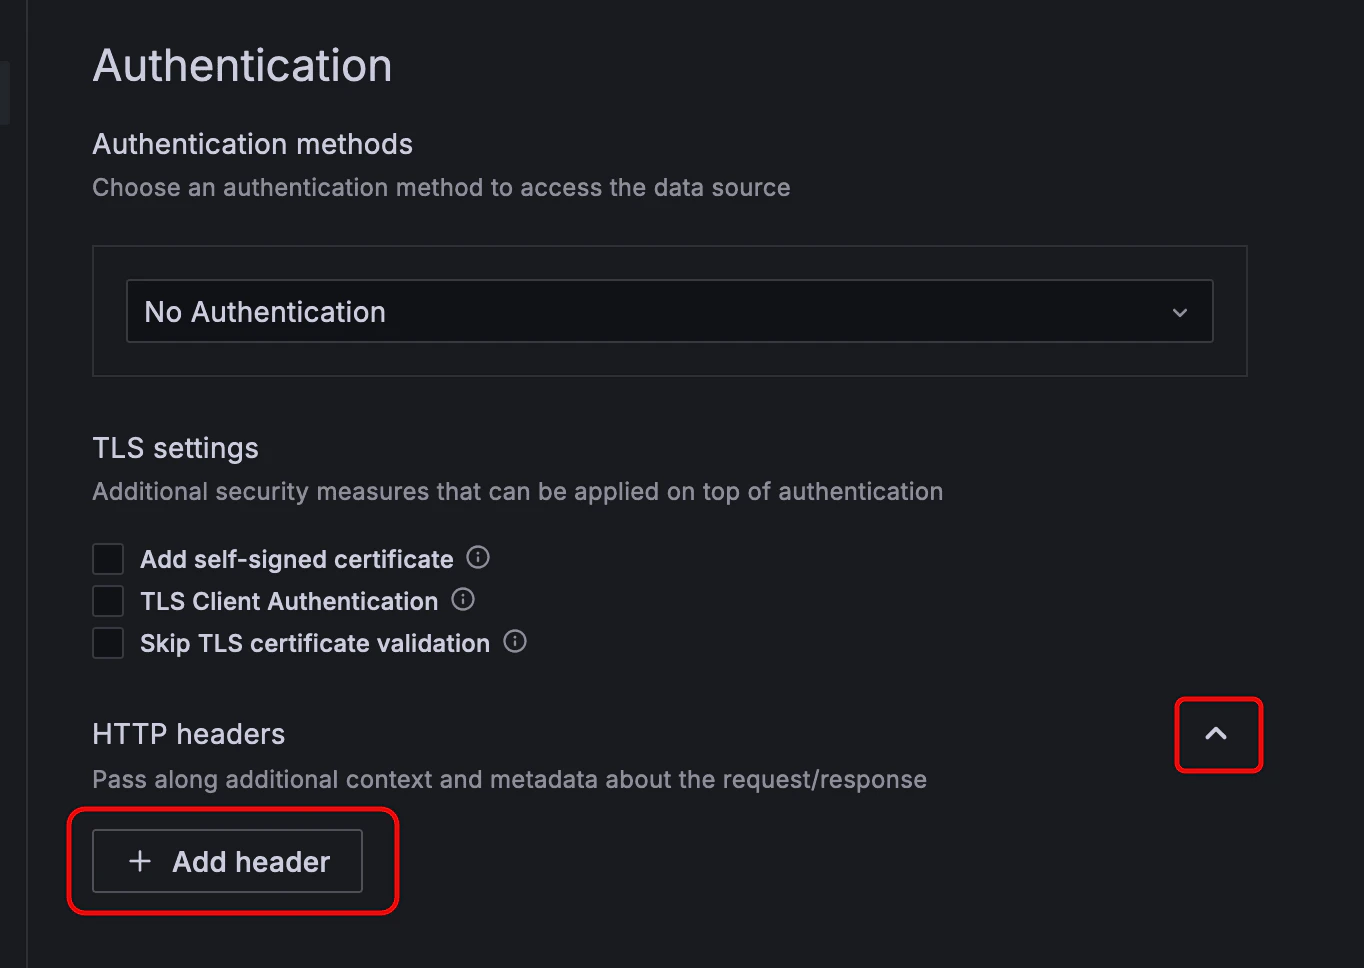 In the **Header** field, enter `Authorization`.
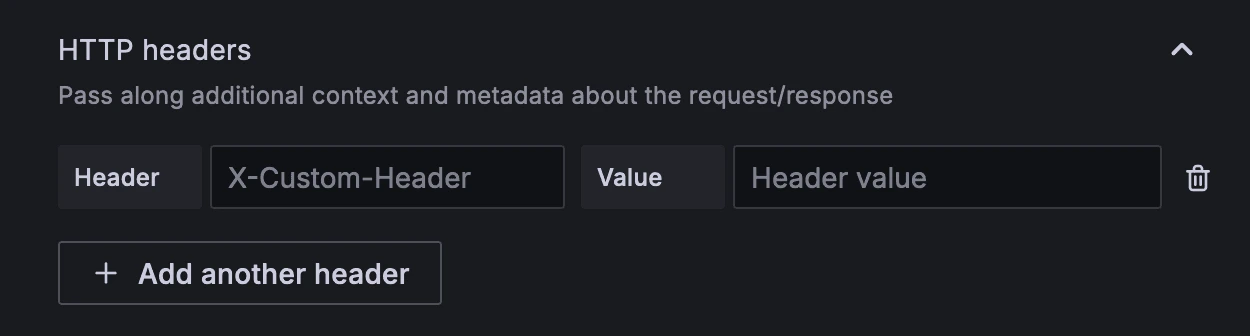 In the **Value** field, provide the value `Bearer [MY-TOKEN]`, where `[MY-TOKEN]` is your CoreWeave [API Access Token](/security/authn-authz/managed-auth/api-access).
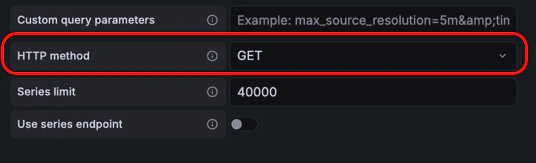
Configure the HTTP method to use `GET` by changing the HTTP dropdown method in the **Other** subsection to `GET`:
In the **Value** field, provide the value `Bearer [MY-TOKEN]`, where `[MY-TOKEN]` is your CoreWeave [API Access Token](/security/authn-authz/managed-auth/api-access).
Configure the HTTP method to use `GET` by changing the HTTP dropdown method in the **Other** subsection to `GET`:
 ## Configure the CoreWeave Logs data source
After the configuration for the **CoreWeave Metrics** data source is complete, repeat the preceding steps for the **CoreWeave Logs** data source. With both data sources configured, your self-hosted Grafana instance can query CoreWeave metrics and logs.
## Learn more
For more information, explore the following resources:
* [Grafana documentation](https://grafana.com/docs/grafana/latest/) for guidance on tasks such as building dashboards, working with data sources, and exploring metrics.
* [Prometheus Query Language (PromQL) documentation](https://prometheus.io/docs/prometheus/latest/querying/basics/) to learn how to query the **CoreWeave Metrics** data in both ad-hoc Explore queries and advanced dashboard panels.
## Configure the CoreWeave Logs data source
After the configuration for the **CoreWeave Metrics** data source is complete, repeat the preceding steps for the **CoreWeave Logs** data source. With both data sources configured, your self-hosted Grafana instance can query CoreWeave metrics and logs.
## Learn more
For more information, explore the following resources:
* [Grafana documentation](https://grafana.com/docs/grafana/latest/) for guidance on tasks such as building dashboards, working with data sources, and exploring metrics.
* [Prometheus Query Language (PromQL) documentation](https://prometheus.io/docs/prometheus/latest/querying/basics/) to learn how to query the **CoreWeave Metrics** data in both ad-hoc Explore queries and advanced dashboard panels.