> ## Documentation Index
> Fetch the complete documentation index at: https://docs.coreweave.com/llms.txt
> Use this file to discover all available pages before exploring further.
# Node Wrangler
> View aggregated Node information across your clusters
The **Node Wrangler** dashboard displays aggregated information about the Nodes in your fleet, helping you monitor fleet-wide health and quickly identify Nodes that need attention. It provides a summary of Node status, power utilization, and SM utilization over time, as well as detailed information about each Node's condition and alerts.
The dashboard is divided into several panel groups, each providing different information about the Nodes in your fleet. You can filter the data displayed in the dashboard by selecting specific data sources, regions, clusters, or organizations.
To view the dashboard, go to the [Node Wrangler dashboard](https://cks-grafana.coreweave.com/d/FWuqvUH4z/node-wrangler).
For instructions about accessing CoreWeave Grafana dashboards, see [Access and use CoreWeave Grafana dashboards](/observability/managed-grafana/access).
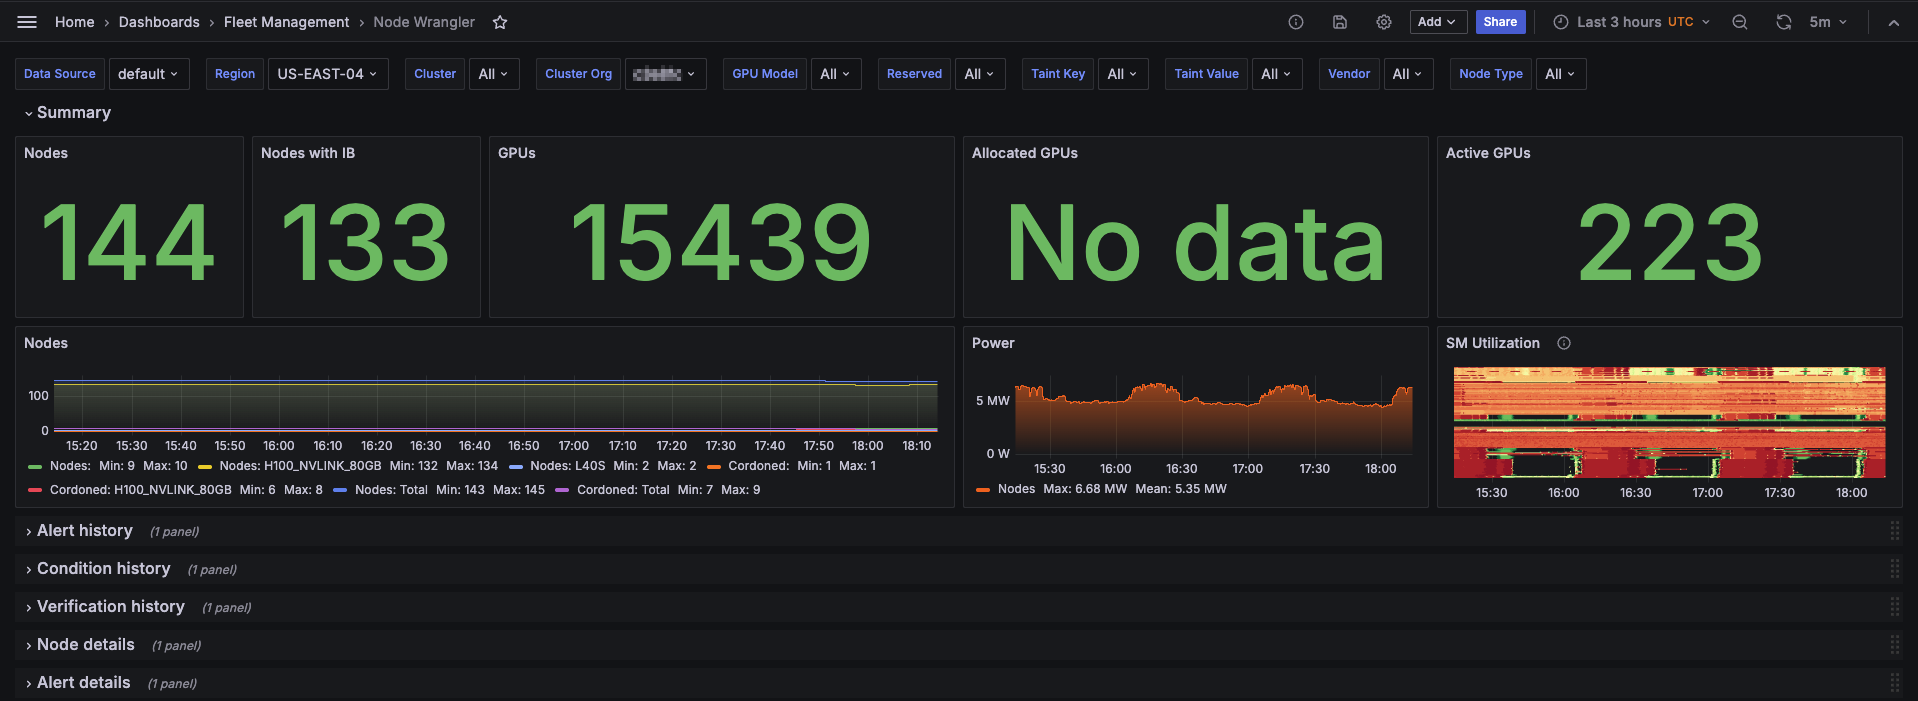
## Example view
When the dashboard first loads, the Summary panel group is expanded by default.
 ## Panel groups
Each panel group focuses on a different aspect of your fleet. Click a group heading to collapse or expand that section.
| Section | What you find |
| ------------------------ | ----------------------------------------------------------------------------------------------------------------------------------------- |
| **Summary** | Overview of Nodes and their status, power utilization and SM utilization over time. |
| **Alert History** | Nodes alert status over the selected time range. |
| **Condition History** | Nodes condition status over the selected time range. |
| **Verification History** | Nodes verification status over the selected time range. |
| **Node Details** | Detailed table of Node information, including uptime, InfiniBand status, IP addresses, serial numbers, and current verification messages. |
| **Alert Details** | Detailed table of current alert information, including state, severity, and Node and Pod information. |
## Panel groups
Each panel group focuses on a different aspect of your fleet. Click a group heading to collapse or expand that section.
| Section | What you find |
| ------------------------ | ----------------------------------------------------------------------------------------------------------------------------------------- |
| **Summary** | Overview of Nodes and their status, power utilization and SM utilization over time. |
| **Alert History** | Nodes alert status over the selected time range. |
| **Condition History** | Nodes condition status over the selected time range. |
| **Verification History** | Nodes verification status over the selected time range. |
| **Node Details** | Detailed table of Node information, including uptime, InfiniBand status, IP addresses, serial numbers, and current verification messages. |
| **Alert Details** | Detailed table of current alert information, including state, severity, and Node and Pod information. |