> ## Documentation Index
> Fetch the complete documentation index at: https://docs.coreweave.com/llms.txt
> Use this file to discover all available pages before exploring further.
# Cabinet Wrangler
> Grafana dashboard for monitoring cabinet details, GPU data, and Node information across racks
To view the dashboard, go to the [Cabinet Wrangler dashboard](https://cks-grafana.coreweave.com/d/ceif6c5udzytca/cabinet-wrangler).
For instructions about accessing CoreWeave Grafana dashboards, see [Access and use CoreWeave Grafana dashboards](/observability/managed-grafana/access).
The Cabinet Wrangler dashboard provides an overview of cabinet details and status, including GPU data and Node information across racks.
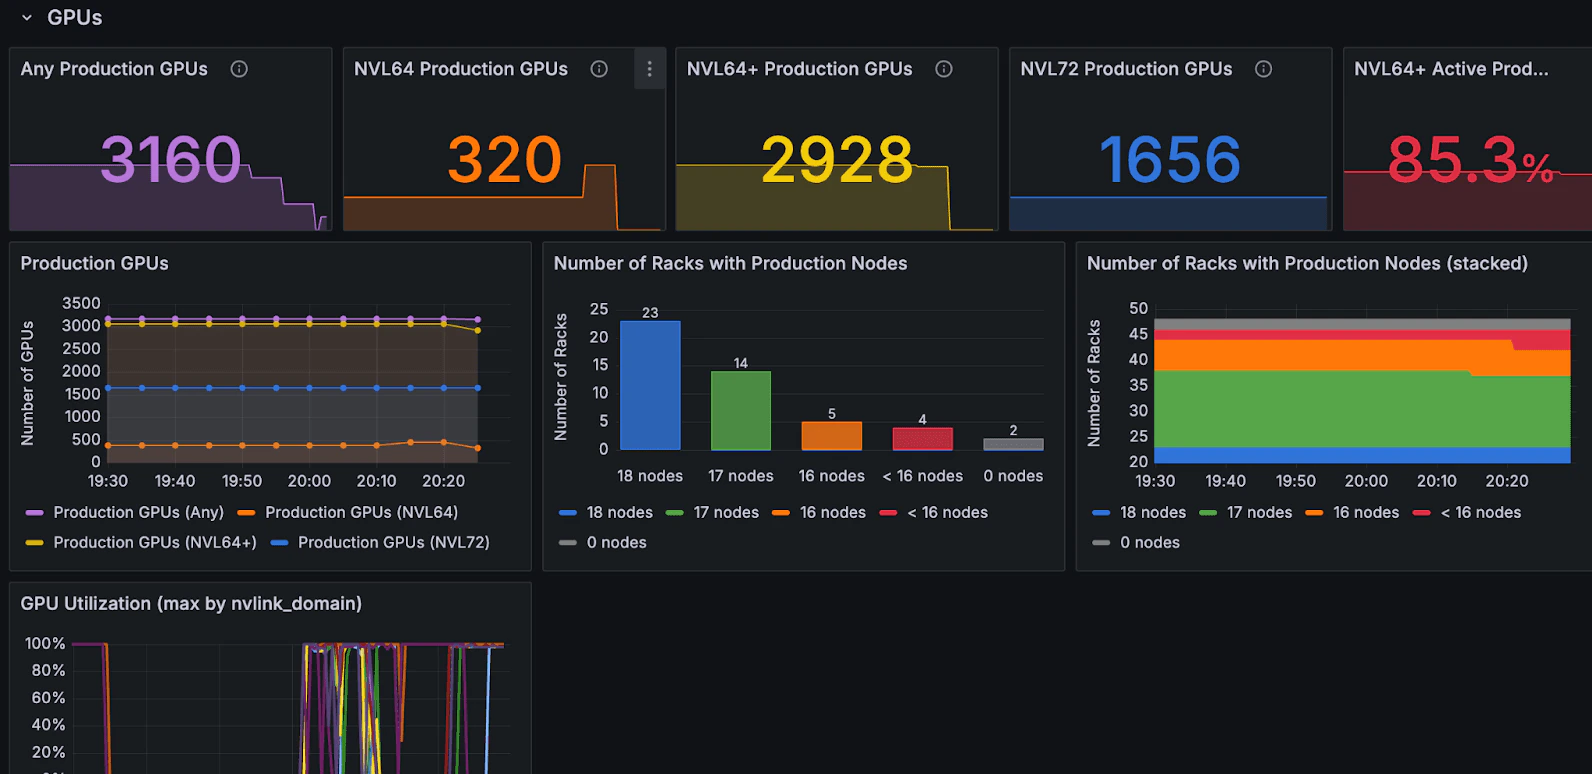 The dashboard contains the following panels.
| Panel | Description |
| ----------------------------------------------------- | ----------------------------------------------------------------------------------------------------------------------------------------------------------------- |
| **Any Production GPUs** | Total count of nodes in racks with any number of healthy nodes. |
| **NVL64 Production GPUs** | Baseline count of nodes based on the number of racks with at least 16 healthy nodes (Rack Count \* Threshold (16)). |
| **NVL64+ Production GPUs** | Total count of nodes in racks with at least 16 healthy nodes. |
| **NVL72 Production GPUs** | Total count of nodes in racks with 18 healthy nodes. |
| **NVL64+ Active Production Percentage** | Percentage of active production GPUs of type NVL64 or higher. |
| **Production GPUs** | Distribution of the classes of Production GPUs. |
| **Number of Racks with Production Schedulable Nodes** | Number of racks with schedulable Nodes for production workloads. |
| **Number of Racks with Production Nodes (stacked)** | Stacked chart of the data in the **Number of Racks with Production Nodes** panel. |
| **GPU Utilization (max by `rack_name`)** | Time-series graph of maximum GPU utilization aggregated by rack name. |
| **Cabinet Details** | Detailed table with **Summary** and **NLCC State Counts** tabs. Shows metrics such as rack name, Active status, Health rollup, and Kubernetes schedulable status. |
| **Node Messages** | Messages or logs related to the system's Nodes. |
The dashboard contains the following panels.
| Panel | Description |
| ----------------------------------------------------- | ----------------------------------------------------------------------------------------------------------------------------------------------------------------- |
| **Any Production GPUs** | Total count of nodes in racks with any number of healthy nodes. |
| **NVL64 Production GPUs** | Baseline count of nodes based on the number of racks with at least 16 healthy nodes (Rack Count \* Threshold (16)). |
| **NVL64+ Production GPUs** | Total count of nodes in racks with at least 16 healthy nodes. |
| **NVL72 Production GPUs** | Total count of nodes in racks with 18 healthy nodes. |
| **NVL64+ Active Production Percentage** | Percentage of active production GPUs of type NVL64 or higher. |
| **Production GPUs** | Distribution of the classes of Production GPUs. |
| **Number of Racks with Production Schedulable Nodes** | Number of racks with schedulable Nodes for production workloads. |
| **Number of Racks with Production Nodes (stacked)** | Stacked chart of the data in the **Number of Racks with Production Nodes** panel. |
| **GPU Utilization (max by `rack_name`)** | Time-series graph of maximum GPU utilization aggregated by rack name. |
| **Cabinet Details** | Detailed table with **Summary** and **NLCC State Counts** tabs. Shows metrics such as rack name, Active status, Health rollup, and Kubernetes schedulable status. |
| **Node Messages** | Messages or logs related to the system's Nodes. |