> ## Documentation Index
> Fetch the complete documentation index at: https://docs.coreweave.com/llms.txt
> Use this file to discover all available pages before exploring further.
# Inference Model Overview
> Grafana dashboard for monitoring Dedicated Inference request rates, queueing, runtime latency, and scaling
The **Inference Model Overview** dashboard provides metrics for [Dedicated Inference](/products/inference/dedicated) deployments. Use it to track request throughput and success rate, diagnose queueing and load balancing behavior, inspect inference runtime latency, and confirm that autoscaling responds to load. The dashboard covers only Dedicated Inference. It doesn't include Serverless Inference or Inference on CKS workloads.
To view the dashboard, go to the [Inference Model Overview dashboard](https://cks-grafana.coreweave.com/d/dep76910f3im8h/inference-model-overview). In Grafana, it's in the **Inference** folder.
For instructions about accessing CoreWeave Grafana dashboards, see [Access and use CoreWeave Grafana dashboards](/observability/managed-grafana/access).
To see data in this dashboard, you need the **Observability Viewer** role in an [IAM access policy](/security/iam/access-policies/roles#observability-and-telemetry). For the step-by-step procedure to open the dashboard and read your deployment logs, go to [Observability](/products/inference/getting-started#observability) in the Dedicated Inference getting started guide.
## Dashboard variables
To choose the deployment you want to inspect, set the variables at the top of the dashboard. Most panels follow the **Deployment** selection. For the exceptions, see [Overview](#overview).
| Variable | Description |
| - | - |
| **Metric Source** | Selects the data source that supplies the dashboard metrics. |
| **Log Source** | Selects the data source that the **vLLM Logs** link opens in **Explore**. |
| **Cluster Org** | Shows your organization ID. CoreWeave fills it in and limits it to your own organization, so you don't need to change it. |
| **Zone** | Selects the Availability Zone that serves the deployment. |
| **Gateway** | Selects the inference gateway. |
| **Model** | Selects the model. |
| **Deployment** | Selects the deployment. Panels in the **Per Pod** row break this deployment out by Pod. |
| **hist\_interval** | Sets the time window that the **Model Success Rate**, **Request Duration**, **Completed Request Rate**, **First Response Duration**, and **Cache Hit** panels, and every panel in the **VLLM** row, use to calculate rates and percentiles. Options range from `1m` to `24h`. |
The dashboard also provides a **vLLM Logs** link that opens **Explore** with a log query already scoped to your current **Deployment** selection.
## Panel rows
The dashboard groups its panels into five rows. The following sections describe each row.
### Overview
These panels summarize the health and throughput of the selected deployment. Start here to determine whether the deployment is serving traffic successfully.
The **RPS**, **Model Success Rate**, **Request Duration**, **Completed Request Rate**, and **First Response Duration** panels measure requests at the gateway and filter by **Model**, **Gateway**, and **Zone** only. If more than one deployment serves the selected model through the selected gateway, these panels include all of them.
| Panel | Description |
| - | - |
| **RPS** | Shows the request rate in requests per second. |
| **Model Success Rate** | Shows the model success rate, calculated as 1 minus the 5xx error rate over the **hist\_interval** window. |
| **Instances Active** | Shows the percentage of replicas with at least one request running. |
| **Output Tok/s** | Shows output tokens per second across all Pods of the selected deployment. |
| **AVG Cache Usage** | Shows average KV cache usage. |
| **Request Duration** | Shows P90 and P50 request duration, broken down by response status. |
| **Completed Request Rate** | Shows the rate of completed requests, broken down by status code. |
| **Running Requests** | Shows the requests currently running, as the delta between requests received and completed. |
| **First Response Duration** | Shows P90 and P50 time to first response. Requests that never return a response aren't tracked here. |
### Queue & Load Balancing
These panels show how requests move through the queue before a backend accepts them. Use them to distinguish a capacity shortfall from a load balancing failure.
| Panel | Description |
| - | - |
| **Queue Success Rate** | Shows the success rate of queue processing. |
| **Expired Requests (rate)** | Shows the rate of requests that expired while waiting for capacity. |
| **Failed Requests (rate)** | Shows the rate of requests that failed load balancer selection. |
| **Cancelled Requests (rate)** | Shows the rate of requests that were canceled. |
| **Enqueue vs Completion Rates** | Compares the rate of enqueued requests against the rate of completions by result type. |
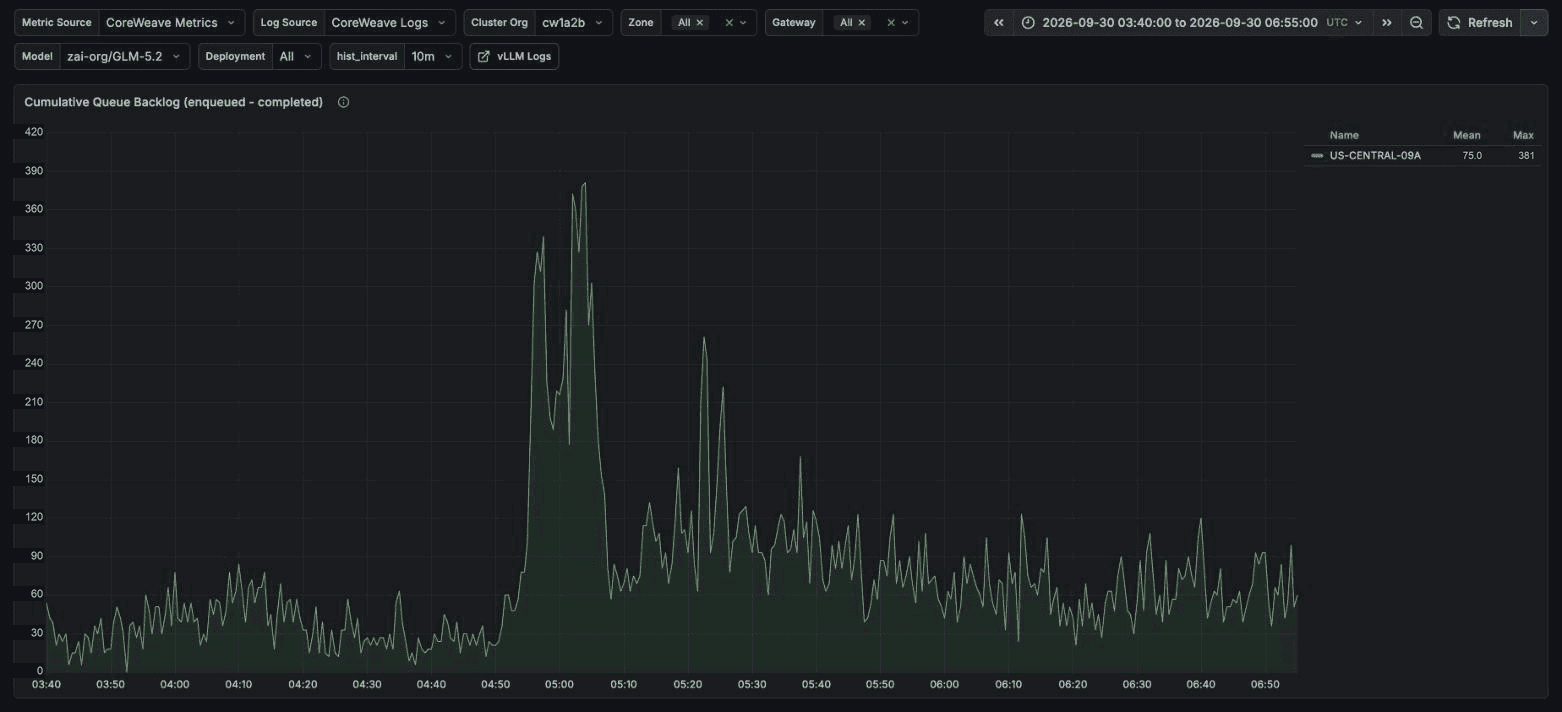
| **Cumulative Queue Backlog** | Shows the number of requests currently waiting in the queue, by zone. |
 ### VLLM
These panels report metrics published by the vLLM inference runtime. They break request latency into its runtime stages and report token counts per request, so you can find which stage dominates end-to-end latency.
| Panel | Description |
| - | - |
| **Request Queue Time** | Shows P90 and P75 time that requests spend waiting in the vLLM engine's queue before processing starts. |
| **Prefill Time** | Shows P90 and P75 prefill time. |
| **Decode Time** | Shows P90 and P75 decode time. |
| **E2E Latency** | Shows P90 and P75 end-to-end latency. |
| **TTFT** | Shows P90 and P75 time to first token. |
| **TPOT** | Shows P90 and P75 time per output token. |
| **Prompt Tokens** | Shows P90 and P75 prompt tokens per request. |
| **Requested generation tokens** | Shows P90 and P75 of the maximum generation tokens requested per request. |
| **Speculative Decoding** | Shows the **Acceptance Rate** and **Mean Acceptance Length** series for deployments that use speculative decoding. |
### Scaling
These panels show how the deployment's replica count responds to load. You can read them alongside [Scaling](/products/inference/scaling), which describes the autoscaling behavior they reflect.
| Panel | Description |
| - | - |
| **Replicas** | Shows the current and ready replica counts against the configured minimum and maximum. |
| **Instances Active (Count)** | Shows the number of replicas with at least one request running. |
| **Instances Active (Percent)** | Shows the percentage of replicas with at least one request running. |
### VLLM
These panels report metrics published by the vLLM inference runtime. They break request latency into its runtime stages and report token counts per request, so you can find which stage dominates end-to-end latency.
| Panel | Description |
| - | - |
| **Request Queue Time** | Shows P90 and P75 time that requests spend waiting in the vLLM engine's queue before processing starts. |
| **Prefill Time** | Shows P90 and P75 prefill time. |
| **Decode Time** | Shows P90 and P75 decode time. |
| **E2E Latency** | Shows P90 and P75 end-to-end latency. |
| **TTFT** | Shows P90 and P75 time to first token. |
| **TPOT** | Shows P90 and P75 time per output token. |
| **Prompt Tokens** | Shows P90 and P75 prompt tokens per request. |
| **Requested generation tokens** | Shows P90 and P75 of the maximum generation tokens requested per request. |
| **Speculative Decoding** | Shows the **Acceptance Rate** and **Mean Acceptance Length** series for deployments that use speculative decoding. |
### Scaling
These panels show how the deployment's replica count responds to load. You can read them alongside [Scaling](/products/inference/scaling), which describes the autoscaling behavior they reflect.
| Panel | Description |
| - | - |
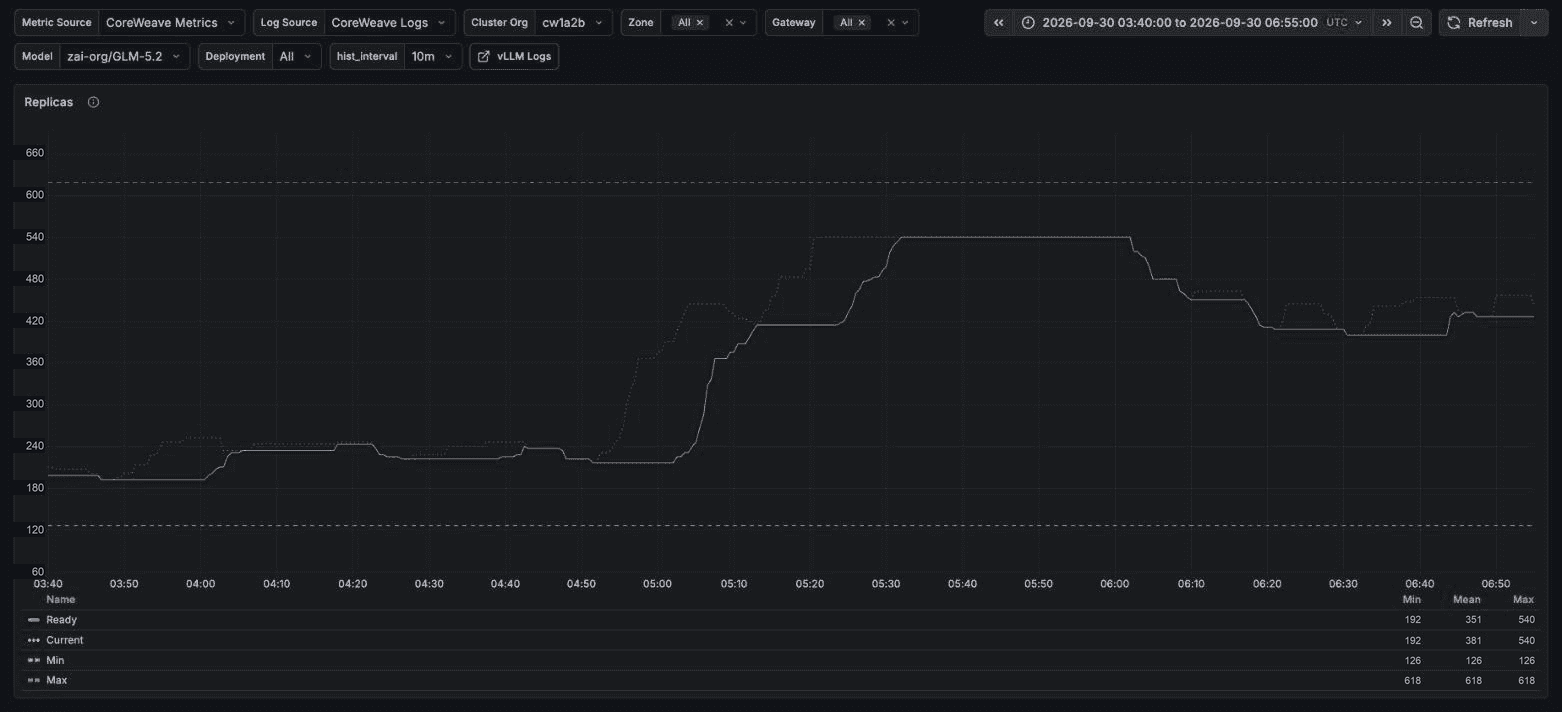
| **Replicas** | Shows the current and ready replica counts against the configured minimum and maximum. |
| **Instances Active (Count)** | Shows the number of replicas with at least one request running. |
| **Instances Active (Percent)** | Shows the percentage of replicas with at least one request running. |
 ### Per Pod
Each replica of a deployment runs as one or more Kubernetes Pods. These panels break the selected deployment out by Pod, so you can distinguish an evenly loaded deployment from one where a single Pod is saturated.
| Panel | Description |
| - | - |
| **Requests Running per Pod** | Shows the requests currently running in each backend Pod, as reported by the runtime, with a Pod average. |
| **Requests Waiting by Pod** | Shows the requests waiting in the backend for each Pod, with a Pod average and a fixed **Scaling Threshold** reference line. The autoscaler doesn't scale on this per-Pod count. |
| **Request StdDev** | Shows the standard deviation of running requests across Pods. |
| **Request Waiting StdDev** | Shows the standard deviation of waiting requests across Pods. |
| **Cache Usage** | Shows average and maximum KV cache usage for each Pod. |
| **Cache Hit** | Shows the average prefix cache hit percentage for each Pod over the **hist\_interval** window. |
| **GPU Utilization** | Shows the maximum GPU utilization across all GPUs in each Pod, with a Pod average. |
| **GPU Memory Utilization** | Shows the maximum GPU memory utilization across all GPUs in each Pod, with a Pod average. |
The **Per Pod** panels cover only the Pods belonging to your own deployments. The dashboard doesn't include Node-level metrics or a Pod-to-Node mapping.
## See also
* [Dedicated Inference](/products/inference/dedicated): Learn about deployments, gateways, and the observability role requirement.
* [Scaling](/products/inference/scaling): Configure the autoscaling behavior shown in the **Scaling** row.
* [Speculative decoding](/products/inference/speculative-decoding): Configure the feature measured by the **Speculative Decoding** panel.
### Per Pod
Each replica of a deployment runs as one or more Kubernetes Pods. These panels break the selected deployment out by Pod, so you can distinguish an evenly loaded deployment from one where a single Pod is saturated.
| Panel | Description |
| - | - |
| **Requests Running per Pod** | Shows the requests currently running in each backend Pod, as reported by the runtime, with a Pod average. |
| **Requests Waiting by Pod** | Shows the requests waiting in the backend for each Pod, with a Pod average and a fixed **Scaling Threshold** reference line. The autoscaler doesn't scale on this per-Pod count. |
| **Request StdDev** | Shows the standard deviation of running requests across Pods. |
| **Request Waiting StdDev** | Shows the standard deviation of waiting requests across Pods. |
| **Cache Usage** | Shows average and maximum KV cache usage for each Pod. |
| **Cache Hit** | Shows the average prefix cache hit percentage for each Pod over the **hist\_interval** window. |
| **GPU Utilization** | Shows the maximum GPU utilization across all GPUs in each Pod, with a Pod average. |
| **GPU Memory Utilization** | Shows the maximum GPU memory utilization across all GPUs in each Pod, with a Pod average. |
The **Per Pod** panels cover only the Pods belonging to your own deployments. The dashboard doesn't include Node-level metrics or a Pod-to-Node mapping.
## See also
* [Dedicated Inference](/products/inference/dedicated): Learn about deployments, gateways, and the observability role requirement.
* [Scaling](/products/inference/scaling): Configure the autoscaling behavior shown in the **Scaling** row.
* [Speculative decoding](/products/inference/speculative-decoding): Configure the feature measured by the **Speculative Decoding** panel.