> ## Documentation Index
> Fetch the complete documentation index at: https://docs.coreweave.com/llms.txt
> Use this file to discover all available pages before exploring further.
# Create a custom dashboard
> Build and save a dashboard that shows CPU and memory usage for one Pod
Custom dashboards in CoreWeave Grafana are in preview.
This tutorial shows how to create and save a custom dashboard in CoreWeave Grafana. The example dashboard tracks CPU and memory usage for one Pod on CoreWeave Kubernetes Service (CKS).
You build a **My workload** dashboard with two time-series panels using an existing Pod's metrics. You then save the dashboard in your organization's root folder and reopen it to verify that the configuration persists.
## Prerequisites
Before you begin, you need the following:
* Access to [CoreWeave Grafana](/observability/managed-grafana/access).
* The **Administrator** or **User** policy, which grants read and write access to your organization's custom dashboards and includes access to metrics. If your organization uses custom policies, have an administrator assign the **Grafana Dashboard Viewer**, **Grafana Dashboard Editor**, and **Observability Viewer** roles. See [Observability and telemetry roles](/security/iam/access-policies/roles#observability-and-telemetry).
* A running Pod on a CKS cluster.
## Find your Pod's metrics
Confirm that Grafana has CPU and memory data for your Pod, and record the values that the queries use:
1. In CoreWeave Grafana, open the [Pod Inspector dashboard](https://cks-grafana.coreweave.com/d/G8-j827Mk/pod-inspector), in the **CoreWeave Kubernetes Service** folder. For a description of its panels, see [Pod Inspector](/observability/managed-grafana/cks/pod-inspector).
2. In the time picker, select **Last 1 hour**. Then select your Pod's **cluster**, **namespace**, and **Pod Name**.
3. Confirm that the **CPU Usage (Cores)** and **Memory: RSS vs WSS vs Usage** panels display data.
4. Record the selected **Data Source**, and the cluster, namespace, and Pod name values.
## Create the dashboard
Start with a dashboard in your organization's root folder:
1. In CoreWeave Grafana, open **Dashboards** and select your organization's root folder.
2. In the folder, select **New** > **New dashboard**, then **Add visualization**.
3. Select the data source that you recorded in Pod Inspector.
4. In the time picker above the panel, select **Last 1 hour**.
Grafana opens the panel editor, where you enter a query and choose how to display its results.
## Add CPU usage
CPU usage in cores shows how much processor time the Pod consumes. A value of 0.1 represents one-tenth of a CPU core.
1. In the panel's query editor, confirm that **Code** is selected, and enter the following PromQL query. Replace `[CLUSTER]`, `[NAMESPACE]`, and `[POD]` with the values that you recorded.
```promql theme={"system"}
sum(
rate(container_cpu_usage_seconds_total{
cluster="[CLUSTER]",
namespace="[NAMESPACE]",
pod="[POD]",
container!="",
container!="POD"
}[$__rate_interval])
)
```
The query calculates the rate of CPU time consumed by each container and adds the results for the Pod.
2. Expand the query **Options**. Confirm that **Type** is set to **Range**, then set **Legend** to **Custom** and replace the prefilled text with `CPU cores`.
3. Select **Run queries** and confirm that the query returns data.
4. Select the **Time series** visualization and set **Title** to `CPU usage (cores)`.
5. Select **Back to dashboard** to return with the panel changes applied.
The dashboard now has a CPU usage panel.
## Add memory usage
Resident set size (RSS) measures resident memory in bytes. This panel shows RSS, rather than a percentage of a memory limit.
1. Select **Add** > **Visualization**. The new panel uses the same data source as the CPU panel.
2. Confirm that **Code** is selected, and enter the following query, replacing the placeholders with the same values:
```promql theme={"system"}
sum(container_memory_rss{
cluster="[CLUSTER]",
namespace="[NAMESPACE]",
pod="[POD]",
container!="",
container!="POD"
})
```
3. Expand the query **Options**. Confirm that **Type** is set to **Range**, then set **Legend** to **Custom** and replace the prefilled text with `Memory RSS`.
4. Select **Run queries** and confirm that the query returns data.
5. Select **Time series** and set **Title** to `Memory usage (RSS)`.
6. Under **Standard options**, set **Unit** to **Data** > **bytes(IEC)** and set **Min** to `0`.
7. Select **Back to dashboard**. Grafana places the new panel above the CPU panel. Drag the **CPU usage (cores)** panel by its title to the right of the memory panel.
Both panels now show resource usage for the same Pod and time range.
## Save and reopen the dashboard
Save the dashboard and verify its configuration:
1. Select **Save dashboard** and enter `My workload` as the title.
2. Confirm that **Folder** is set to your organization's root folder, then select **Save**.
3. Return to **Dashboards**, open that folder, and select **My workload**.
4. Confirm that both panels retain their titles, legends, and queries and display data for the last hour.
The following image shows the completed dashboard with both panels displaying data:
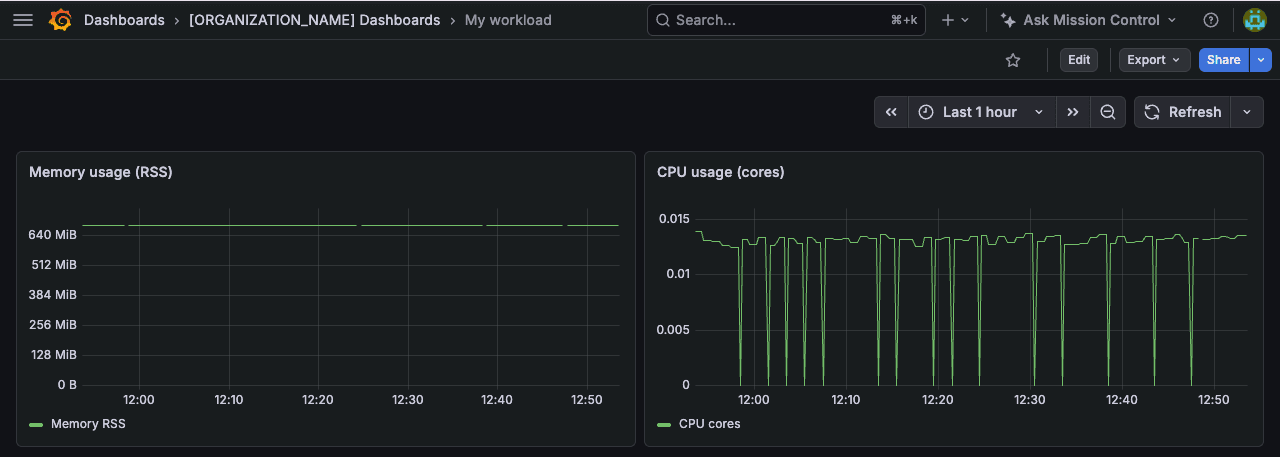 Reopening the dashboard verifies that you saved its configuration. If a panel is empty, the save might still have succeeded. Check the time range, data source, label values, and metrics access.
## Next steps
To share and organize your dashboards:
* Share the dashboard link with colleagues who have access to both the dashboard and its metrics. For the required permissions, see [Dashboard access](/observability/managed-grafana#dashboard-access). By default, **Share** > **Share internally** locks the link to the current time range. To share a link that follows a relative range such as **Last 1 hour**, turn off **Lock time range** before you select **Copy link**.
* Group related dashboards in subfolders. For more information, see [Organization folders](/observability/managed-grafana#organization-folders).
## Related topics
- [Can I create custom dashboards and alerts?](/support/observability/articles/can-i-create-custom-dashboards-and-alerts.md)
Reopening the dashboard verifies that you saved its configuration. If a panel is empty, the save might still have succeeded. Check the time range, data source, label values, and metrics access.
## Next steps
To share and organize your dashboards:
* Share the dashboard link with colleagues who have access to both the dashboard and its metrics. For the required permissions, see [Dashboard access](/observability/managed-grafana#dashboard-access). By default, **Share** > **Share internally** locks the link to the current time range. To share a link that follows a relative range such as **Last 1 hour**, turn off **Lock time range** before you select **Copy link**.
* Group related dashboards in subfolders. For more information, see [Organization folders](/observability/managed-grafana#organization-folders).
## Related topics
- [Can I create custom dashboards and alerts?](/support/observability/articles/can-i-create-custom-dashboards-and-alerts.md)