> ## Documentation Index
> Fetch the complete documentation index at: https://docs.coreweave.com/llms.txt
> Use this file to discover all available pages before exploring further.
# Home
> The Grafana Home dashboard shows an overview of your CoreWeave environment, with key metrics, announcements, and status.
This page describes the **Home** dashboard in CoreWeave Grafana. It explains what each panel shows so you can interpret the environment overview and status information at a glance.
To view the dashboard, go to the [Home dashboard](https://cks-grafana.coreweave.com/d/a400d6f5-96a9-4454-9cc8-3b15a746e09e/home).
For instructions about accessing CoreWeave Grafana dashboards, see [Access and use CoreWeave Grafana dashboards](/observability/managed-grafana/access).
The **Home** dashboard is the default landing experience when you open CoreWeave Grafana. It provides a real-time snapshot of your CoreWeave environment across CoreWeave Kubernetes Service (CKS), SUNK, and storage. The dashboard also shows the latest platform announcements and live CoreWeave service status. Use this information to determine whether a platform issue affects your workloads.
You can use this dashboard in the following ways:
* Check the current state of your GPU fleet, Pods, and storage at a glance.
* Stay informed about platform announcements and changes.
* Navigate to frequently used dashboards.
* Determine whether an active CoreWeave incident affects your workloads.
 ## Panel descriptions
The following sections describe the main panel groups on the Home dashboard, from the announcement and metrics area through quick links and service status.
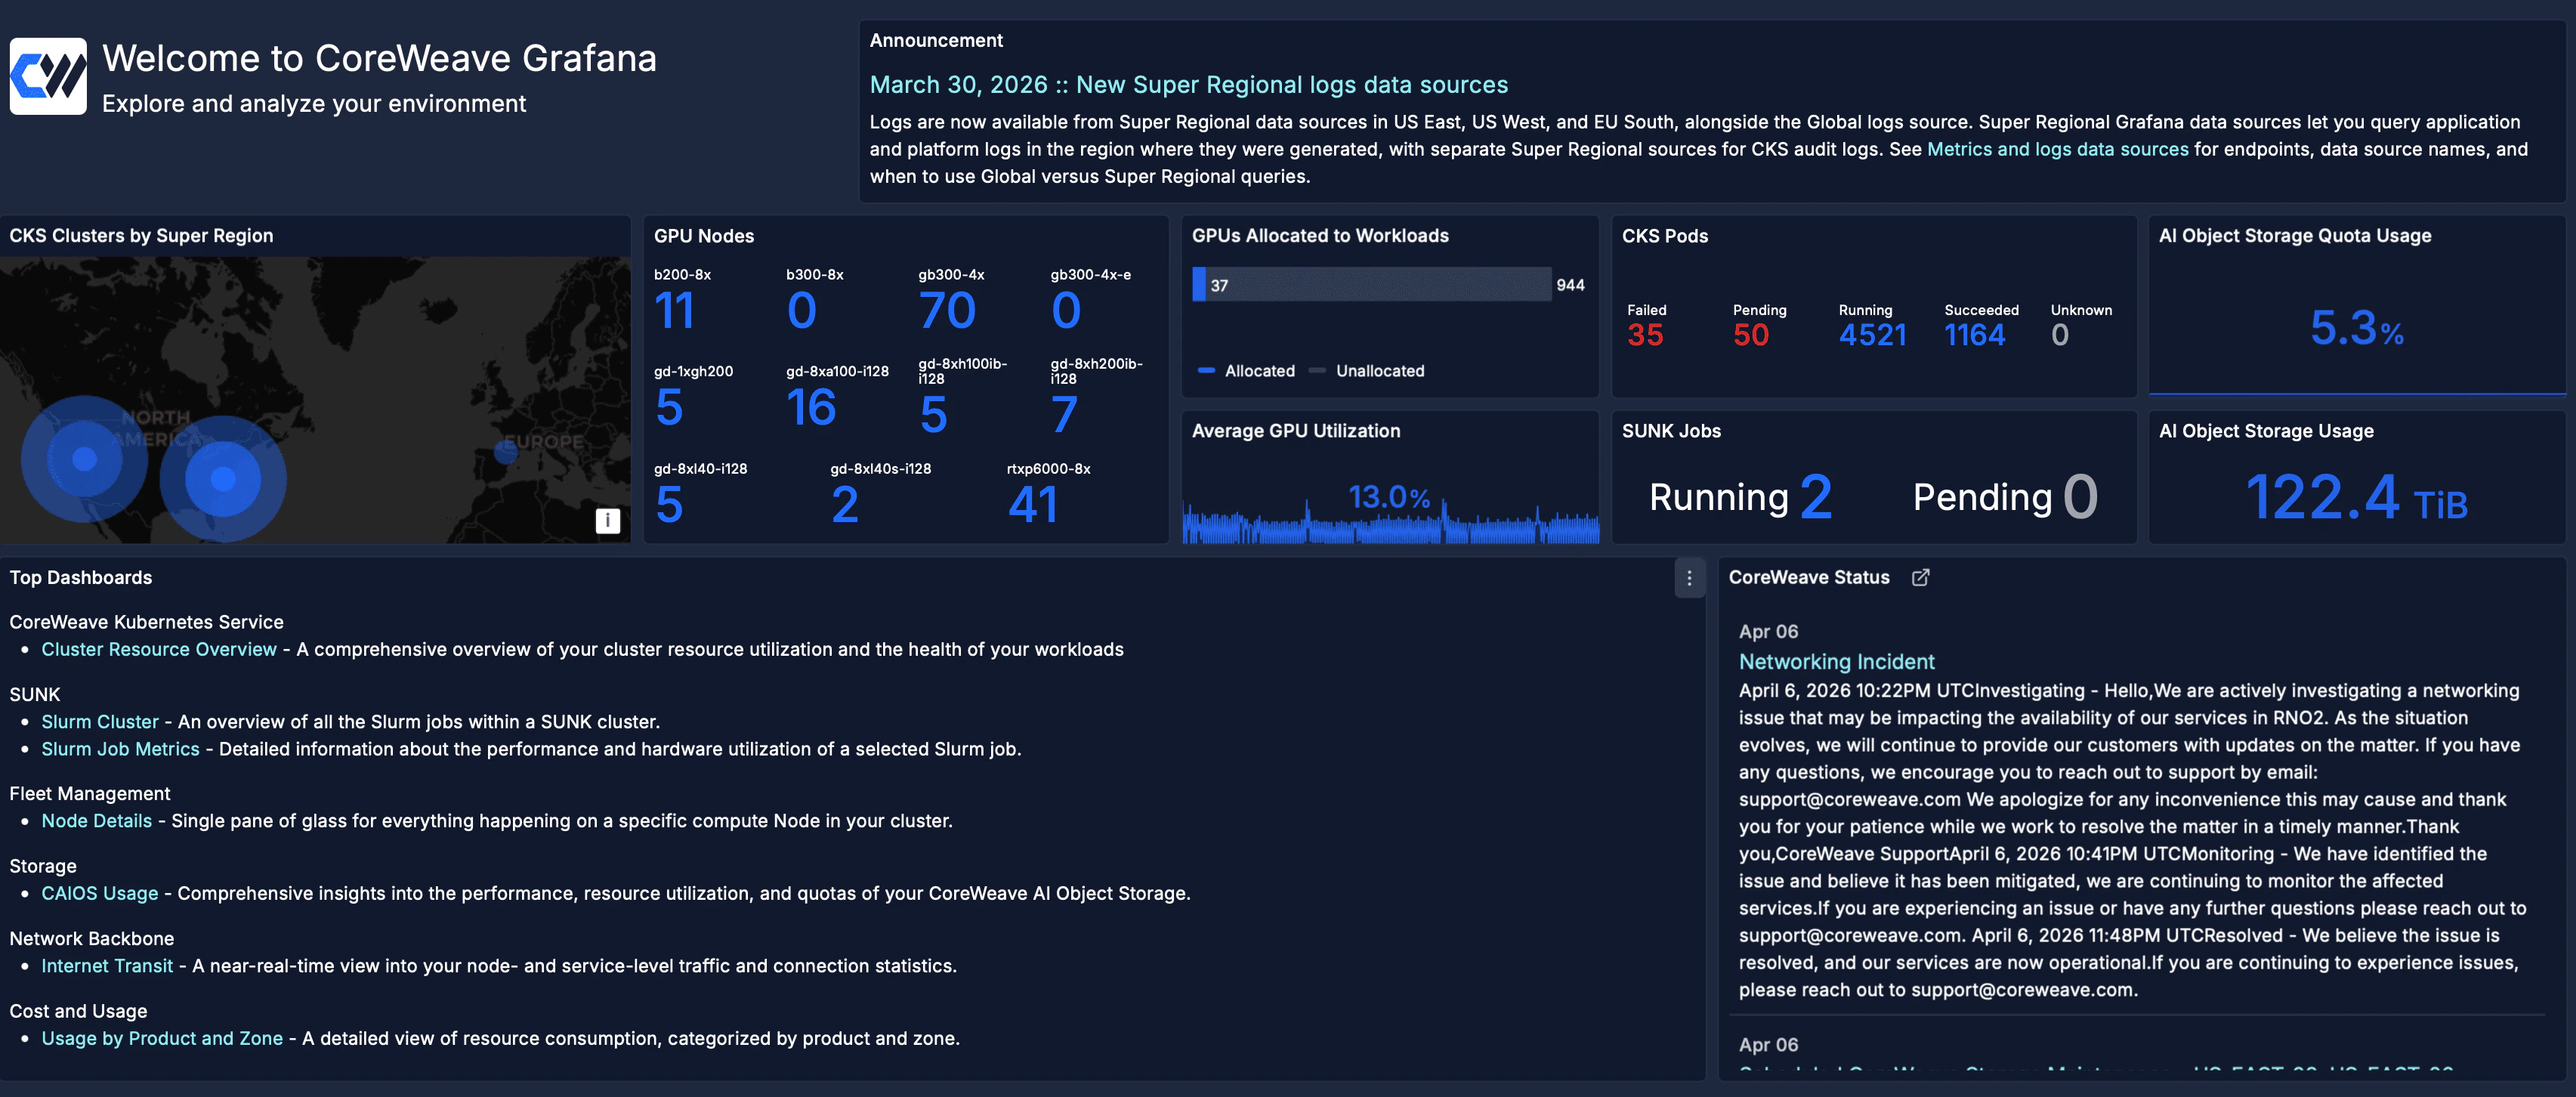
### Announcement
The **Announcement** panel highlights the latest platform announcement at the top of the dashboard. It can include new feature availability, data source or logging changes, and other updates that affect how you monitor or navigate your environment.
### Environment overview
The environment overview panels provide top-level metrics across your CKS environments and workloads. The following table describes each panel in this group.
| Panel | Description |
| --------------------------------- | -------------------------------------------------------------------------------------------------------------- |
| **CKS Clusters by Super Region** | A world map showing the geographic locations of your CKS clusters, grouped by Super Region. |
| **GPU Nodes** | A breakdown of available GPU Nodes by instance type, showing the current Node count for each GPU model. |
| **GPUs Allocated to Workloads** | A bar chart comparing the number of GPUs currently allocated to workloads against the total unallocated count. |
| **Average GPU Utilization** | A time-series graph showing the average GPU utilization percentage across all active workloads. |
| **CKS Pods** | Pod counts broken down by status: Failed, Pending, Running, Succeeded, and Unknown. |
| **SUNK Jobs** | The count of currently running and pending SUNK jobs across all clusters. |
| **AI Object Storage Quota Usage** | The percentage of your AI Object Storage quota currently in use. |
| **AI Object Storage Usage** | The total amount of data stored in AI Object Storage, in TiB. |
### Top dashboards
The **Top dashboards** panel groups quick links to frequently used dashboards by product area. Each entry includes a short description so you can open the right dashboard without browsing the full library.
### CoreWeave status
The **CoreWeave Status** panel displays a live feed of recent incidents and maintenance events from the CoreWeave status page. Each entry shows the date, incident title, and status updates. Use this panel to determine whether an active platform issue affects your environment.
## Panel descriptions
The following sections describe the main panel groups on the Home dashboard, from the announcement and metrics area through quick links and service status.
### Announcement
The **Announcement** panel highlights the latest platform announcement at the top of the dashboard. It can include new feature availability, data source or logging changes, and other updates that affect how you monitor or navigate your environment.
### Environment overview
The environment overview panels provide top-level metrics across your CKS environments and workloads. The following table describes each panel in this group.
| Panel | Description |
| --------------------------------- | -------------------------------------------------------------------------------------------------------------- |
| **CKS Clusters by Super Region** | A world map showing the geographic locations of your CKS clusters, grouped by Super Region. |
| **GPU Nodes** | A breakdown of available GPU Nodes by instance type, showing the current Node count for each GPU model. |
| **GPUs Allocated to Workloads** | A bar chart comparing the number of GPUs currently allocated to workloads against the total unallocated count. |
| **Average GPU Utilization** | A time-series graph showing the average GPU utilization percentage across all active workloads. |
| **CKS Pods** | Pod counts broken down by status: Failed, Pending, Running, Succeeded, and Unknown. |
| **SUNK Jobs** | The count of currently running and pending SUNK jobs across all clusters. |
| **AI Object Storage Quota Usage** | The percentage of your AI Object Storage quota currently in use. |
| **AI Object Storage Usage** | The total amount of data stored in AI Object Storage, in TiB. |
### Top dashboards
The **Top dashboards** panel groups quick links to frequently used dashboards by product area. Each entry includes a short description so you can open the right dashboard without browsing the full library.
### CoreWeave status
The **CoreWeave Status** panel displays a live feed of recent incidents and maintenance events from the CoreWeave status page. Each entry shows the date, incident title, and status updates. Use this panel to determine whether an active platform issue affects your environment.