> ## Documentation Index
> Fetch the complete documentation index at: https://docs.coreweave.com/llms.txt
> Use this file to discover all available pages before exploring further.
# Kubernetes Audit Logs
> Grafana dashboard for viewing Kubernetes audit logs for security and troubleshooting in CKS
To view the dashboard, go to the [Kubernetes Audit Logs dashboard](https://cks-grafana.coreweave.com/d/k8s-audit-logs/kubernetes-audit-logs).
For instructions about accessing CoreWeave Grafana dashboards, see [Access and use CoreWeave Grafana dashboards](/observability/managed-grafana/access).
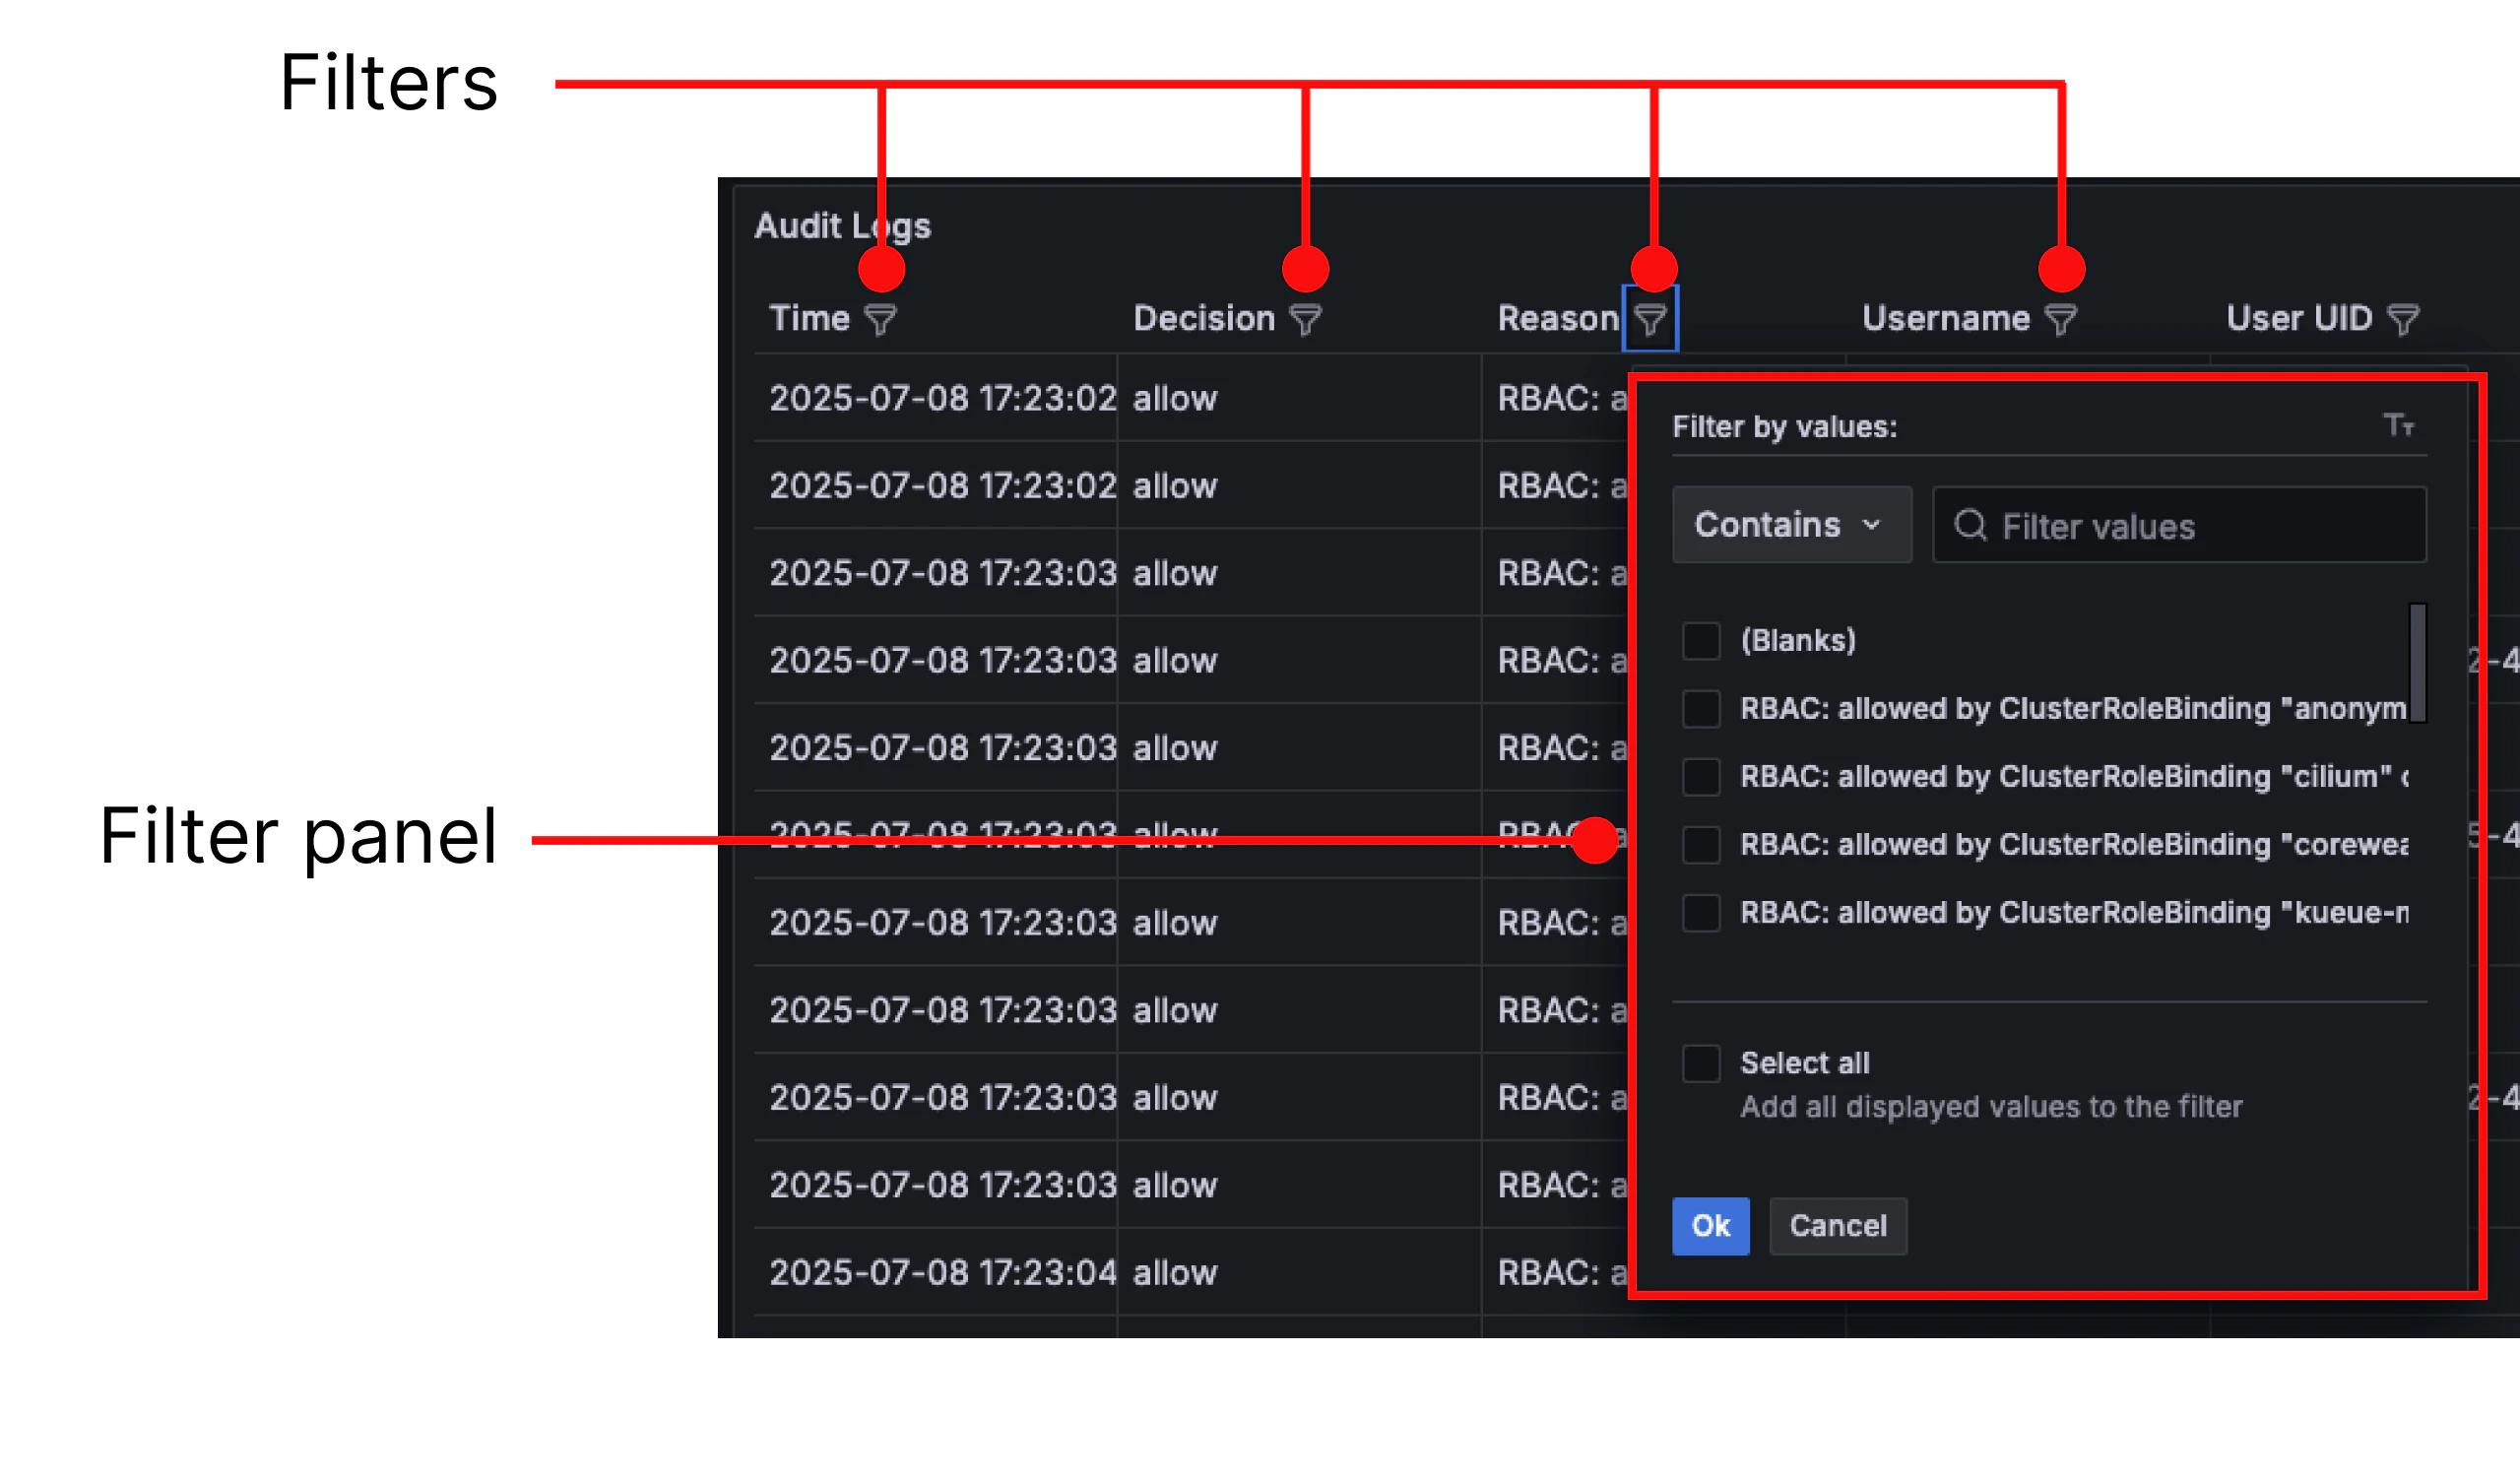
The Kubernetes Audit Logs dashboard provides detailed information about cluster events and supports security, auditing, and troubleshooting.
Use column filters to query for specific logs.