> ## Documentation Index
> Fetch the complete documentation index at: https://docs.coreweave.com/llms.txt
> Use this file to discover all available pages before exploring further.
# Cluster Resource Overview
> Grafana dashboard for monitoring cluster-wide CPU, memory, GPU, and network utilization in CKS
To view the dashboard, go to the [Cluster Resource Overview dashboard](https://cks-grafana.coreweave.com/d/edy70efsd7qpsf/cluster-resource-overview).
For instructions about accessing CoreWeave Grafana dashboards, see [Access and use CoreWeave Grafana dashboards](/observability/managed-grafana/access).
The Cluster Resource Overview dashboard summarizes your cluster resource utilization and workload health. It gives you a high-level view of your Kubernetes cluster and lets you investigate specific components in detail.
## Overview
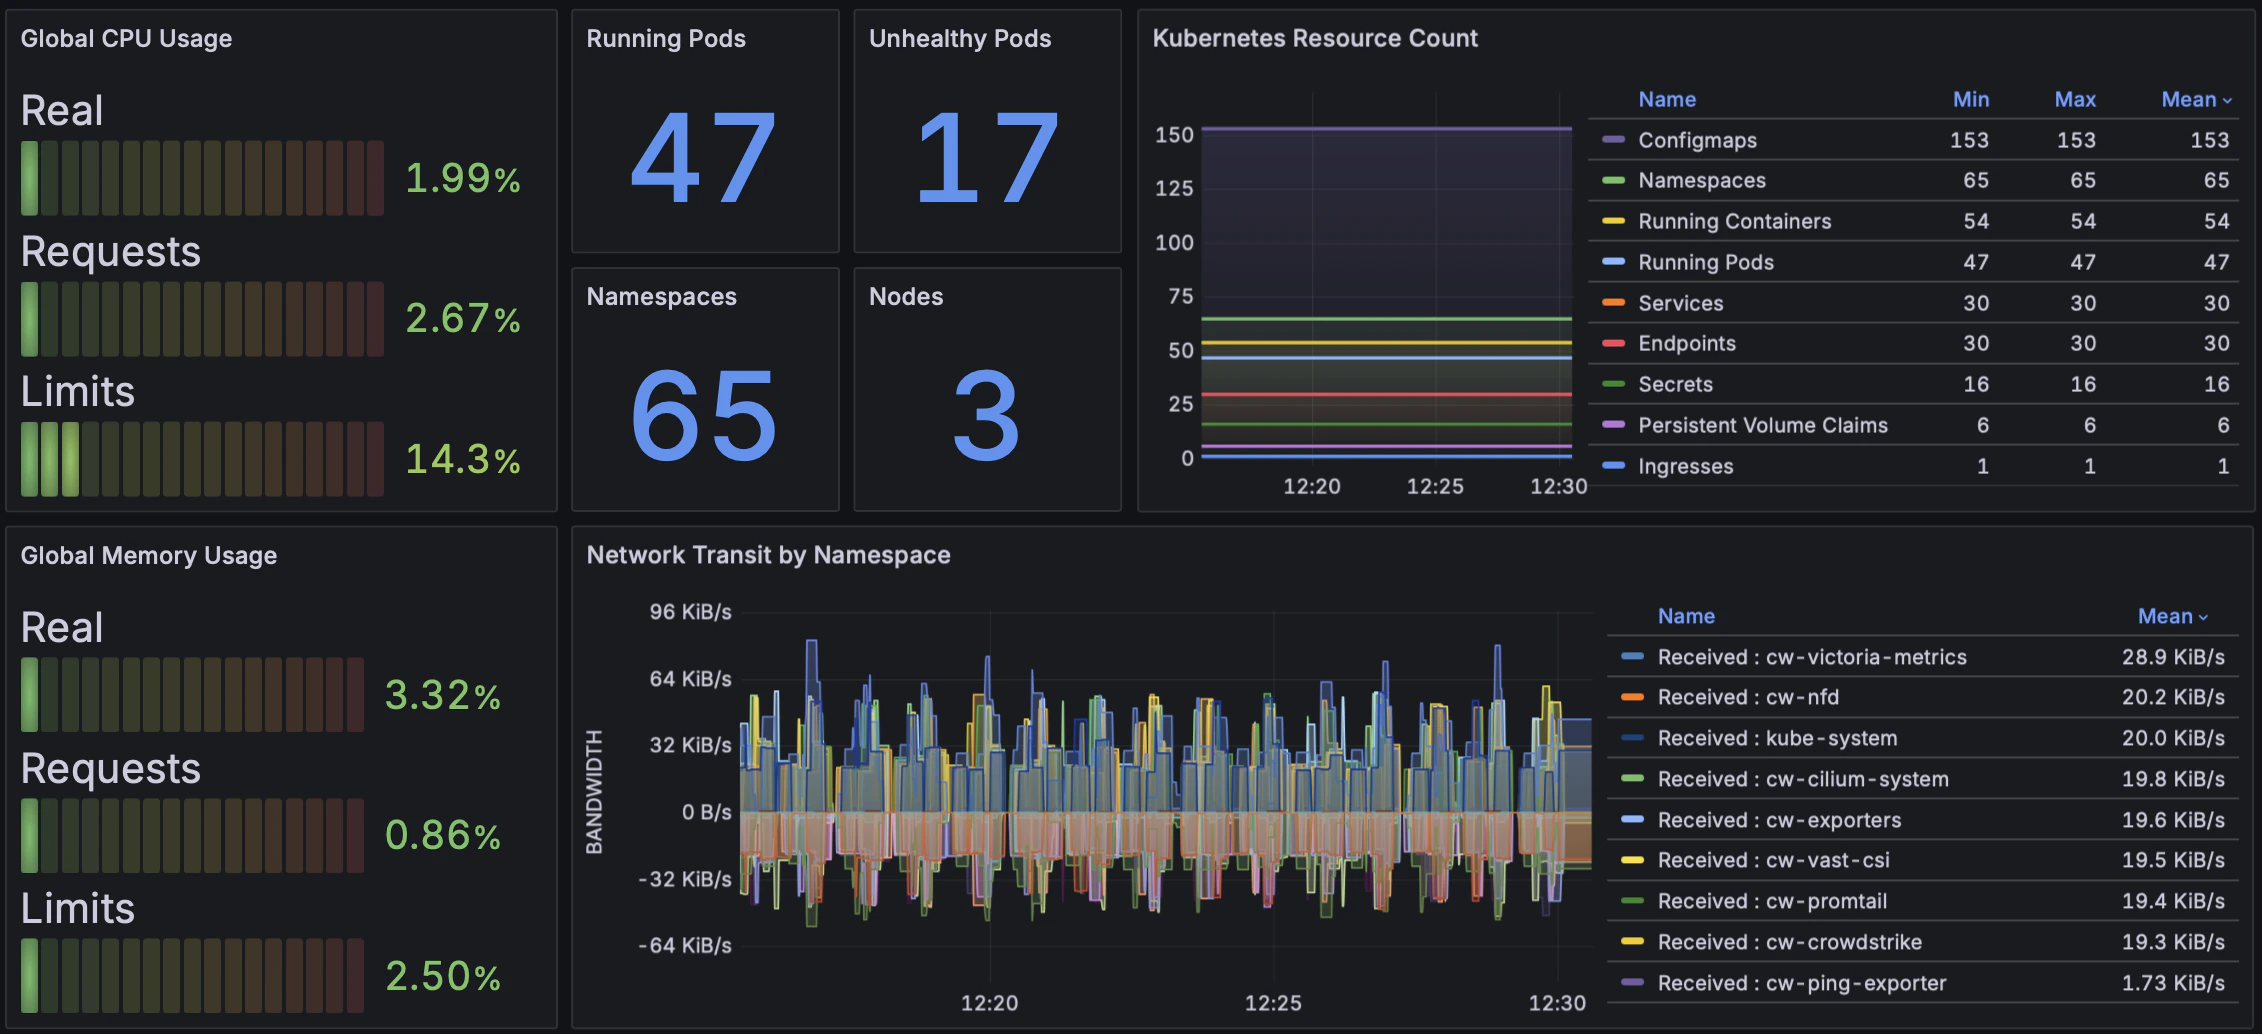
The Overview section shows cluster-wide CPU usage, memory usage, network transit throughput, and a summary of workload health. Use it to quickly assess the overall state of your cluster.
 | Panel Title | Description |
| -------------------------------- | ------------------------------------------------------------------------------------------------ |
| **Global CPU Usage** | Displays CPU usage, requests, and limits across the entire cluster. |
| **Global Memory Usage** | Displays memory usage, requests, and limits across the entire cluster. |
| **Kubernetes Resource Count** | Shows the count of Kubernetes resources such as ConfigMaps, Running Containers, and Namespaces. |
| **Network Transit by Namespace** | Displays the network traffic (received and transmitted) broken down by namespace. |
| **Unhealthy Pods by Namespace** | Shows the count of unhealthy Pods over time, grouped by namespace. |
| **Pods Phase Count** | Shows the number of Pods in different phases (Running, Pending, Failed, Succeeded, and Unknown). |
## GPU Info
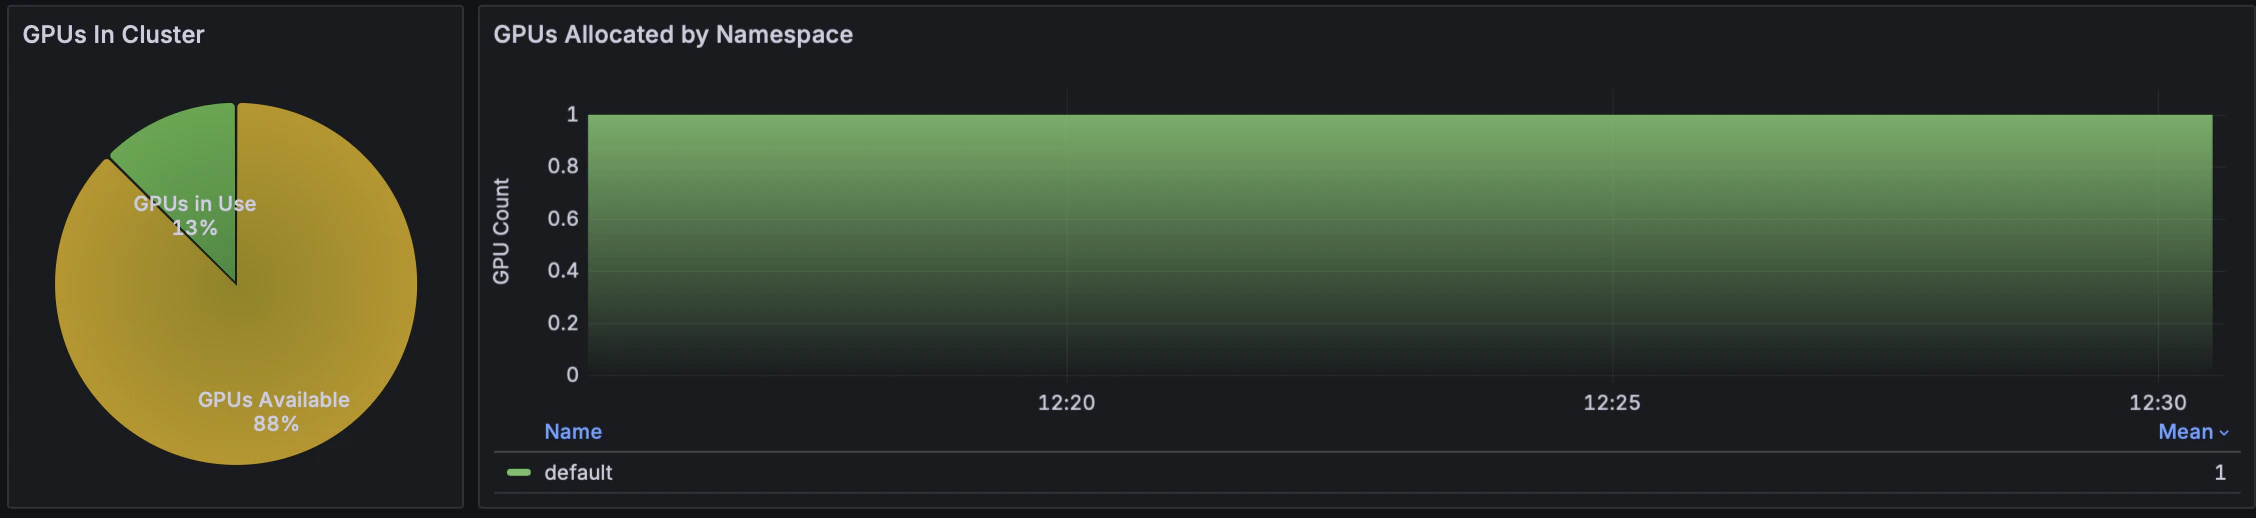
The GPU Info section provides insights into GPU usage, availability, and the status of idle Slurm Nodes.
| Panel Title | Description |
| -------------------------------- | ------------------------------------------------------------------------------------------------ |
| **Global CPU Usage** | Displays CPU usage, requests, and limits across the entire cluster. |
| **Global Memory Usage** | Displays memory usage, requests, and limits across the entire cluster. |
| **Kubernetes Resource Count** | Shows the count of Kubernetes resources such as ConfigMaps, Running Containers, and Namespaces. |
| **Network Transit by Namespace** | Displays the network traffic (received and transmitted) broken down by namespace. |
| **Unhealthy Pods by Namespace** | Shows the count of unhealthy Pods over time, grouped by namespace. |
| **Pods Phase Count** | Shows the number of Pods in different phases (Running, Pending, Failed, Succeeded, and Unknown). |
## GPU Info
The GPU Info section provides insights into GPU usage, availability, and the status of idle Slurm Nodes.
 | Panel Title | Description |
| ------------------------------- | ------------------------------------------------------------------------- |
| **GPUs In Cluster** | Displays the total number of GPUs available in the cluster. |
| **GPUs Allocated by Namespace** | Shows how GPUs are distributed and allocated across different namespaces. |
| **GPU Accelerated Pods** | Lists all Pods that are currently using GPUs. |
| **Idle Slurm Nodes/Pods** | A graph showing the number of idle Slurm Nodes or Pods over time. |
## Pod Info
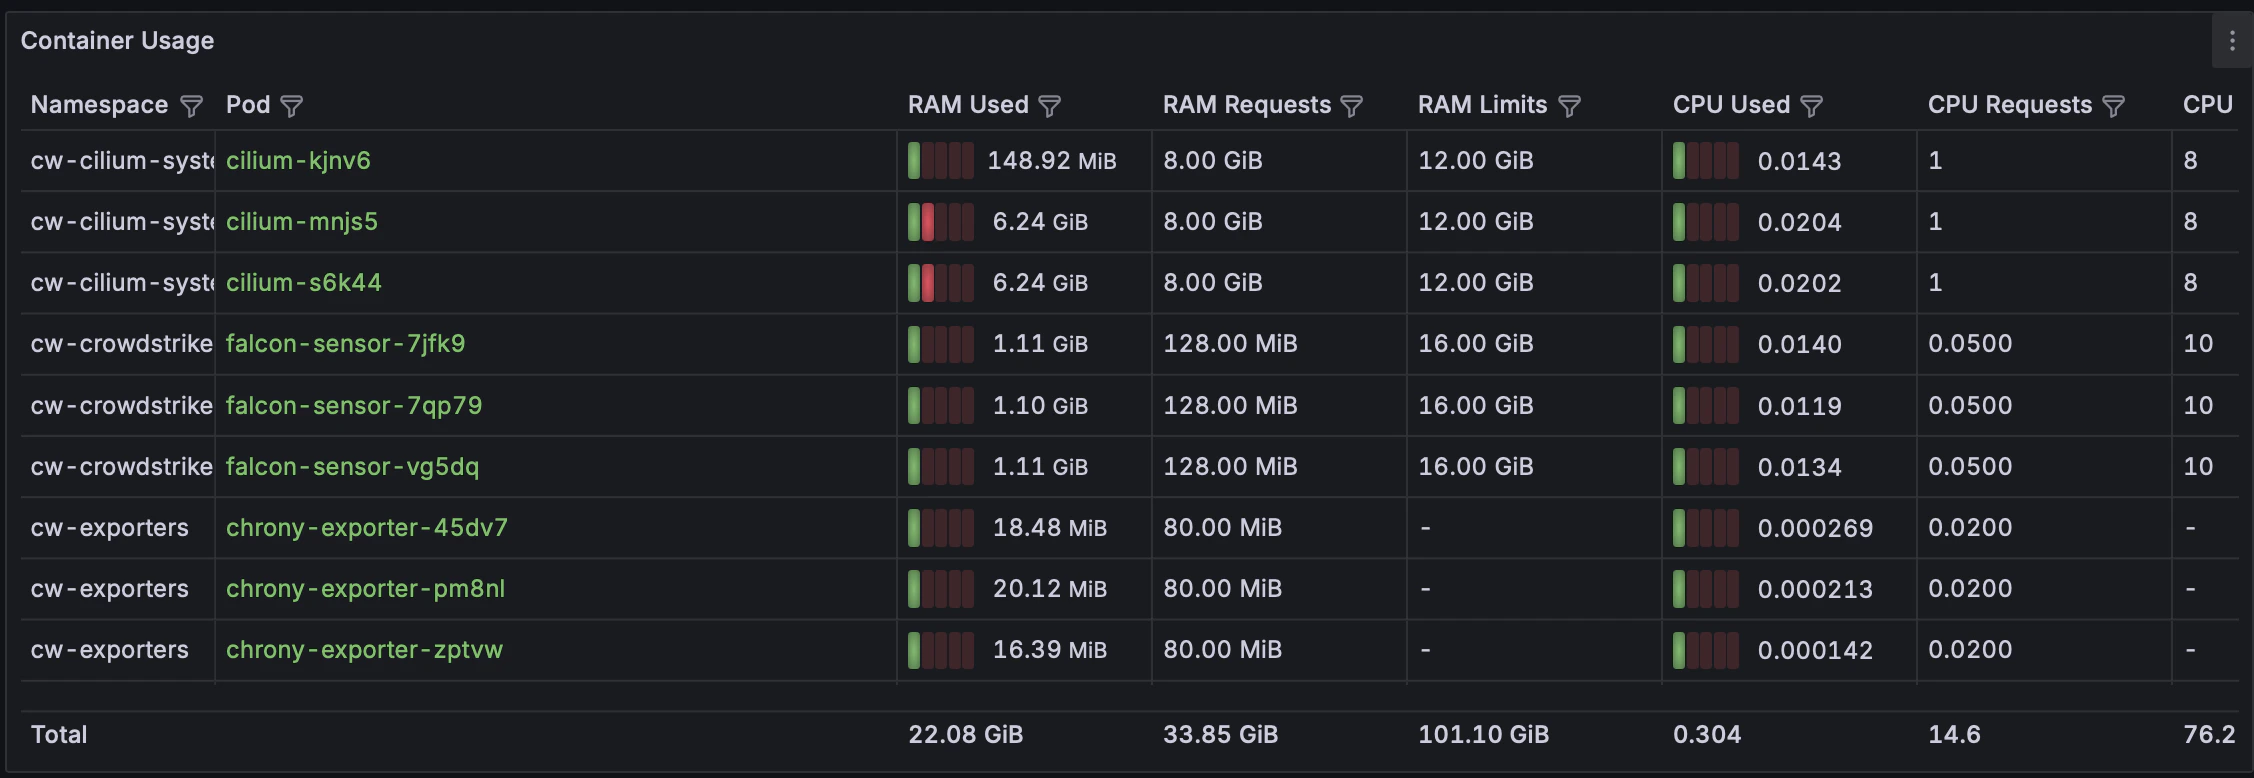
The Pod Info section details CPU and memory limits, requests, and usage for each individual Pod. Use it to understand resource consumption at the Pod level.
| Panel Title | Description |
| ------------------------------- | ------------------------------------------------------------------------- |
| **GPUs In Cluster** | Displays the total number of GPUs available in the cluster. |
| **GPUs Allocated by Namespace** | Shows how GPUs are distributed and allocated across different namespaces. |
| **GPU Accelerated Pods** | Lists all Pods that are currently using GPUs. |
| **Idle Slurm Nodes/Pods** | A graph showing the number of idle Slurm Nodes or Pods over time. |
## Pod Info
The Pod Info section details CPU and memory limits, requests, and usage for each individual Pod. Use it to understand resource consumption at the Pod level.
 | Panel Title | Description |
| ------------------- | ------------------------------------------------------------------------------------ |
| **Container Usage** | Lists Pods with their namespace, RAM usage, RAM requests, RAM limits, and CPU usage. |
| **Pod Readiness** | Shows the readiness status of each Pod. |
## Node Info
The Node Info section displays CPU and memory capacity, requests, and limits for Pods running on each Node. It also shows the percentage of utilization for each Node based on Pod requests.
| Panel Title | Description |
| ----------------------------- | ------------------------------------------------------------------------------------------------------------------------------------------------------------------ |
| **Node Requests vs Capacity** | A table detailing each Node's Cores Capacity, CPU Requests, CPU Limits, CPU Requests percent, Memory Capacity, Memory Request, Memory Limits, and Memory Requests. |
## Deployment, StatefulSet, and DaemonSet Info
This section provides basic scheduled and ready replica counts for each workload, including Deployments, StatefulSets, and DaemonSets. Use it to verify that your applications are scaled correctly.
| Panel Title | Description |
| ---------------- | -------------------------------------------------------------------- |
| **Deployments** | Lists deployments with their current and desired replica counts. |
| **StatefulSets** | Lists StatefulSets with their current and desired replica counts. |
| **DaemonSets** | Lists DaemonSets with the number of scheduled and ready daemon Pods. |
## Image Info
The Image Info section shows all container images currently in use throughout the cluster. Use it to track image versions and verify compliance.
| Panel Title | Description |
| ----------------- | --------------------------------------------------------------------------------------------- |
| **Images In Use** | A table listing image names, the number of containers using the image, and the container tag. |
| Panel Title | Description |
| ------------------- | ------------------------------------------------------------------------------------ |
| **Container Usage** | Lists Pods with their namespace, RAM usage, RAM requests, RAM limits, and CPU usage. |
| **Pod Readiness** | Shows the readiness status of each Pod. |
## Node Info
The Node Info section displays CPU and memory capacity, requests, and limits for Pods running on each Node. It also shows the percentage of utilization for each Node based on Pod requests.
| Panel Title | Description |
| ----------------------------- | ------------------------------------------------------------------------------------------------------------------------------------------------------------------ |
| **Node Requests vs Capacity** | A table detailing each Node's Cores Capacity, CPU Requests, CPU Limits, CPU Requests percent, Memory Capacity, Memory Request, Memory Limits, and Memory Requests. |
## Deployment, StatefulSet, and DaemonSet Info
This section provides basic scheduled and ready replica counts for each workload, including Deployments, StatefulSets, and DaemonSets. Use it to verify that your applications are scaled correctly.
| Panel Title | Description |
| ---------------- | -------------------------------------------------------------------- |
| **Deployments** | Lists deployments with their current and desired replica counts. |
| **StatefulSets** | Lists StatefulSets with their current and desired replica counts. |
| **DaemonSets** | Lists DaemonSets with the number of scheduled and ready daemon Pods. |
## Image Info
The Image Info section shows all container images currently in use throughout the cluster. Use it to track image versions and verify compliance.
| Panel Title | Description |
| ----------------- | --------------------------------------------------------------------------------------------- |
| **Images In Use** | A table listing image names, the number of containers using the image, and the container tag. |