> ## Documentation Index
> Fetch the complete documentation index at: https://docs.coreweave.com/llms.txt
> Use this file to discover all available pages before exploring further.
# Access and use CoreWeave Grafana dashboards
> Learn how to access and use CoreWeave Grafana dashboards
CoreWeave Grafana dashboards provide visibility into the performance, usage, and cost of your CoreWeave resources. This page explains how to sign in to CoreWeave Grafana, locate the dashboards available to your account, and understand the layout of a dashboard so you can navigate the data it presents.
## Prerequisites
* You must sign in to the [Cloud Console](https://console.coreweave.com/) to access CoreWeave Grafana.
* Access to the dashboards, and visibility of the Console button, is only available to users with the `Observability Viewer` role in an [IAM access policy](/security/iam/access-policies). In the legacy CoreWeave permissions model, [users in the `metrics` group](/security/iam/access-policies/legacy-permissions) can access CoreWeave Grafana.
* To access the [Usage by Product and Zone dashboard](/observability/managed-grafana/cost-usage/usage-product-zone), you need both the `Observability Viewer` and `Billing Viewer` roles in an [IAM access policy](/security/iam/access-policies). In the legacy CoreWeave permissions model, [users in the `metrics` and `billing_viewer` groups](/security/iam/access-policies/legacy-permissions) can access CoreWeave Grafana.
## Access CoreWeave Grafana dashboards
[CoreWeave Grafana](https://cks-grafana.coreweave.com) is hosted at `https://cks-grafana.coreweave.com`.
To open a dashboard:
1. Sign in to the [Cloud Console](https://console.coreweave.com/) to authenticate, then go to the [Grafana](https://cks-grafana.coreweave.com) page. The dashboard is also linked in the left sidebar of the Cloud Console.
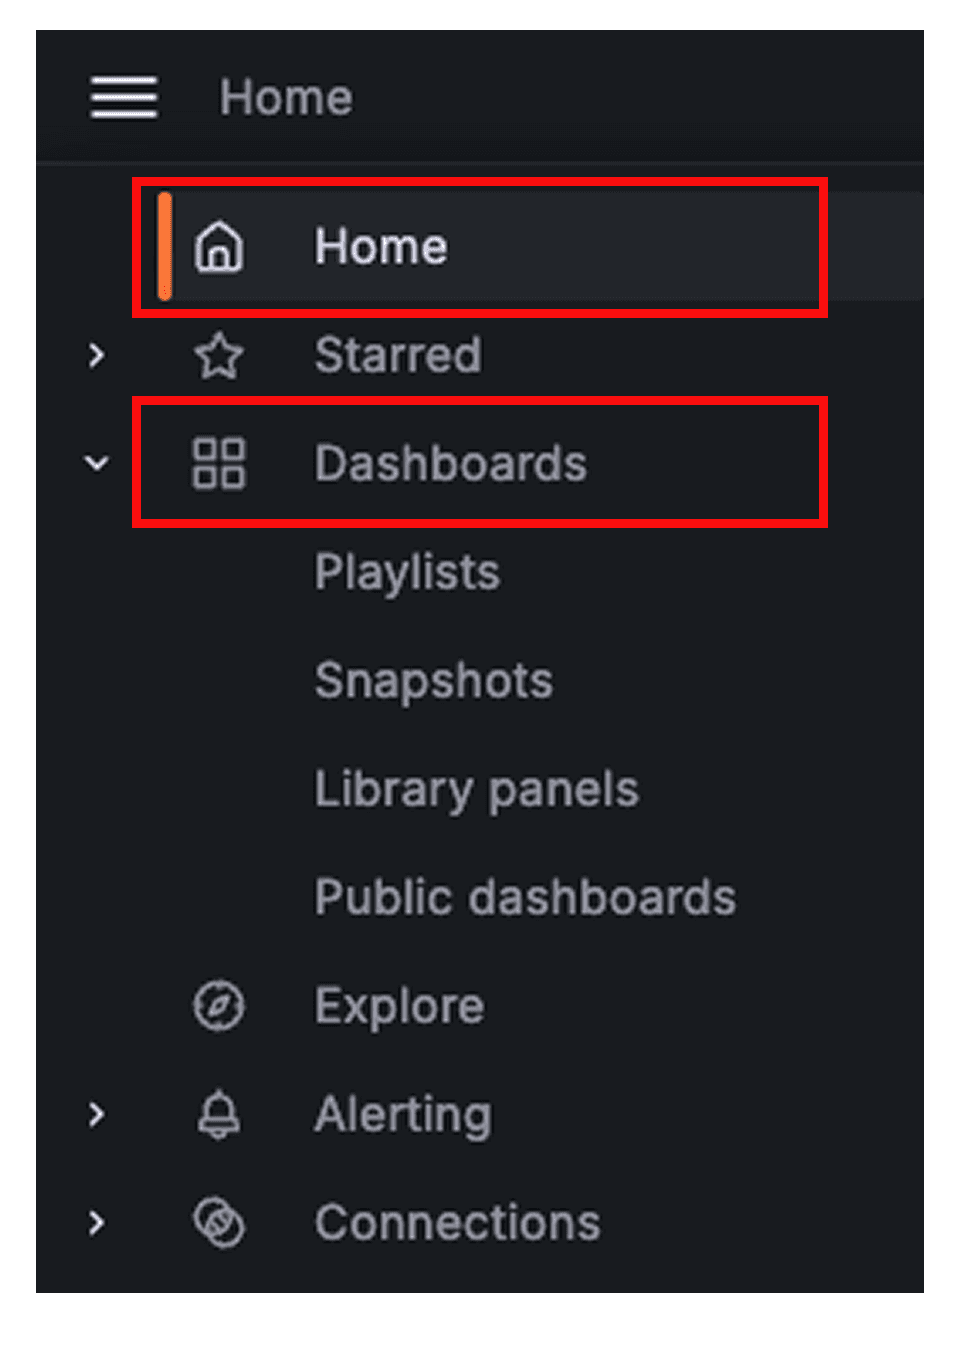
2. On the Grafana dashboard page, select **Home** and then **Dashboards**.
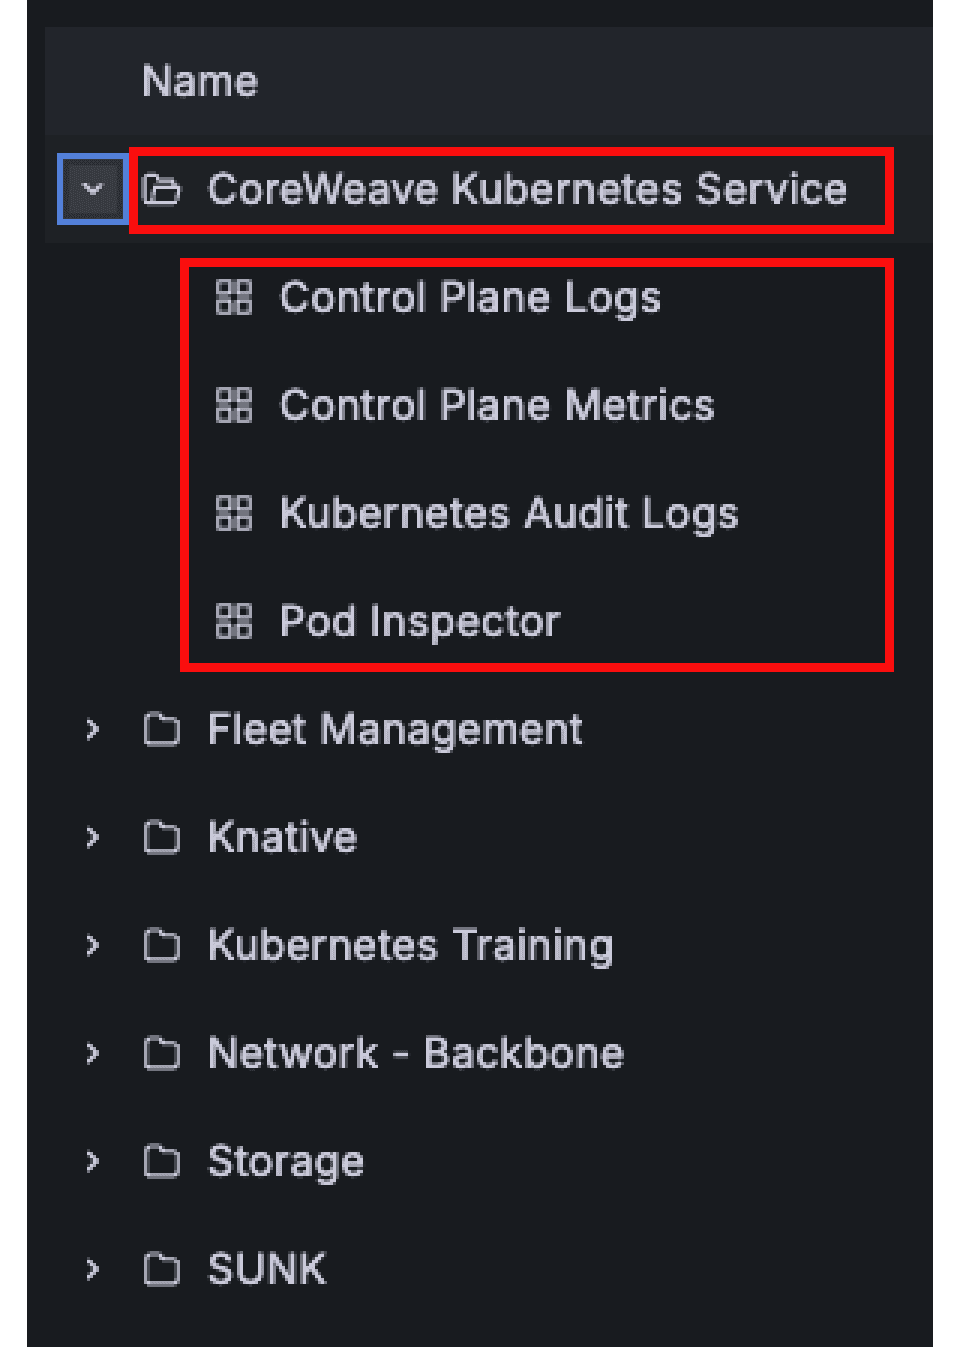
 3. From the dashboard menu, expand a folder and select a dashboard.
 After you select a dashboard, it opens in the main view so you can explore its panels.
## Use CoreWeave Grafana dashboards
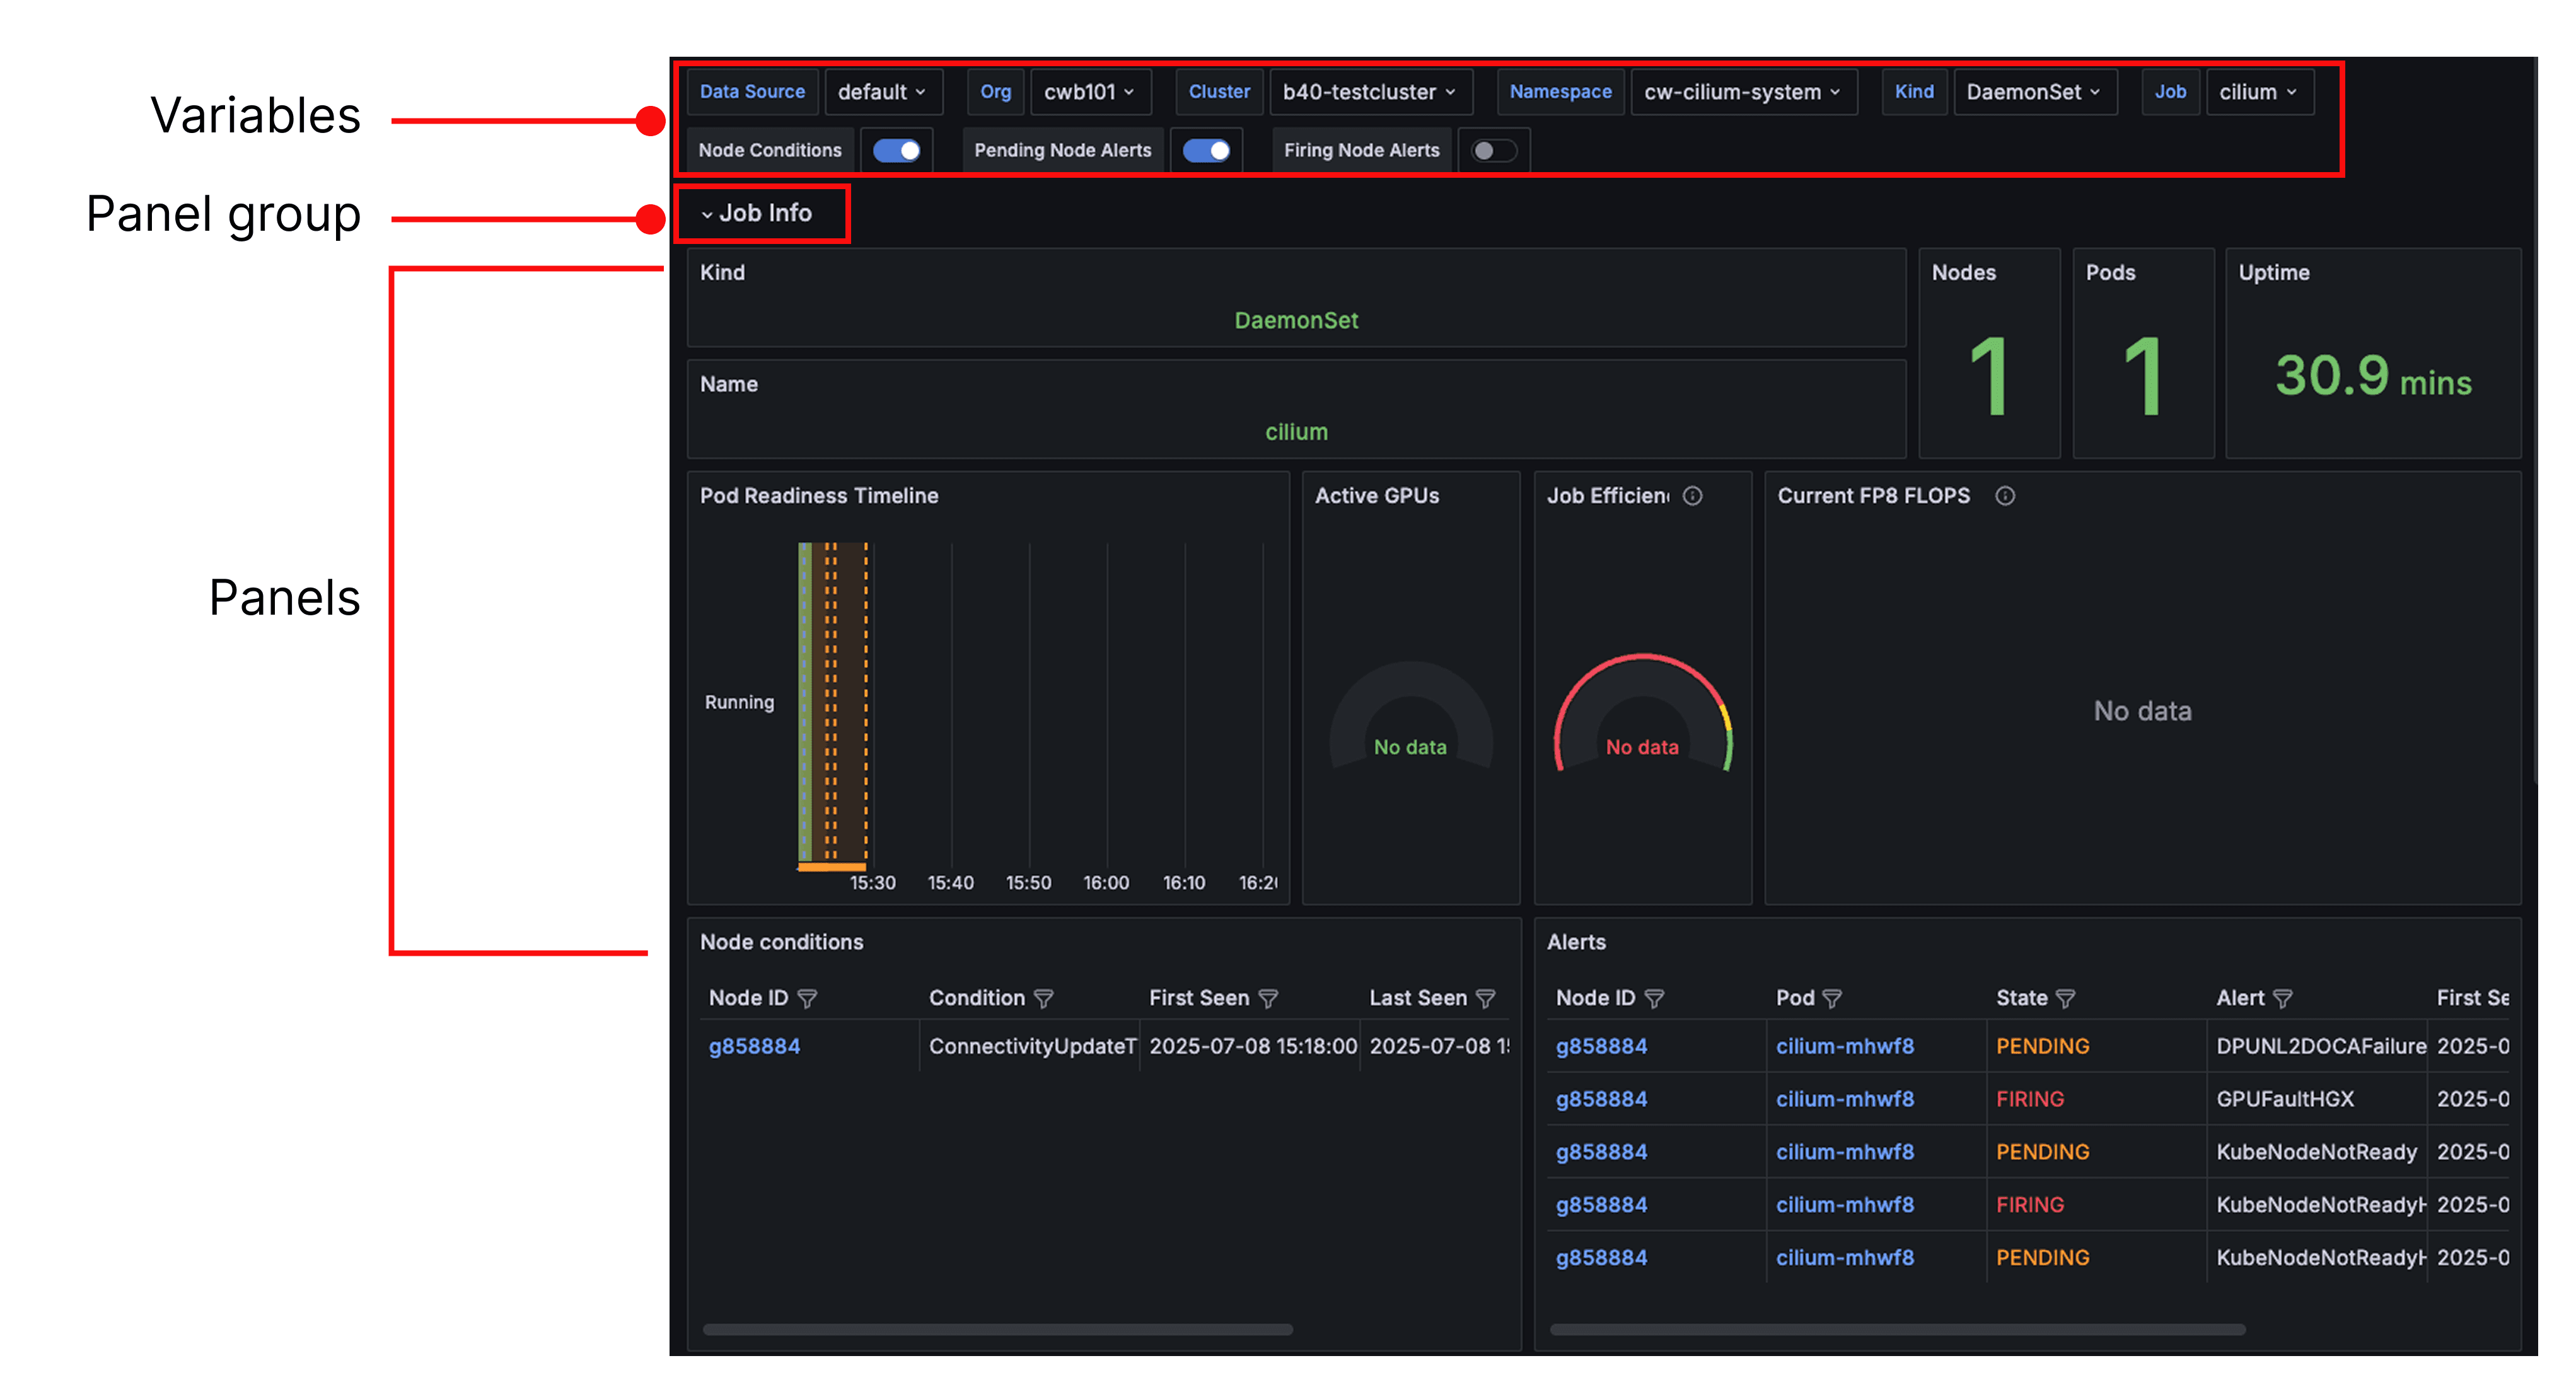
CoreWeave Grafana dashboards have three main areas:
* **Variables**: Variables let you select from options to refine your queries.
* **Panel group**: A panel group organizes related panels into a section.
* **Panels**: Panels visualize or list the data described in the panel name.
After you select a dashboard, it opens in the main view so you can explore its panels.
## Use CoreWeave Grafana dashboards
CoreWeave Grafana dashboards have three main areas:
* **Variables**: Variables let you select from options to refine your queries.
* **Panel group**: A panel group organizes related panels into a section.
* **Panels**: Panels visualize or list the data described in the panel name.
 For more information about Grafana dashboards, see the [Grafana documentation](https://grafana.com/docs/grafana/latest/).