> ## Documentation Index
> Fetch the complete documentation index at: https://docs.coreweave.com/llms.txt
> Use this file to discover all available pages before exploring further.

> Track machine learning experiments with W&B to log metrics, hyperparameters, system metrics, and model artifacts.

# Experiments overview

export const TryProductLink = ({url}) => <a href={url} target="_blank" rel="noopener noreferrer" className="github-source-link">
    <svg width="20" height="20" viewBox="0 0 24 24" fill="none" stroke="currentColor" strokeWidth="2" strokeLinecap="round" strokeLinejoin="round" xmlns="http://www.w3.org/2000/svg">
      <line x1="4" y1="21" x2="4" y2="14"></line>
      <line x1="4" y1="10" x2="4" y2="3"></line>
      <line x1="12" y1="21" x2="12" y2="12"></line>
      <line x1="12" y1="8" x2="12" y2="3"></line>
      <line x1="20" y1="21" x2="20" y2="16"></line>
      <line x1="20" y1="12" x2="20" y2="3"></line>
      <circle cx="4" cy="12" r="2"></circle>
      <circle cx="12" cy="10" r="2"></circle>
      <circle cx="20" cy="14" r="2"></circle>
    </svg>
    Try in W&amp;B
  </a>;

export const ColabLink = ({url}) => <a href={url} target="_blank" rel="noopener noreferrer" className="colab-link">
    <svg width="20" height="20" viewBox="0 0 24 24" fill="currentColor" xmlns="http://www.w3.org/2000/svg">
      <path d="M14.25.18l.9.2.73.26.59.3.45.32.34.34.25.34.16.33.1.3.04.26.02.2-.01.13V8.5l-.05.63-.13.55-.21.46-.26.38-.3.31-.33.25-.35.19-.35.14-.33.1-.3.07-.26.04-.21.02H8.77l-.69.05-.59.14-.5.22-.41.27-.33.32-.27.35-.2.36-.15.37-.1.35-.07.32-.04.27-.02.21v3.06H3.17l-.21-.03-.28-.07-.32-.12-.35-.18-.36-.26-.36-.36-.35-.46-.32-.59-.28-.73-.21-.88-.14-1.05-.05-1.23.06-1.22.16-1.04.24-.87.32-.71.36-.57.4-.44.42-.33.42-.24.4-.16.36-.1.32-.05.24-.01h.16l.06.01h8.16v-.83H6.18l-.01-2.75-.02-.37.05-.34.11-.31.17-.28.25-.26.31-.23.38-.2.44-.18.51-.15.58-.12.64-.1.71-.06.77-.04.84-.02 1.27.05zm-6.3 1.98l-.23.33-.08.41.08.41.23.34.33.22.41.09.41-.09.33-.22.23-.34.08-.41-.08-.41-.23-.33-.33-.22-.41-.09-.41.09zm13.09 3.95l.28.06.32.12.35.18.36.27.36.35.35.47.32.59.28.73.21.88.14 1.04.05 1.23-.06 1.23-.16 1.04-.24.86-.32.71-.36.57-.4.45-.42.33-.42.24-.4.16-.36.09-.32.05-.24.02-.16-.01h-8.22v.82h5.84l.01 2.76.02.36-.05.34-.11.31-.17.29-.25.25-.31.24-.38.2-.44.17-.51.15-.58.13-.64.09-.71.07-.77.04-.84.01-1.27-.04-1.07-.14-.9-.2-.73-.25-.59-.3-.45-.33-.34-.34-.25-.34-.16-.33-.1-.3-.04-.25-.02-.2.01-.13v-5.34l.05-.64.13-.54.21-.46.26-.38.3-.32.33-.24.35-.2.35-.14.33-.1.3-.06.26-.04.21-.02.13-.01h5.84l.69-.05.59-.14.5-.21.41-.28.33-.32.27-.35.2-.36.15-.36.1-.35.07-.32.04-.28.02-.21V6.07h2.09l.14.01.21.03zm-6.47 14.25l-.23.33-.08.41.08.41.23.33.33.23.41.08.41-.08.33-.23.23-.33.08-.41-.08-.41-.23-.33-.33-.23-.41-.08-.41.08z" />
    </svg>
    Try in Colab
  </a>;

<CardGroup cols={4}>
  <ColabLink url="https://colab.research.google.com/github/wandb/examples/blob/master/colabs/intro/Intro_to_Weights_%26_Biases.ipynb" />

  <TryProductLink url="https://forge.coreweave.com/wandb/stacey/deep-drive/workspace?workspace=user-lavanyashukla" />
</CardGroup>

몇 줄의 코드로 머신 러닝 실험을 추적하세요. 그런 다음 [대화형 대시보드](/ko/products/wandb/track/workspaces)에서 결과를 검토하거나 [Public API](/ko/products/wandb/ref/python/public-api)를 사용하여 데이터를 Python으로 내보내 프로그램 방식으로 액세스할 수 있습니다.

인기 있는 프레임워크(예: [Keras](/ko/products/wandb/integrations/keras))를 사용하는 경우 W\&B Integrations를 활용하세요. W\&B를 코드에 추가하는 방법과 전체 인테그레이션 목록에 대한 정보는 [W\&B Integrations](/ko/products/wandb/integrations)를 참조하세요.

<Frame>
  <img src="https://mintcdn.com/coreweave-dbfa0e8d/3Dv_sw2eg8feUJlx/products/wandb/_media/experiments_landing_page.png?fit=max&auto=format&n=3Dv_sw2eg8feUJlx&q=85&s=b705bd9ebe6cd3c71dcb4af3c539761f" alt="실험 대시보드" width="4242" height="2978" data-path="products/wandb/_media/experiments_landing_page.png" />
</Frame>

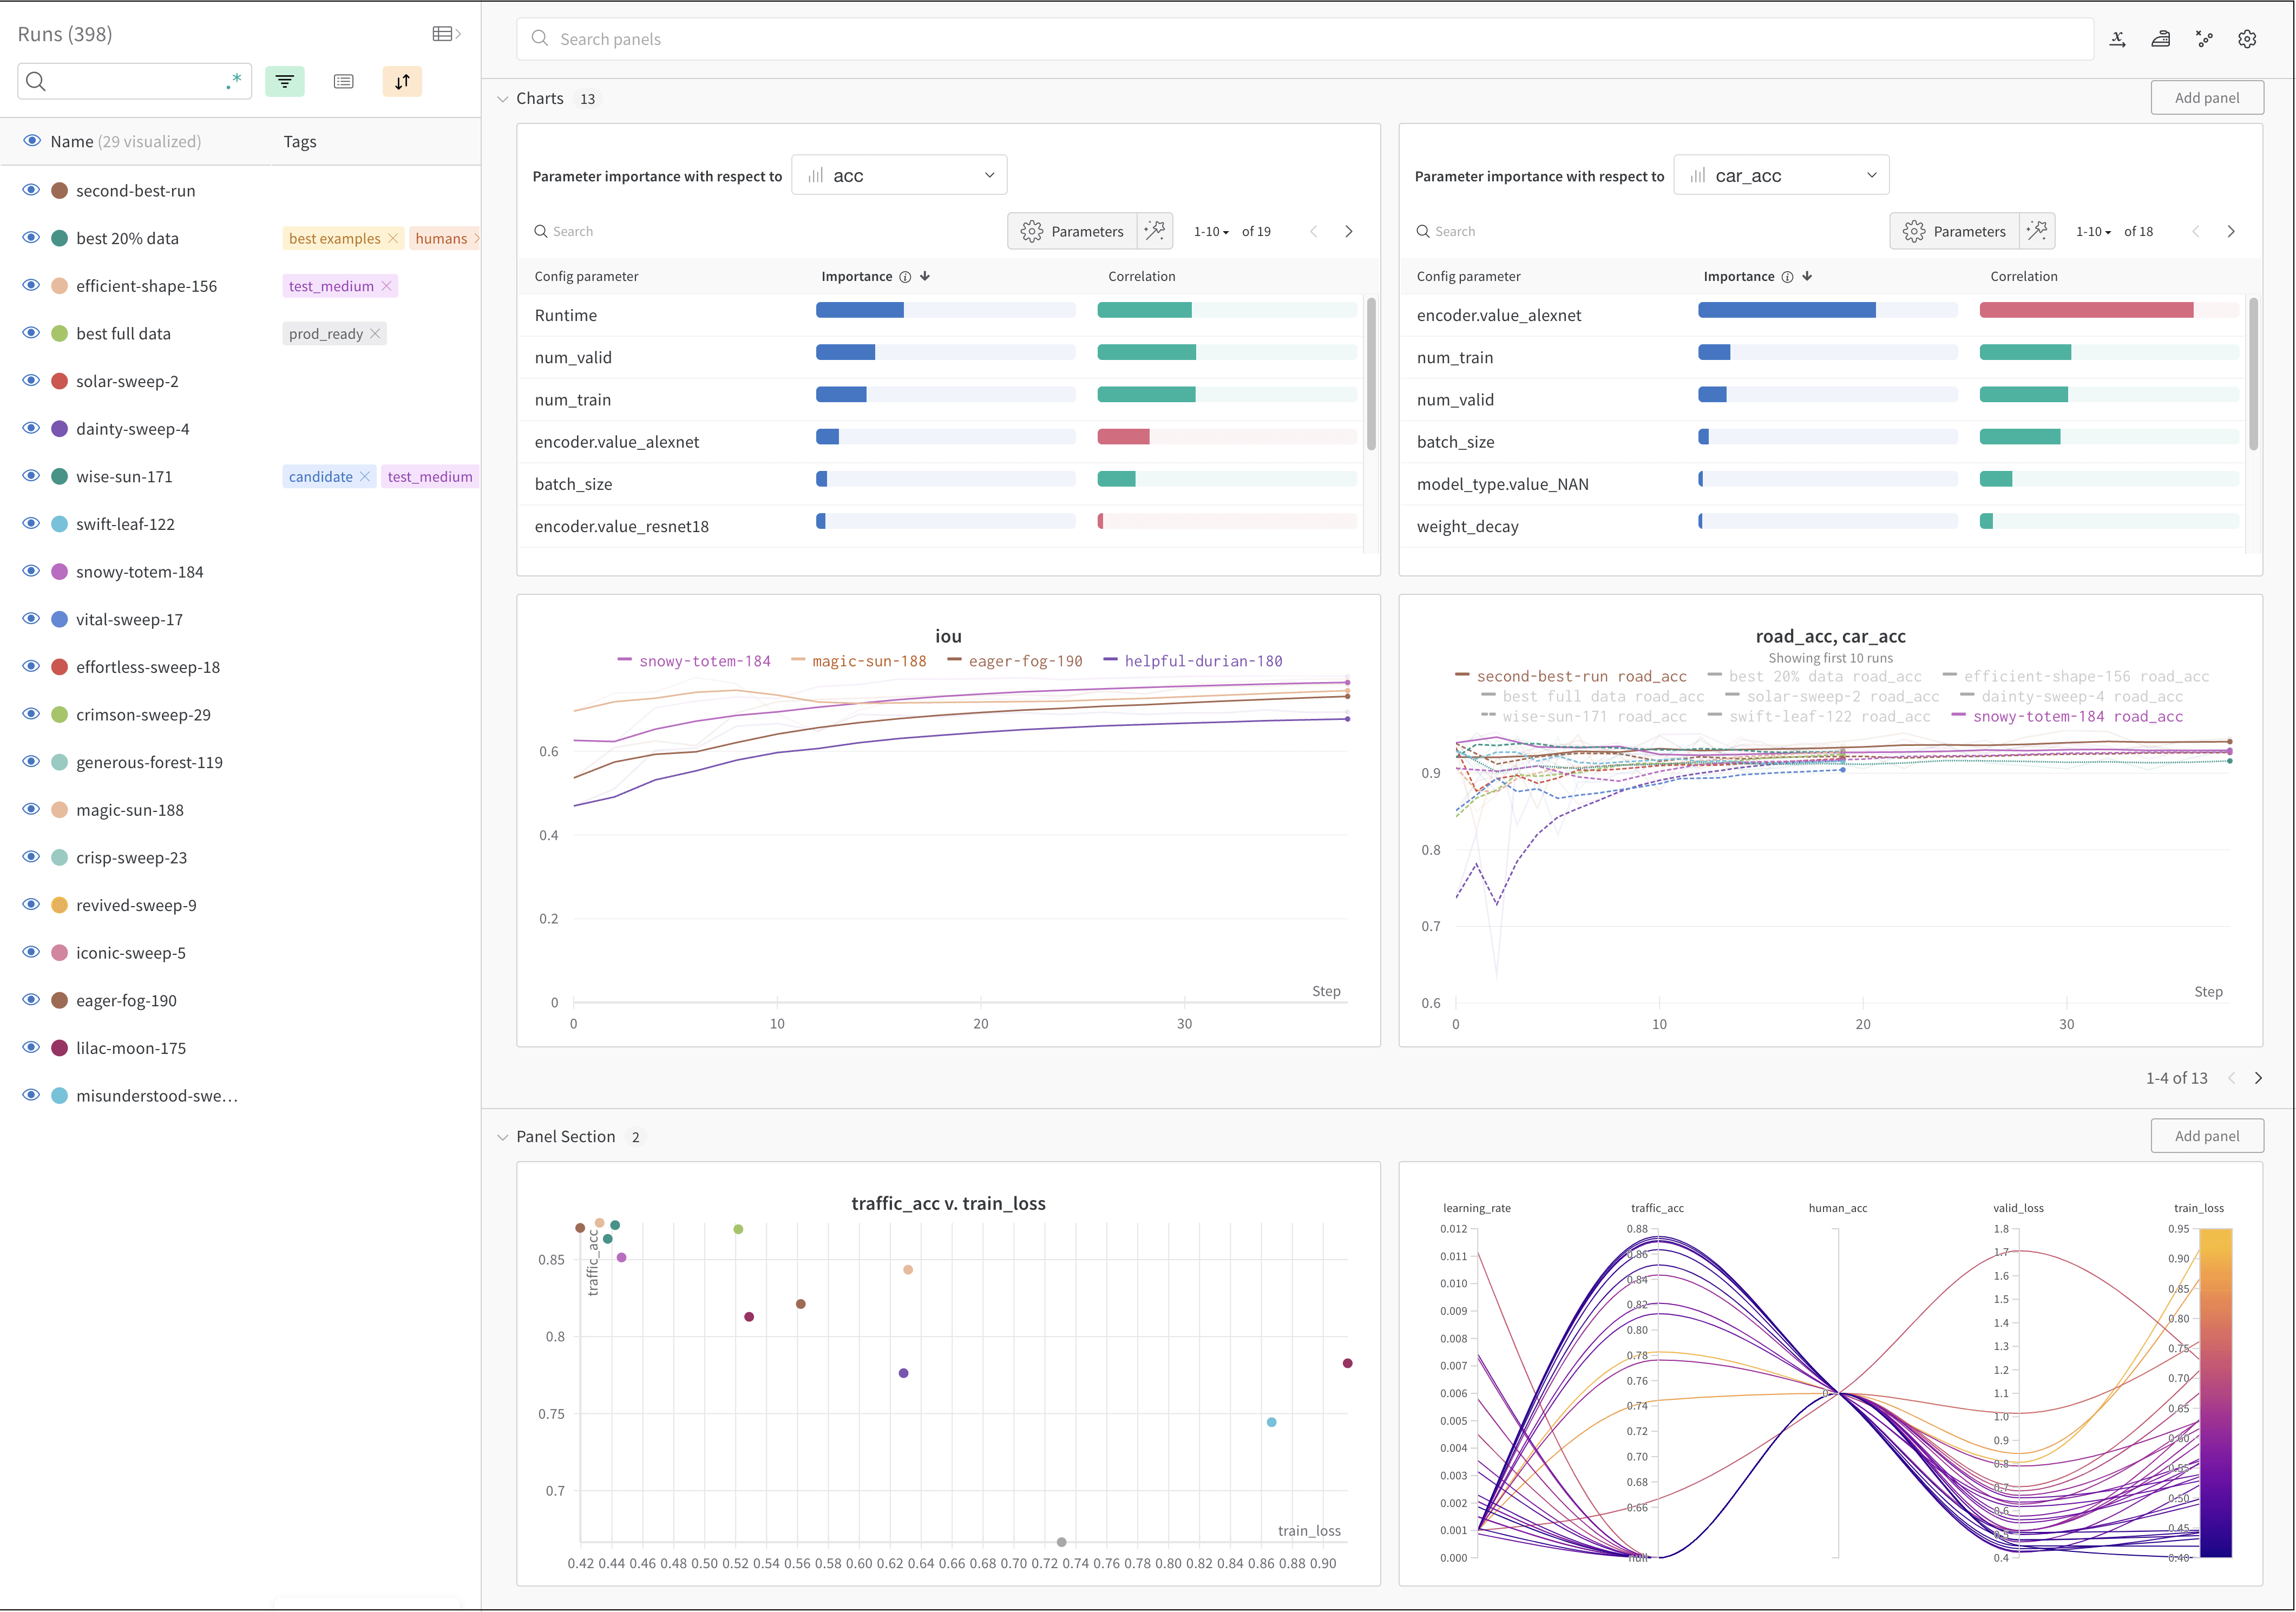
위 이미지는 여러 [run](/ko/products/wandb/runs)에서 메트릭을 보고 비교할 수 있는 예시 대시보드를 보여줍니다.

<h2 id="how-it-works">
  작동 방식
</h2>

몇 줄의 코드만으로 머신러닝 실험을 추적할 수 있습니다.

1. [W\&B Run](/ko/products/wandb/runs)을 생성합니다.
2. 학습률이나 모델 유형과 같은 하이퍼파라미터 딕셔너리를 설정([`wandb.Run.config`](/ko/products/wandb/track/config))에 저장합니다.
3. 트레이닝 루프에서 정확도, 손실과 같은 메트릭을 시간에 따라 로깅합니다([`wandb.Run.log()`](/ko/products/wandb/track/log)).
4. 모델 가중치나 예측 table과 같은 run의 출력을 저장합니다.

다음 코드는 일반적인 W\&B 실험 추적 워크플로를 보여줍니다. `my-team`을 W\&B 팀 entity로, `my-project-name`을 프로젝트 이름으로 바꾸세요.

```python theme={"system"}
import wandb

entity = "<my-team>"  # entity를 담당 W&B 팀 이름으로 설정하세요
project = "my-project-name"  # project를 W&B 프로젝트 이름으로 설정하세요

# 이 블록이 종료되면 로깅된 데이터가 업로드 완료될 때까지 기다립니다.
# 예외가 발생하면 run이 실패로 표시됩니다.
with wandb.init(entity=entity, project="my-project-name") as run:
  # 모델 입력과 하이퍼파라미터를 저장합니다.
  run.config.learning_rate = 0.01

  # 실험 코드를 실행합니다.
  for epoch in range(num_epochs):
    # 트레이닝을 수행합니다...

    # 모델 성능을 시각화하기 위해 메트릭을 시간 경과에 따라 로깅합니다.
    run.log({"loss": loss})

  # 모델 출력을 아티팩트로 업로드합니다.
  run.log_artifact(model)
```

<h2 id="get-started">
  Get started
</h2>

사용 사례에 따라 다음 리소스를 탐색하여 W\&B 실험을 시작하세요:

* [W\&B Quickstart](/ko/products/wandb/quickstart)를 조회하여 W\&B를 설정하고 첫 실험을 추적하는 방법을 알아보세요.
* [Get Started with W\&B Models](/ko/products/wandb/models_quickstart)를 사용해 보다 W\&B를 사용하여 머신 러닝 워크플로에서 모델 아티팩트를 추적, 공유 및 관리하는 방법을 알아보세요.
* 이 장을 탐색하여 다음을 배우세요:
  * [Create an 실험](/ko/products/wandb/track/create-an-experiment)
  * [Configure 실험](/ko/products/wandb/track/config)
  * [실험 데이터 로깅하기](/ko/products/wandb/track/log)
  * [View results from 실험](/ko/products/wandb/track/workspaces)
* [W\&B Python Library](/ko/products/wandb/ref/python)를 [W\&B API Reference Guide](/ko/products/wandb/ref/python) 내에서 탐색하세요.

<h2 id="best-practices-and-tips">
  모범 사례 및 팁
</h2>

실험 및 로깅에 대한 모범 사례와 팁은 [Best Practices: 실험 and Logging](https://forge.coreweave.com/wandb/wandb/pytorch-lightning-e2e/reports/W-B-Best-Practices-Guide--VmlldzozNTU1ODY1#w\&b-experiments-and-logging)를 참조하세요.