> ## Documentation Index
> Fetch the complete documentation index at: https://docs.coreweave.com/llms.txt
> Use this file to discover all available pages before exploring further.
> 画像分類、オーディオ、テキスト分析などのユースケースに応じた W&B 表の project の例を紹介します。
# 表の例
以下のセクションでは、表の活用方法をいくつか紹介します。
データを表示する
モデル トレーニングや評価の実行中にメトリクスとリッチメディアをログし、クラウドまたは[ホスティング インスタンス](/ja/products/wandb/platform/hosting)に同期される永続的なデータベース上で結果を可視化できます。
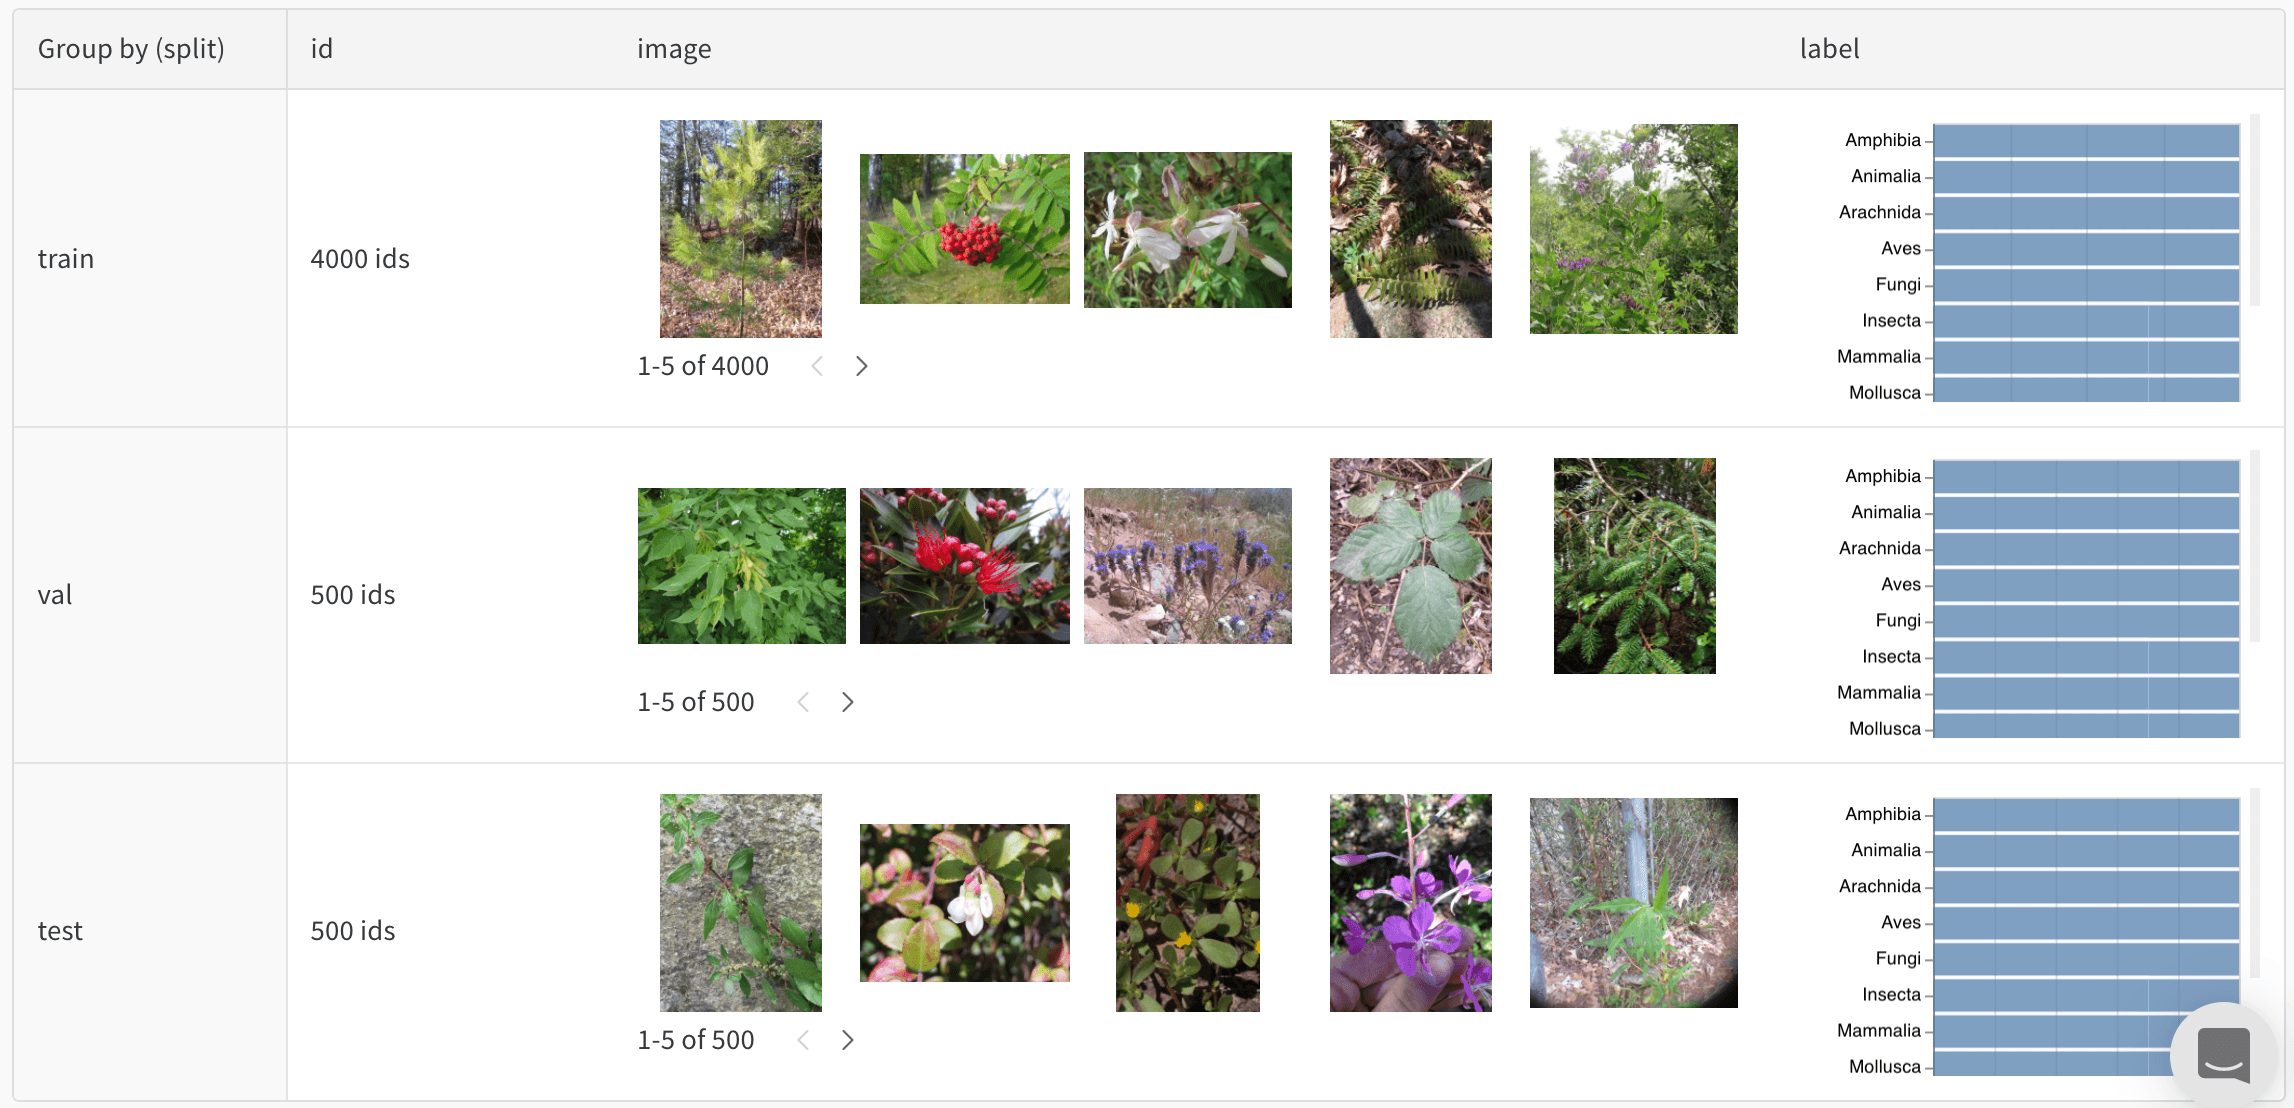 たとえば、こちらの表では[写真データセットをバランスよく分割した結果](https://forge.coreweave.com/wandb/stacey/mendeleev/artifacts/balanced_data/inat_80-10-10_5K/ab79f01e007113280018/files/data_split.table.json)を確認できます。
データをインタラクティブに探索する
表の表示、並べ替え、フィルター、グループ化、結合、クエリを行って、データとモデル性能を把握できます。静的なファイルを閲覧したり、分析スクリプトを再実行したりする必要はありません。
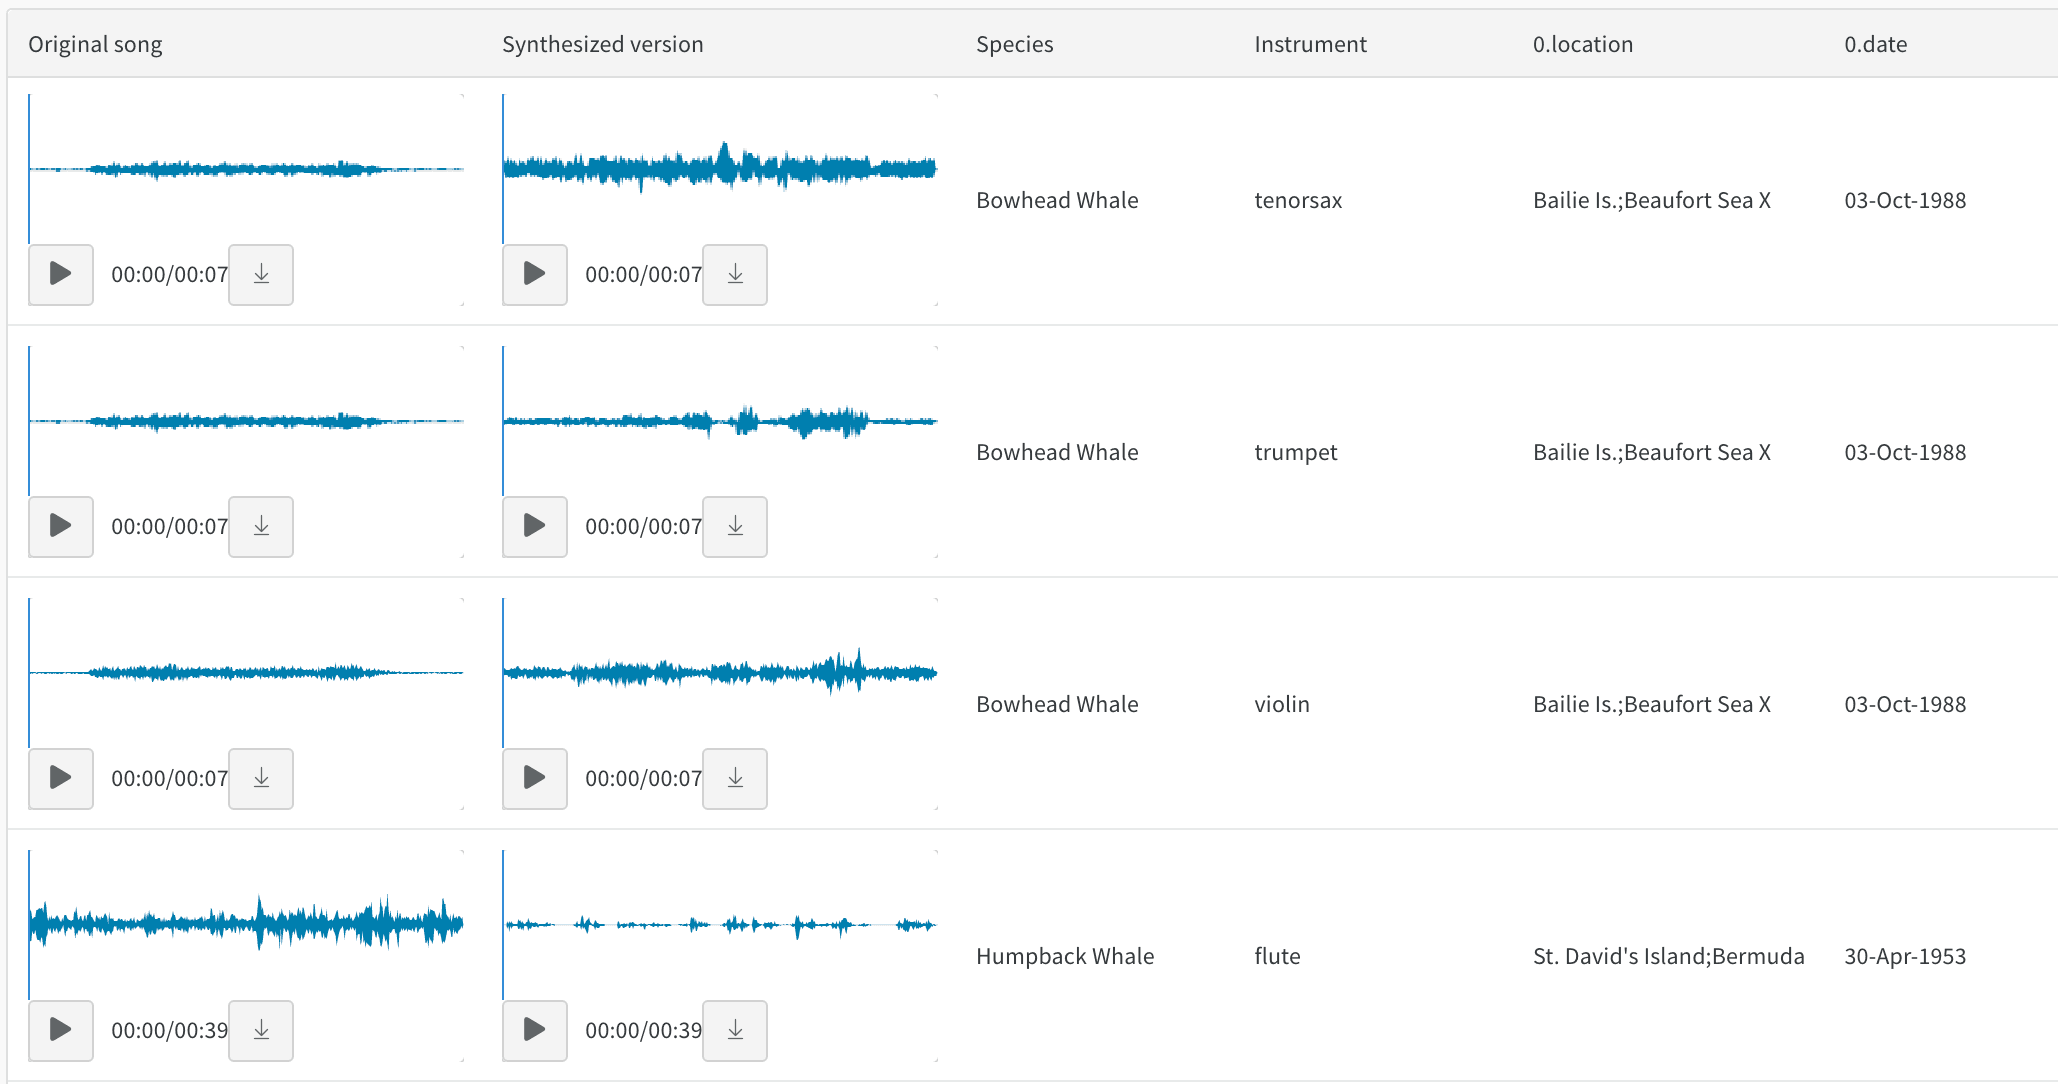 例として、[スタイル変換したオーディオ](https://forge.coreweave.com/wandb/stacey/cshanty/reports/Whale2Song-W-B-Tables-for-Audio--Vmlldzo4NDI3NzM)に関する report をご覧ください。
モデルのバージョンを比較する
トレーニングエポック、データセット、ハイパーパラメーターの選択、モデルアーキテクチャなどが異なる場合の結果をすばやく比較できます。
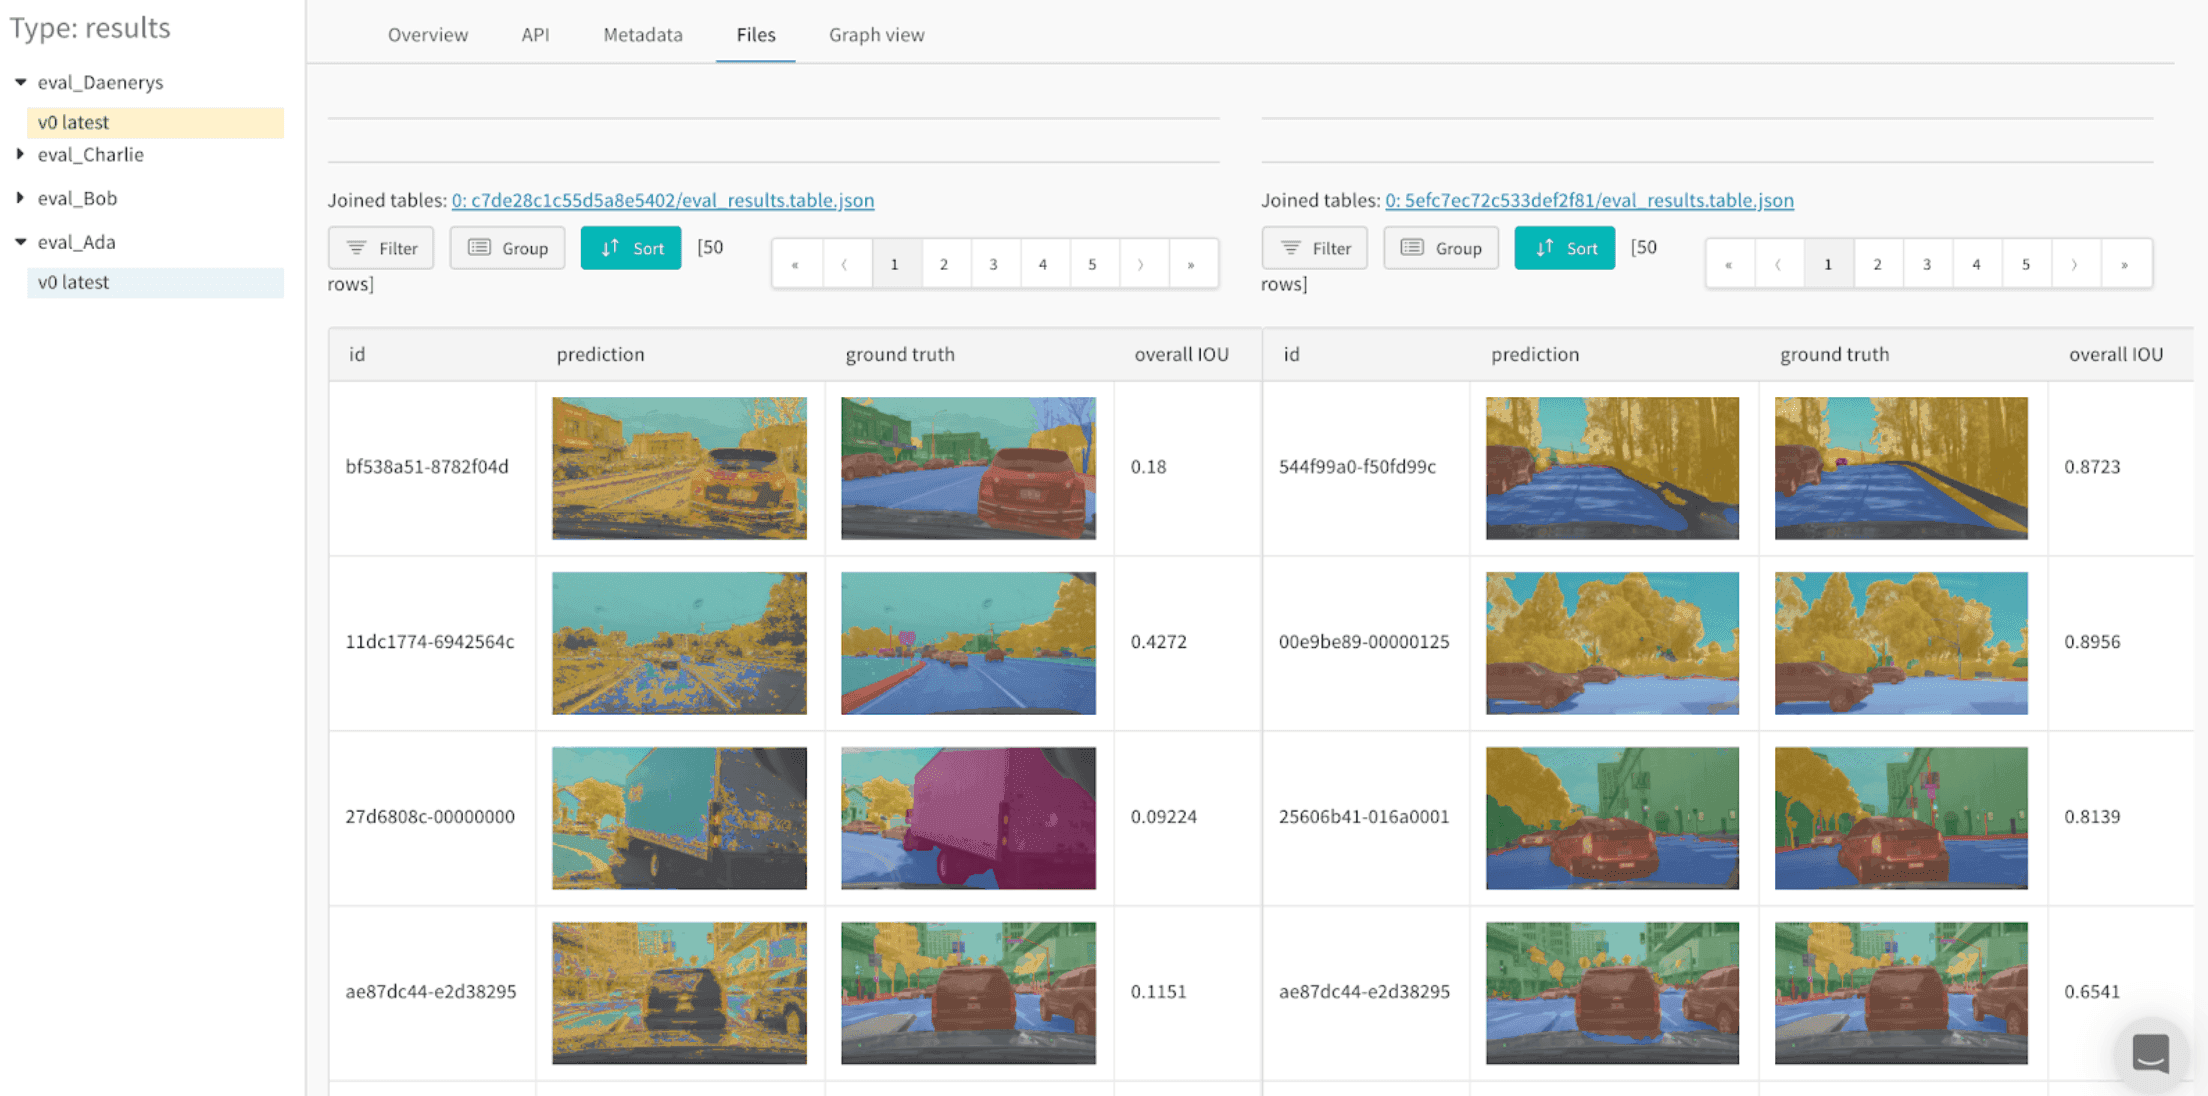
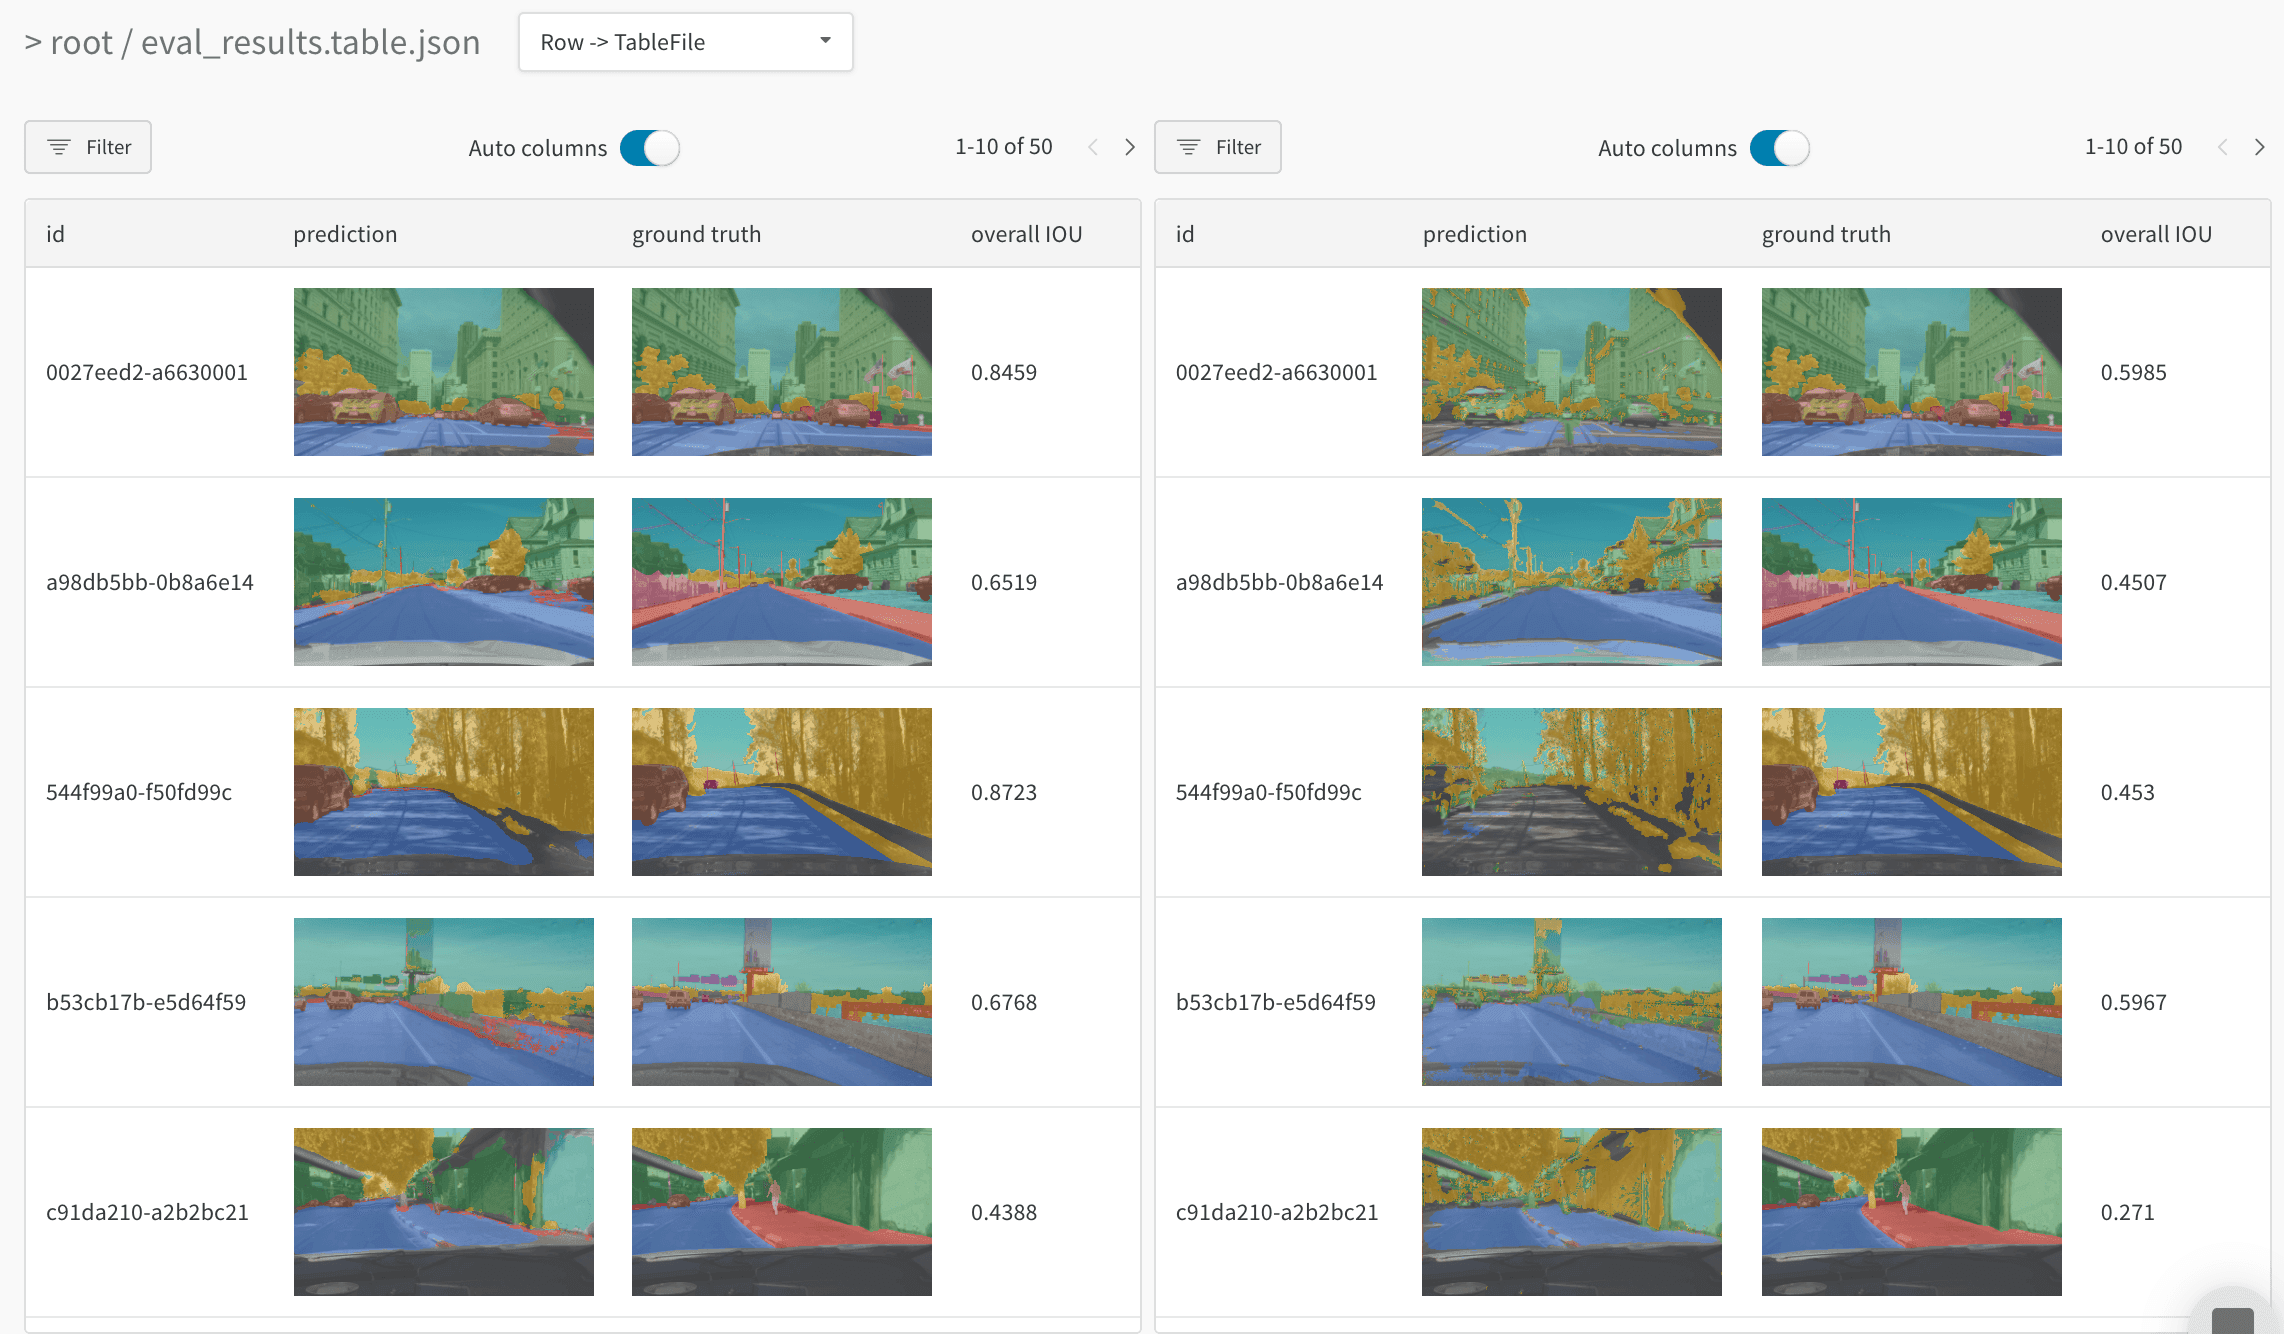 たとえば、[同じテスト画像で 2 つのモデル](https://forge.coreweave.com/wandb/stacey/evalserver_answers_2/artifacts/results/eval_Daenerys/c2290abd3d7274f00ad8/files/eval_results.table.json#b6dae62d4f00d31eeebf\$eval_Bob)を比較したこの表をご覧ください。
あらゆる詳細をトラッキングし、全体像を把握する
ズームインすると、特定の step における特定の予測を可視化できます。ズームアウトすると、集計統計を確認し、エラーのパターンを特定して、改善の余地を見つけられます。このツールは、1 回のモデル トレーニング内での step の比較にも、異なるモデル バージョン間での結果の比較にも使用できます。
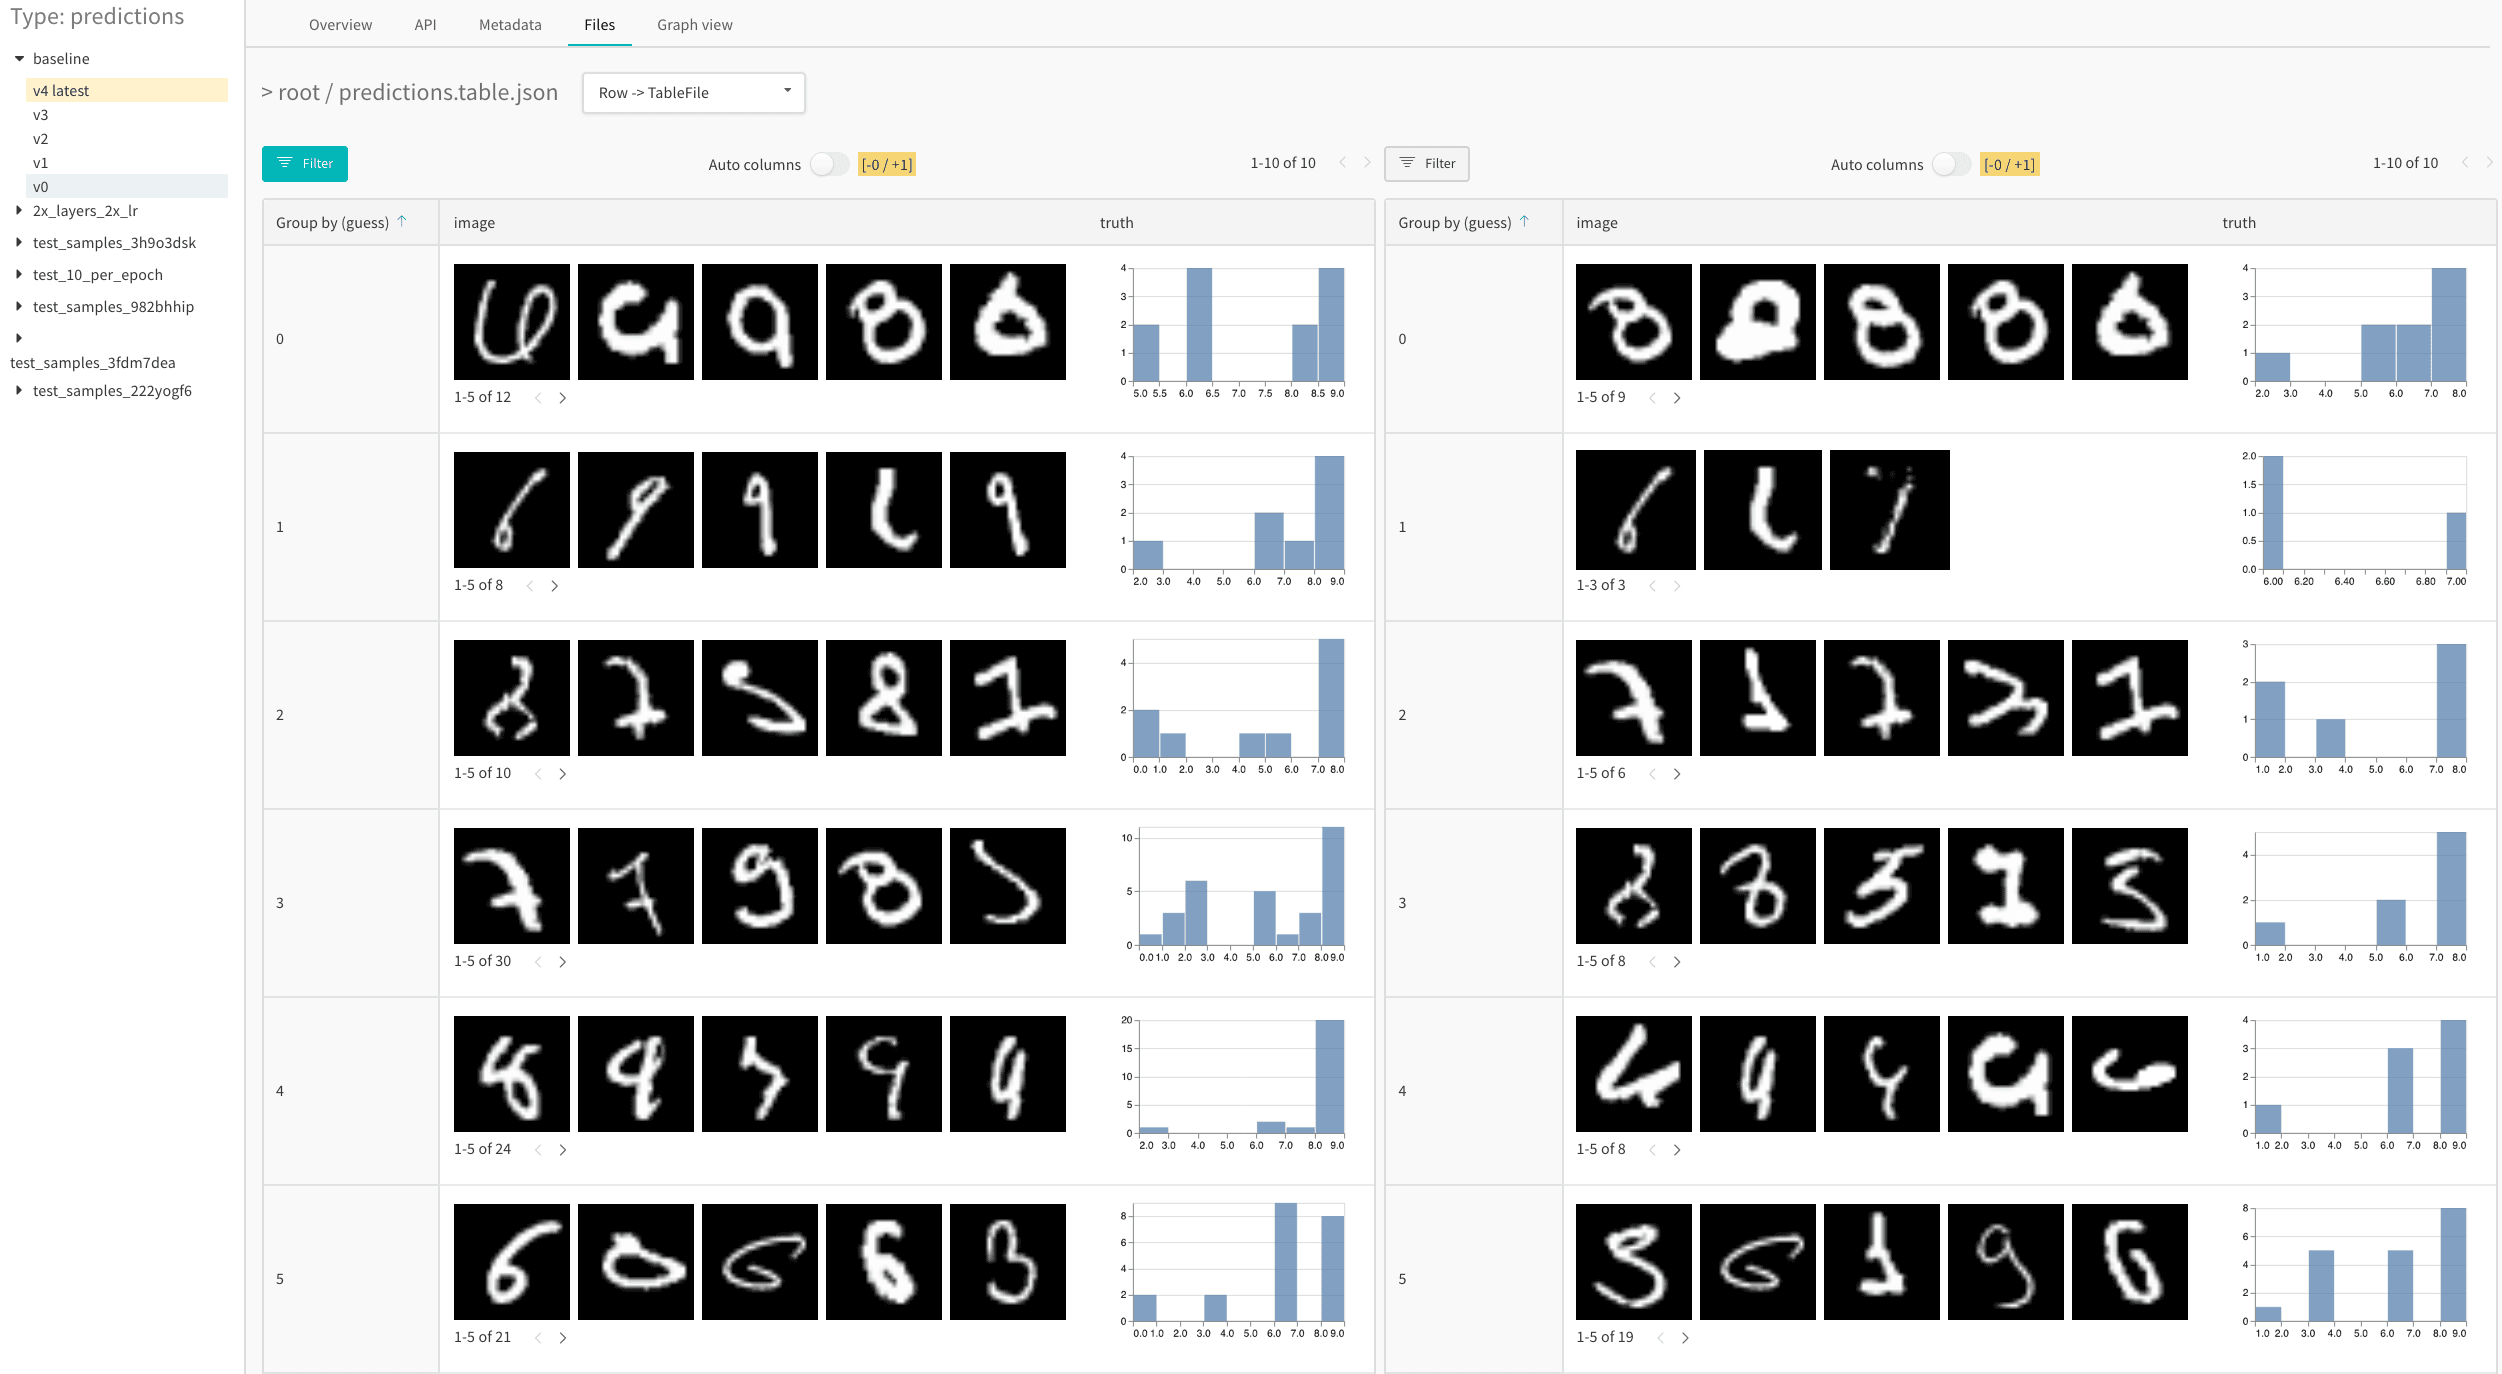 たとえば、[MNIST データセットで 1 エポック後と 5 エポック後](https://forge.coreweave.com/wandb/stacey/mnist-viz/artifacts/predictions/baseline/d888bc05719667811b23/files/predictions.table.json#7dd0cd845c0edb469dec)の結果を分析したサンプル表をご覧ください。
W\&B 表を使用した project の例
以下では、W\&B 表を使用している実際の W\&B project をいくつか紹介します。
画像分類
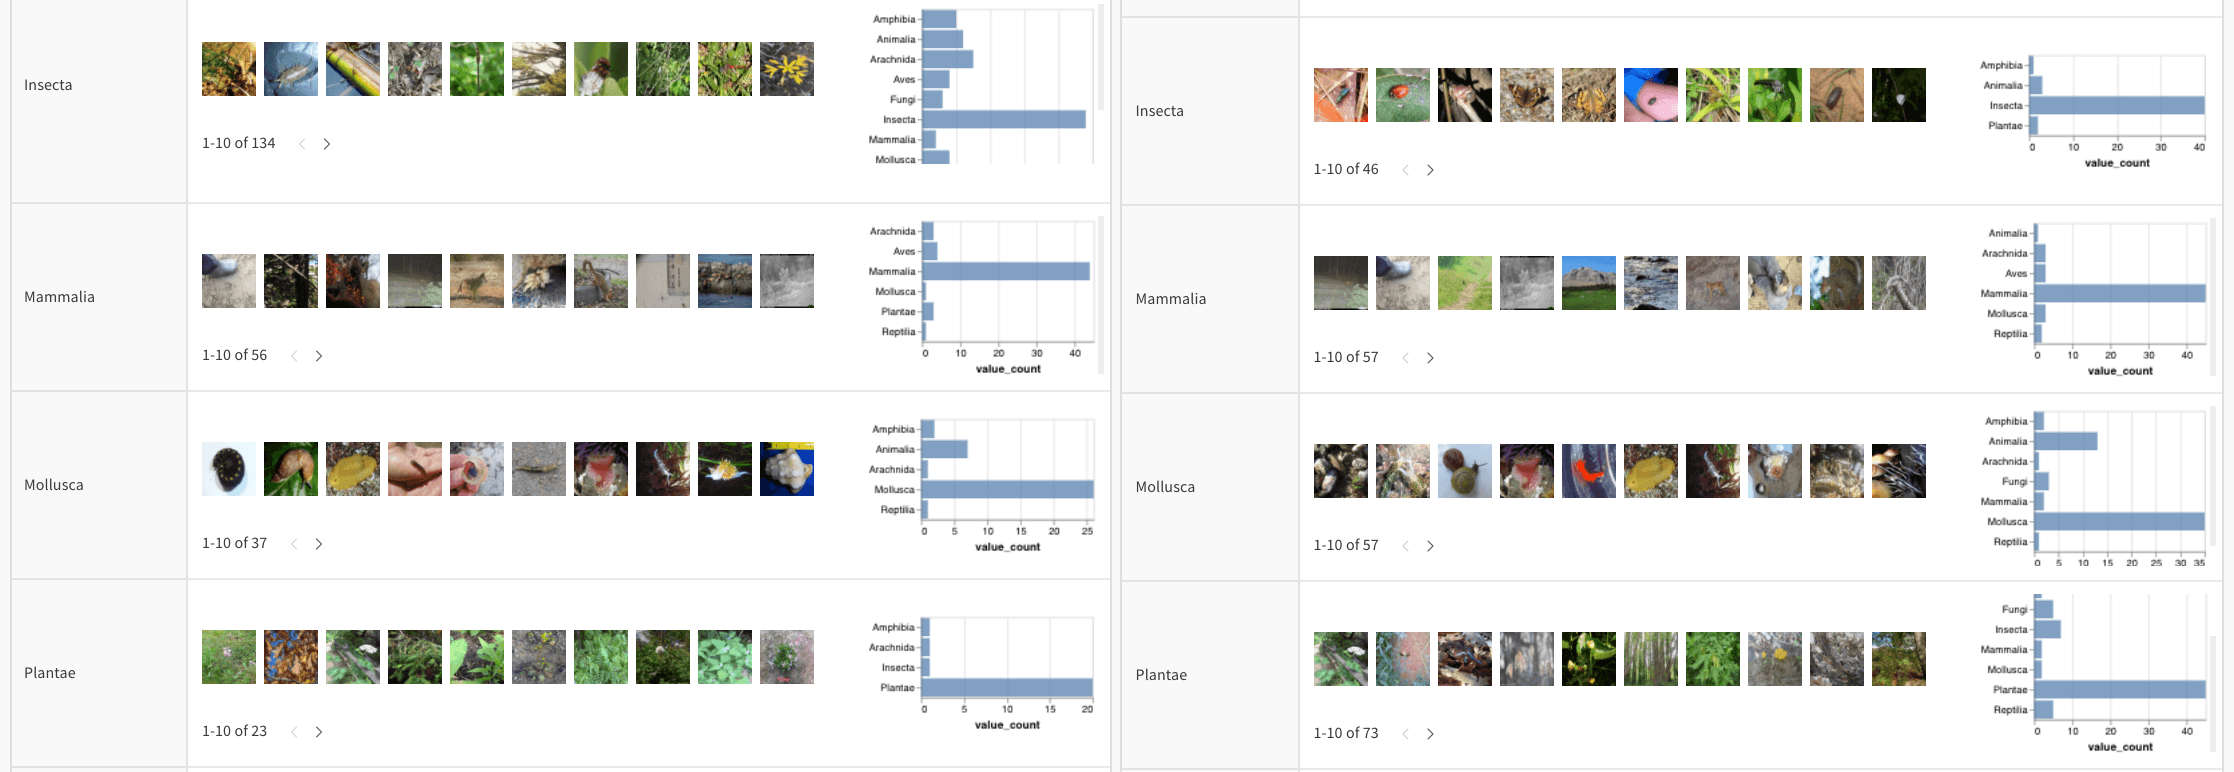
[iNaturalist](https://www.inaturalist.org/pages/developers) の写真に写った 10 種類の生物 (植物、鳥、昆虫など) を CNN がどのように識別するかについては、[Visualize Data for Image Classification](https://forge.coreweave.com/wandb/stacey/mendeleev/reports/Visualize-Data-for-Image-Classification--VmlldzozNjE3NjA) を読むか、[データ可視化 nature Colab](https://wandb.me/dsviz-nature-colab) を実行するか、[アーティファクトのコンテキスト](https://forge.coreweave.com/wandb/stacey/mendeleev/artifacts/val_epoch_preds/val_pred_gawf9z8j/2dcee8fa22863317472b/files/val_epoch_res.table.json) を参照してください。
オーディオ
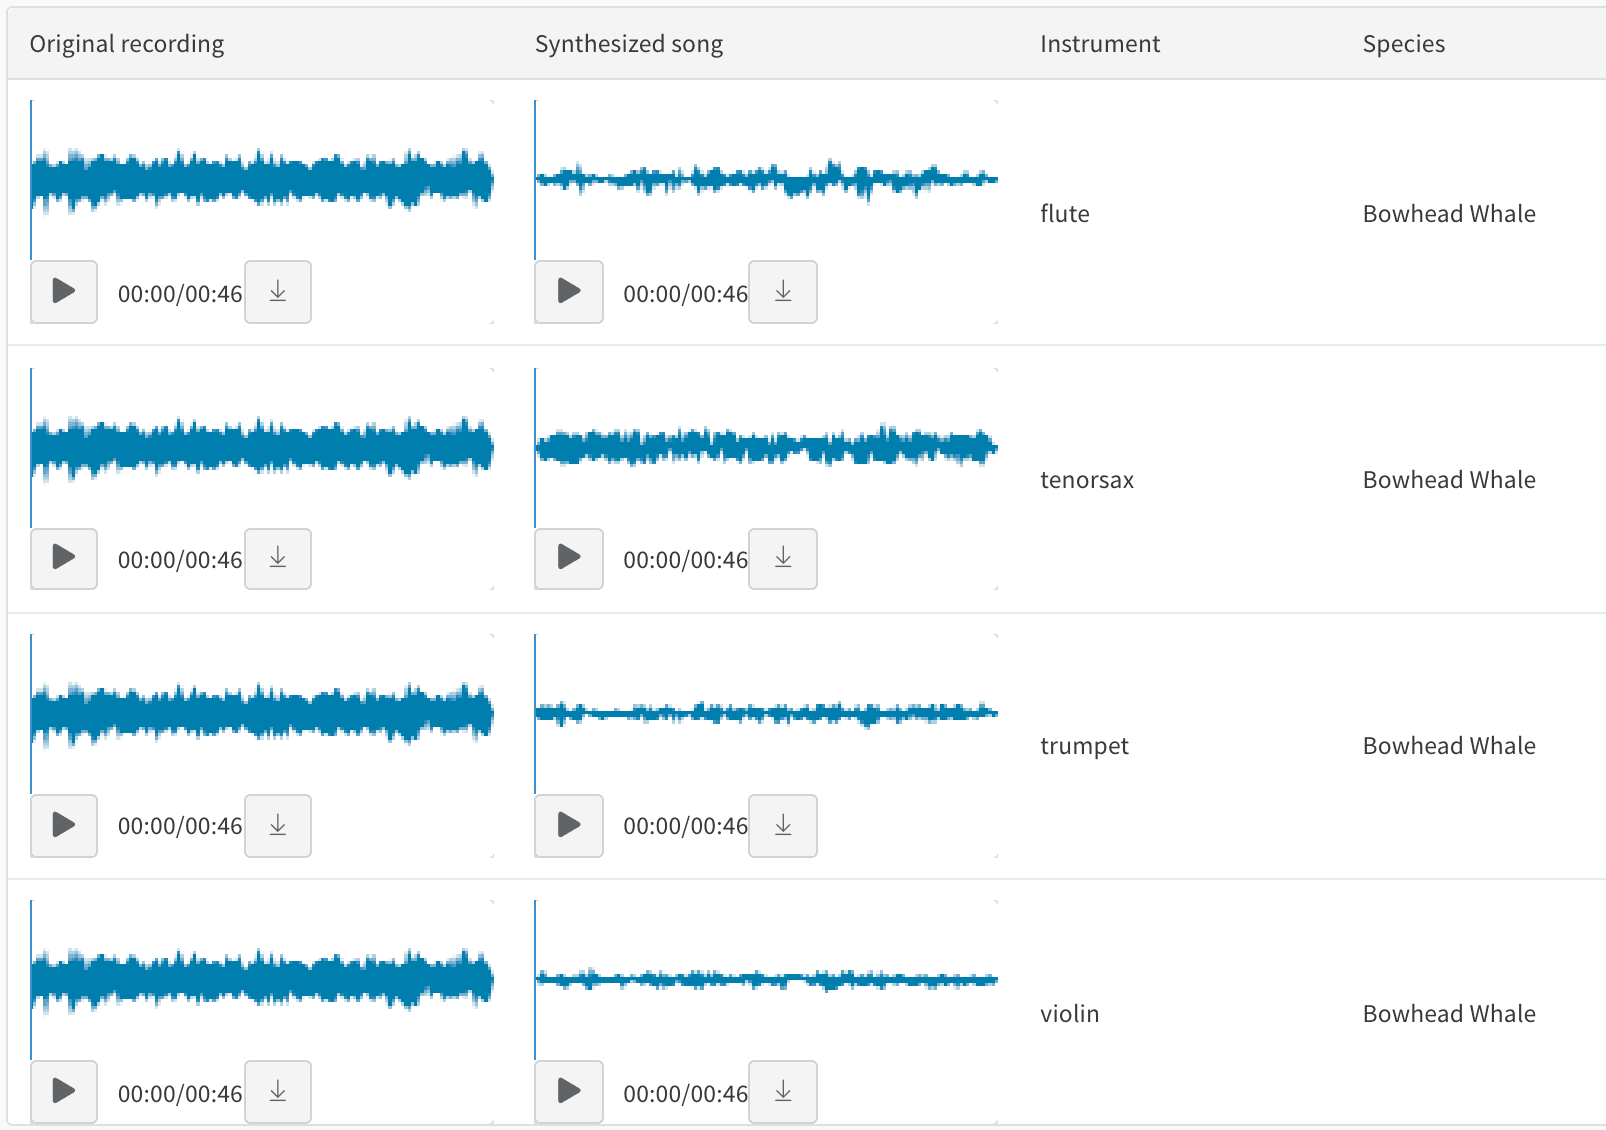
音色変換をテーマにした report [Whale2Song - W\&B Tables for Audio](https://forge.coreweave.com/wandb/stacey/cshanty/reports/Whale2Song-W-B-Tables-for-Audio--Vmlldzo4NDI3NzM) では、オーディオの表をインタラクティブに操作できます。録音したクジラの歌と、同じメロディーをバイオリンやトランペットなどの楽器で合成した演奏を聴き比べることができます。また、[オーディオ変換 Colab](http://wandb.me/audio-transfer) を使えば、自分の歌を録音し、その合成バージョンを W\&B で確認することもできます。
テキスト
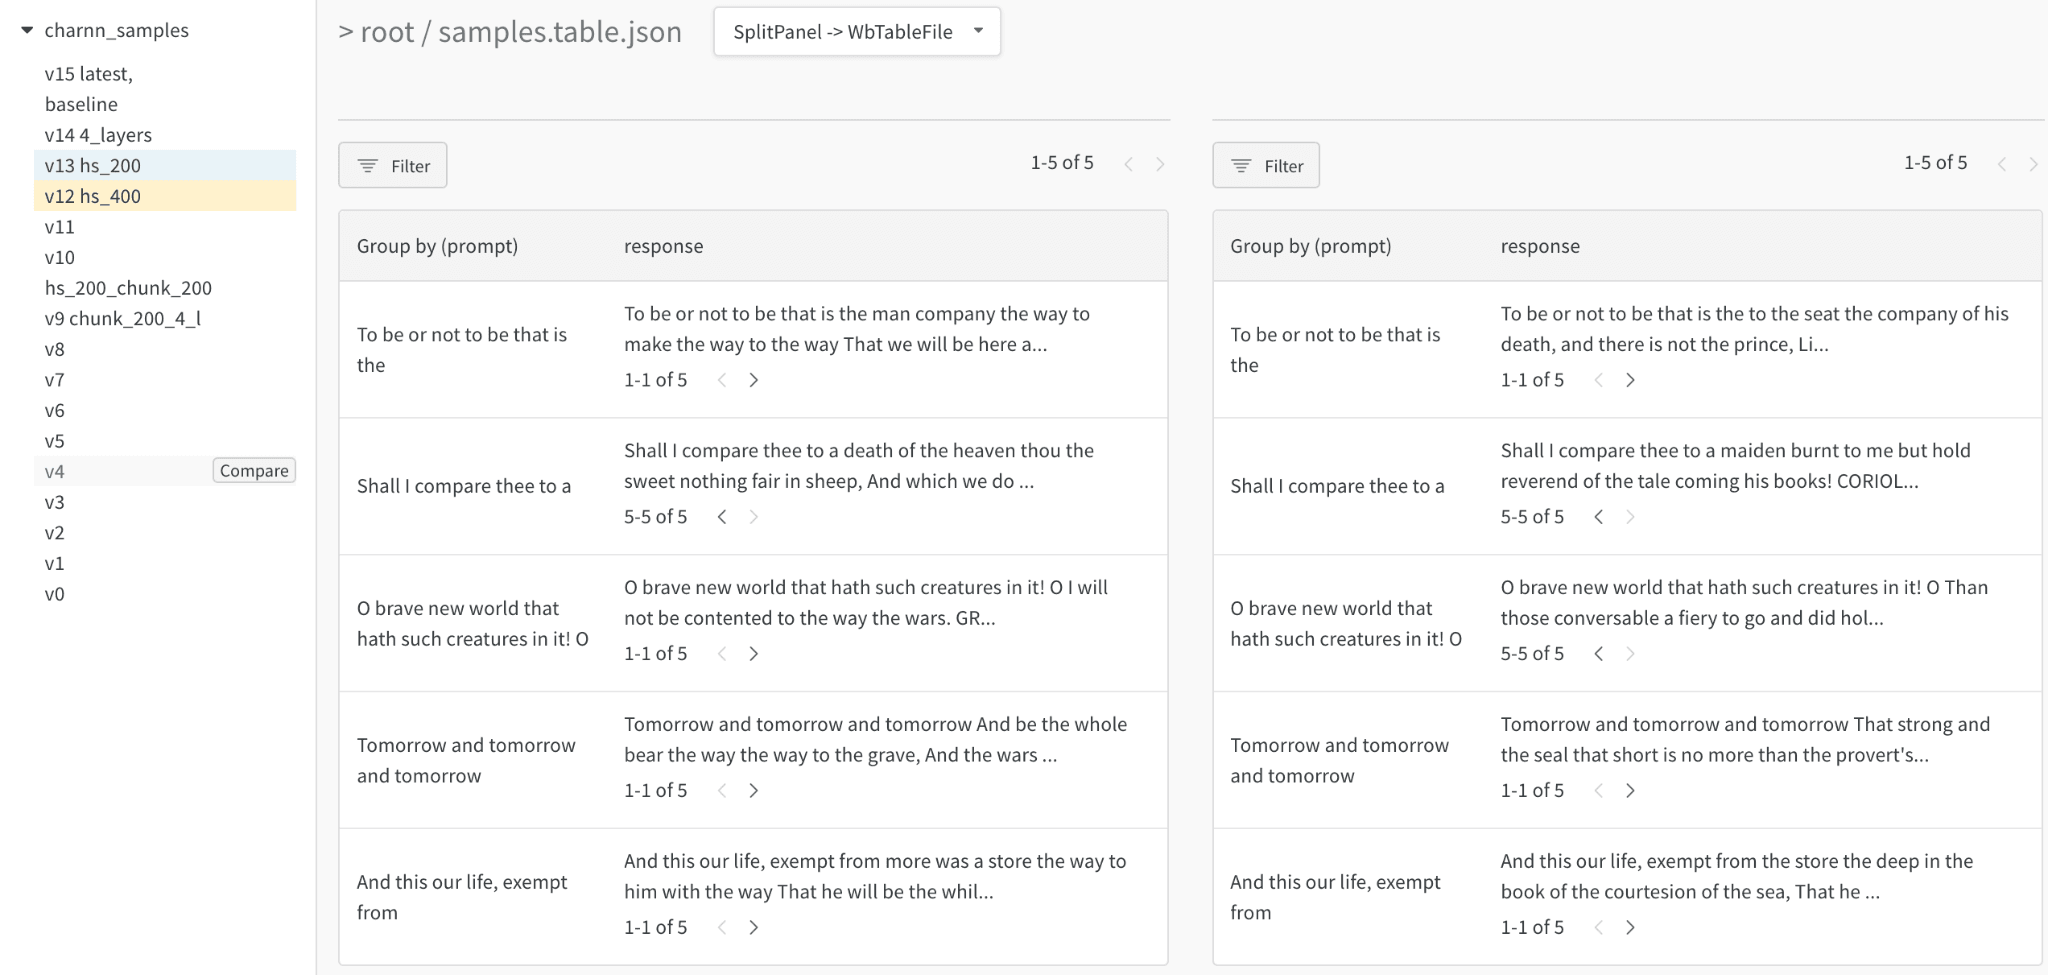
トレーニングデータや生成された出力のテキストサンプルを閲覧し、関連するフィールドで動的にグループ化して、モデルのバリアント間や実験設定間で評価の足並みを揃えることができます。テキストを Markdown としてレンダリングしたり、ビジュアル差分モードでテキストを比較したりできます。文字ベースの RNN の例については、[Shakespeare テキスト生成 report](https://forge.coreweave.com/wandb/stacey/nlg/reports/Visualize-Text-Data-Predictions--Vmlldzo1NzcwNzY) を参照してください。
動画
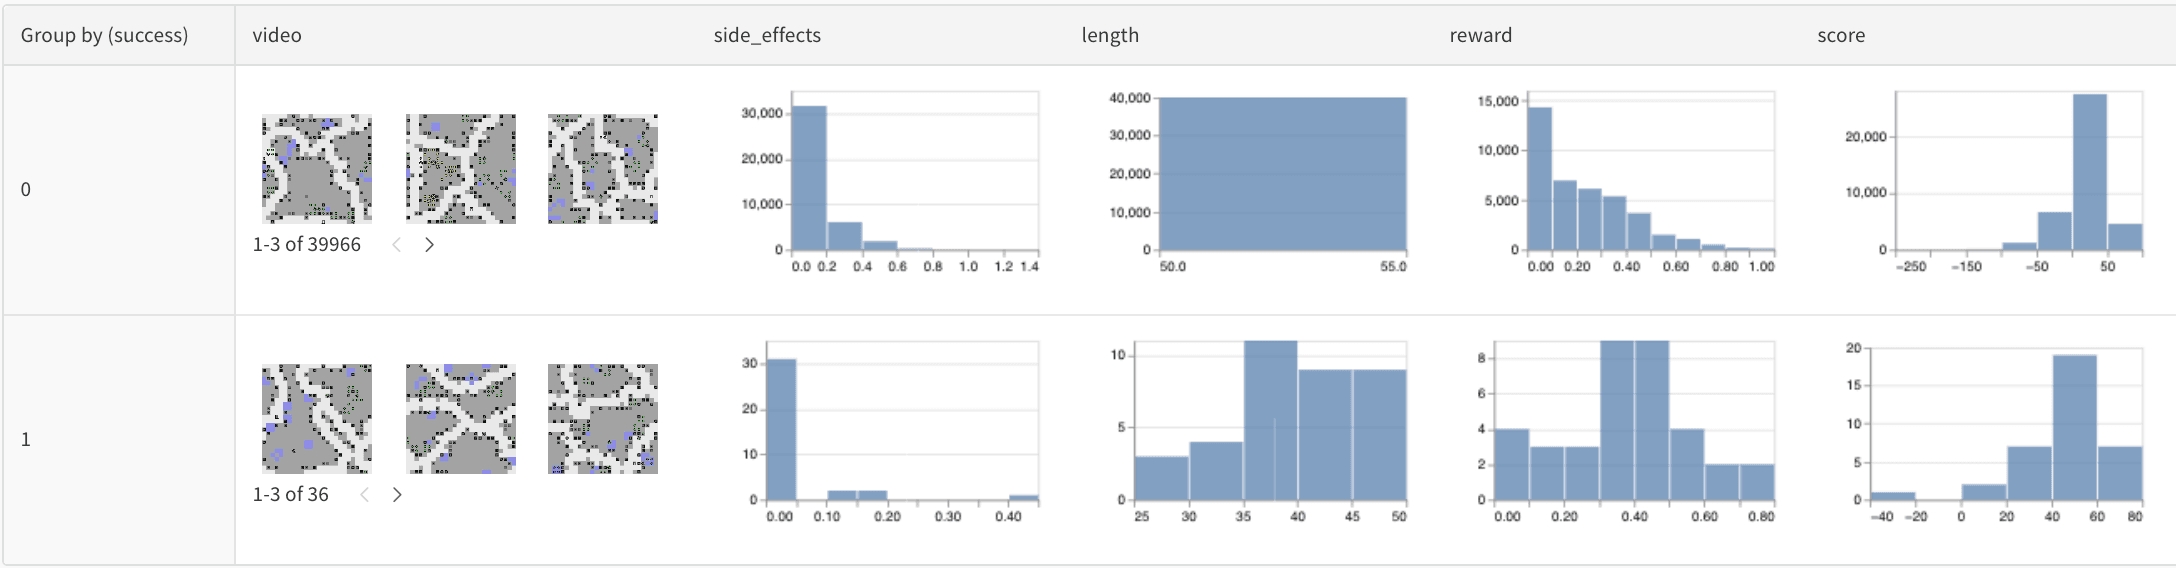
トレーニング中にログした動画を閲覧・集計して、モデルへの理解を深めましょう。以下は、[副作用の最小化](https://forge.coreweave.com/wandb/stacey/saferlife/artifacts/video/videos_append-spawn/c1f92c6e27fa0725c154/files/video_examples.table.json)を目指す RL エージェント向けの [SafeLife ベンチマーク](https://forge.coreweave.com/wandb/safelife/v1dot2/benchmark)を使用した初期の例です。
表形式データ
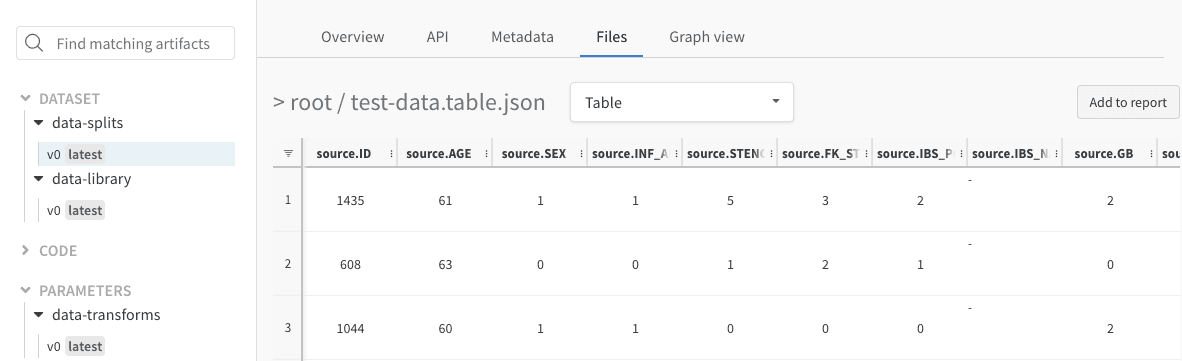
バージョン管理と重複排除を行いながら[表形式データを分割・前処理する](https://forge.coreweave.com/wandb/dpaiton/splitting-tabular-data/reports/Tabular-Data-Versioning-and-Deduplication-with-Weights-Biases--VmlldzoxNDIzOTA1)方法については、こちらの report をご覧ください。
モデルのバリアントを比較する (セマンティックセグメンテーション)
セマンティックセグメンテーション向けに Tables をログし、複数のモデルを比較する[インタラクティブなノートブック](https://wandb.me/dsviz-cars-demo)と[ライブデモ](https://forge.coreweave.com/wandb/stacey/evalserver_answers_2/artifacts/results/eval_Daenerys/c2290abd3d7274f00ad8/files/eval_results.table.json#a57f8e412329727038c2\$eval_Ada)です。[こちらの表](https://forge.coreweave.com/wandb/stacey/evalserver_answers_2/artifacts/results/eval_Daenerys/c2290abd3d7274f00ad8/files/eval_results.table.json)で、独自のクエリを試してみてください。
トレーニング中の改善度の分析
[予測を時系列で可視化する](https://forge.coreweave.com/wandb/stacey/mnist-viz/reports/Visualize-Predictions-over-Time--Vmlldzo1OTQxMTk)方法を詳しく解説した report と、付属の[インタラクティブなノートブック](https://wandb.me/dsviz-mnist-colab)です。
## Related topics
- [表の作成](/ja/products/wandb/weave/reference/service-api/tables/table-create.md)