> ## Documentation Index
> Fetch the complete documentation index at: https://docs.coreweave.com/llms.txt
> Use this file to discover all available pages before exploring further.
# W&B Weave と W&B 表 を使用したモデルの評価
> W&B Weave と W&B 表 を使用して機械学習モデルを評価する方法を学びます。
Weave でモデルを評価する
[W\&B Weave](/ja/products/wandb/weave) は、LLM および GenAI アプリケーションの評価向けに設計されたツールキットです。Scorer、judge、詳細なトレースを含む包括的な評価機能を提供し、モデル性能の理解と改善を支援します。Weave は W\&B Models と連携し、モデルレジストリに保存されたモデルを評価できます。

モデル評価の主要な機能
* **Scorers and judges**: 精度、関連性、一貫性などに対応した、事前構築済みおよびカスタムの評価メトリクス
* **評価データセット**: 体系的な評価のためのグラウンドトゥルースを備えた構造化されたテストセット
* **モデルのバージョン管理**: モデルの異なるバージョンをトラッキングし、比較します
* **詳細なトレース**: 完全な入出力トレースでモデルの動作をデバッグします
* **コストトラッキング**: 評価全体の API コストとトークン使用量を監視します
はじめに: Registry からモデルを評価する
W\&B Models Registry からモデルをダウンロードし、Weave を使用して評価します:
```python theme={"system"}
import weave
import wandb
from typing import Any
# Weave を初期化する
weave.init("your-entity/your-project")
# Registry から読み込む ChatModel を定義する
class ChatModel(weave.Model):
model_name: str
def model_post_init(self, __context):
# W&B Models Registry からモデルをダウンロードする
with wandb.init(project="your-project", job_type="model_download") as run:
artifact = run.use_artifact(self.model_name)
self.model_path = artifact.download()
# ここでモデルを初期化する
@weave.op()
async def predict(self, query: str) -> str:
# モデルの推論ロジック
return self.model.generate(query)
# 評価データセットを作成する
dataset = weave.Dataset(name="eval_dataset", rows=[
{"input": "What is the capital of France?", "expected": "Paris"},
{"input": "What is 2+2?", "expected": "4"},
])
# スコアラーを定義する
@weave.op()
def exact_match_scorer(expected: str, output: str) -> dict:
return {"correct": expected.lower() == output.lower()}
# 評価を実行する
model = ChatModel(model_name="wandb-entity/registry-name/model:version")
evaluation = weave.Evaluation(
dataset=dataset,
scorers=[exact_match_scorer]
)
results = await evaluation.evaluate(model)
```
Weave の評価を W\&B Models と統合する
[Models と Weave のインテグレーション例](/ja/products/wandb/weave/cookbooks/Models_and_Weave_Integration_Demo) は、以下の完全なワークフローを示しています:
1. **Registry からモデルをロードする**: W\&B Models Registry に保存されたファインチューニングしたモデルをダウンロードします
2. **評価パイプラインを作成する**: カスタム Scorer を使用して包括的な評価を構築します
3. **結果を W\&B にログする**: 評価メトリクスをモデルの run に接続します
4. **評価済みモデルをバージョン管理する**: 改善されたモデルを Registry に保存します
評価結果を Weave と W\&B Models の両方にログします:
```python theme={"system"}
# W&B トラッキングで評価を実行
with weave.attributes({"wandb-run-id": wandb.run.id}):
summary, call = await evaluation.evaluate.call(evaluation, model)
# W&B Models にメトリクスをログする
wandb.run.log(summary)
wandb.run.config.update({
"weave_eval_url": f"https://wandb.ai/{entity}/{project}/r/call/{call.id}"
})
```
Weave の高度な機能
Custom scorers and judges
あなたのユースケースに合わせた高度な評価メトリクスを作成します:
```python theme={"system"}
@weave.op()
def llm_judge_scorer(expected: str, output: str, judge_model) -> dict:
prompt = f"Is this answer correct? Expected: {expected}, Got: {output}"
judgment = await judge_model.predict(prompt)
return {"judge_score": judgment}
```
バッチ評価
複数のモデルバージョンまたは設定を評価します:
```python theme={"system"}
models = [
ChatModel(model_name="model:v1"),
ChatModel(model_name="model:v2"),
]
for model in models:
results = await evaluation.evaluate(model)
print(f"{model.model_name}: {results}")
```
次のステップ
* [Weave 評価チュートリアルを完了する](/ja/products/wandb/weave/tutorial-eval)
* [Models と Weave のインテグレーションの例](/ja/products/wandb/weave/cookbooks/Models_and_Weave_Integration_Demo)
表でモデルを評価する
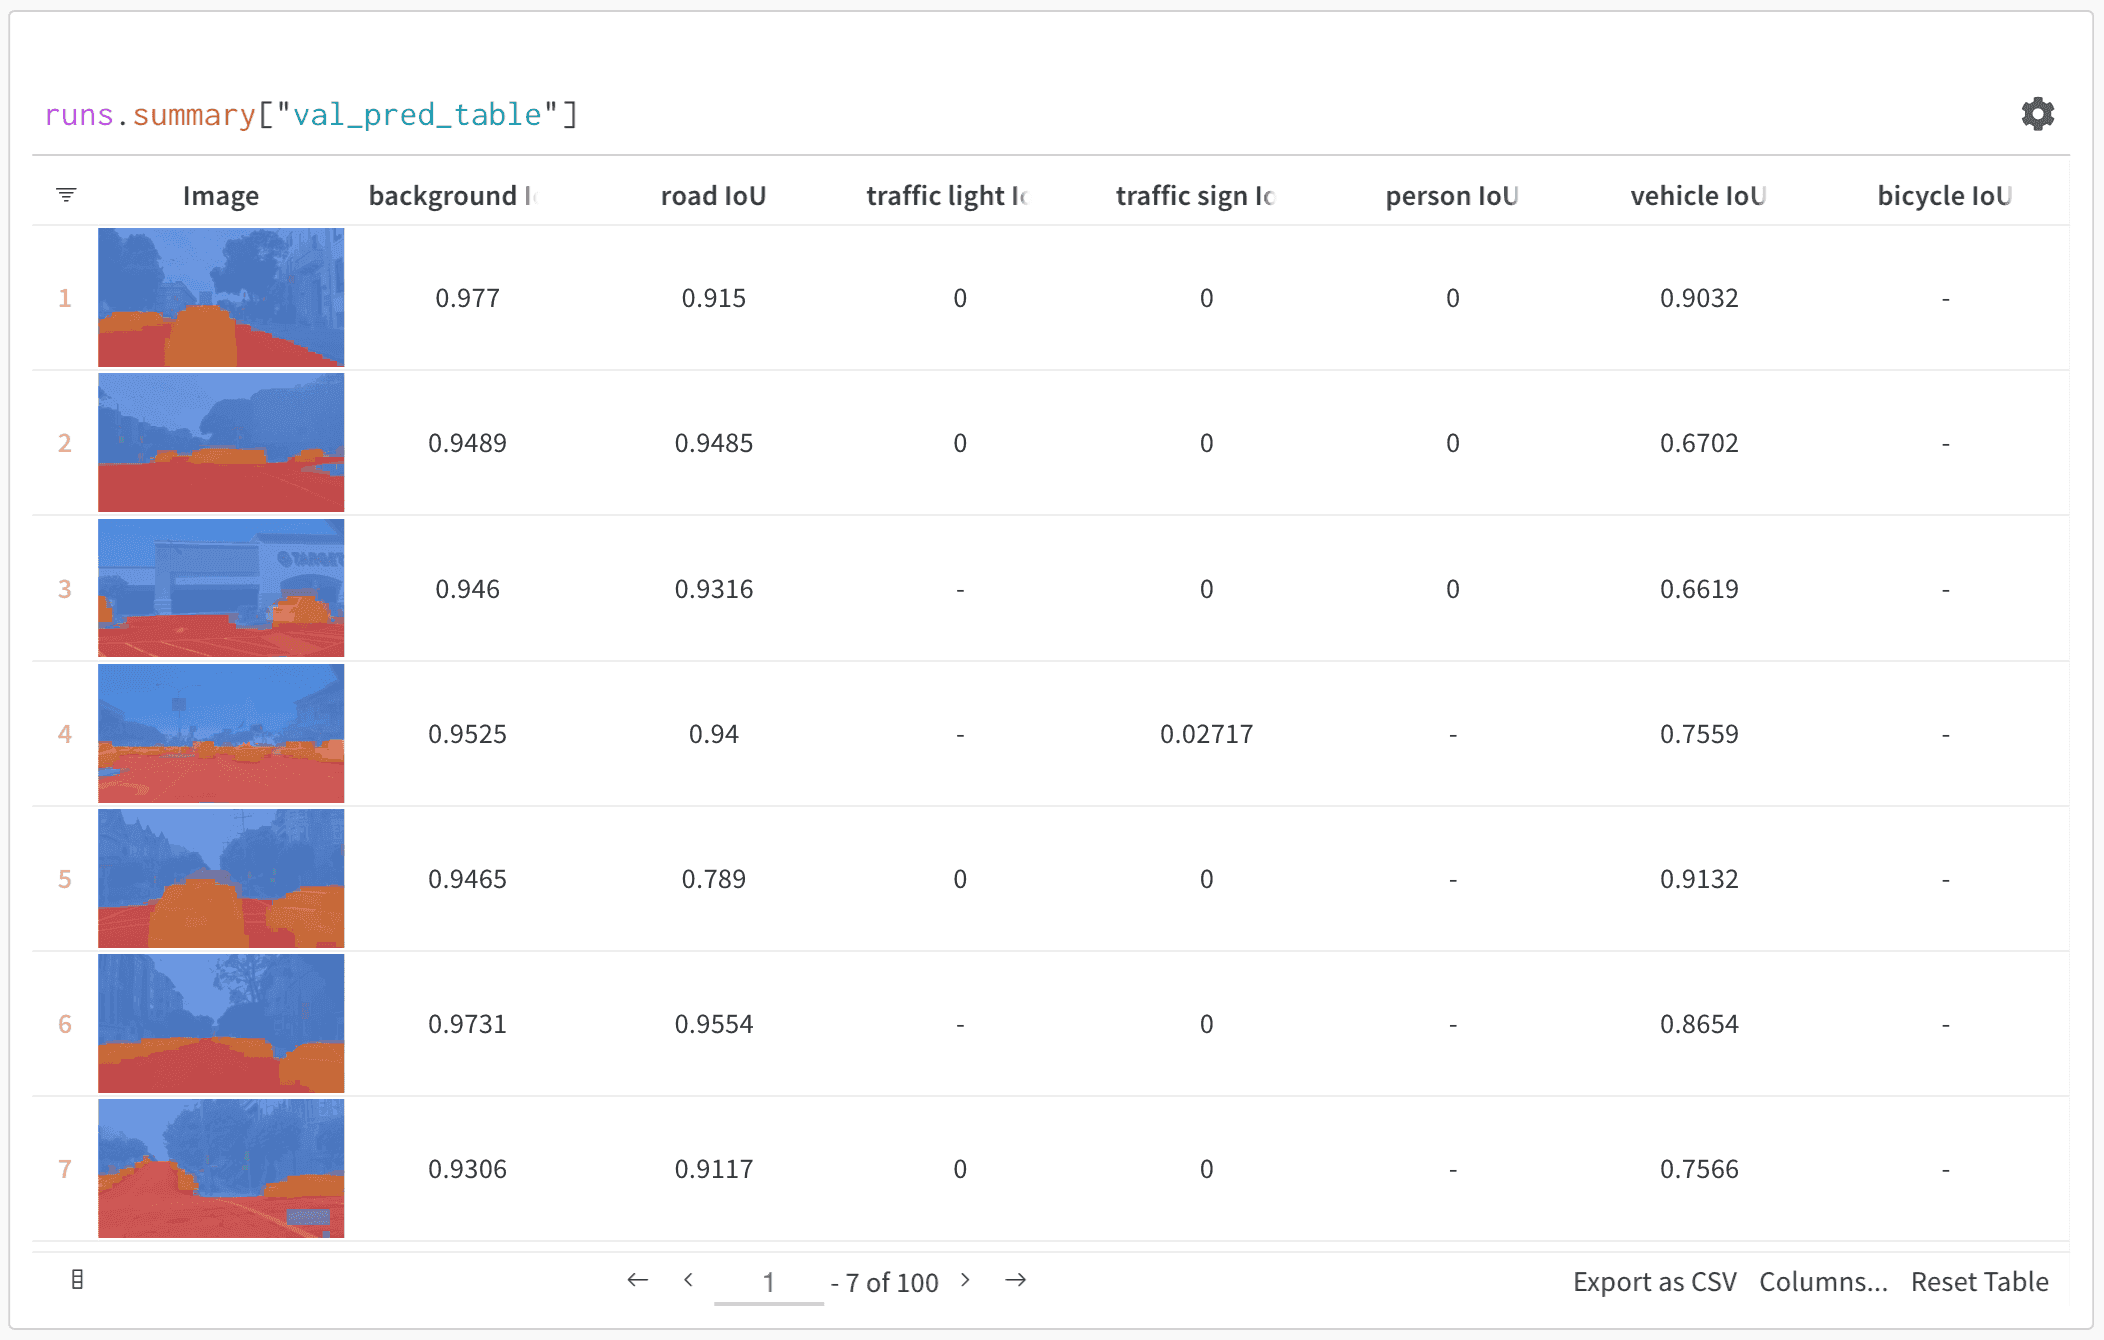
W\&B 表を使用すると、次のことができます:
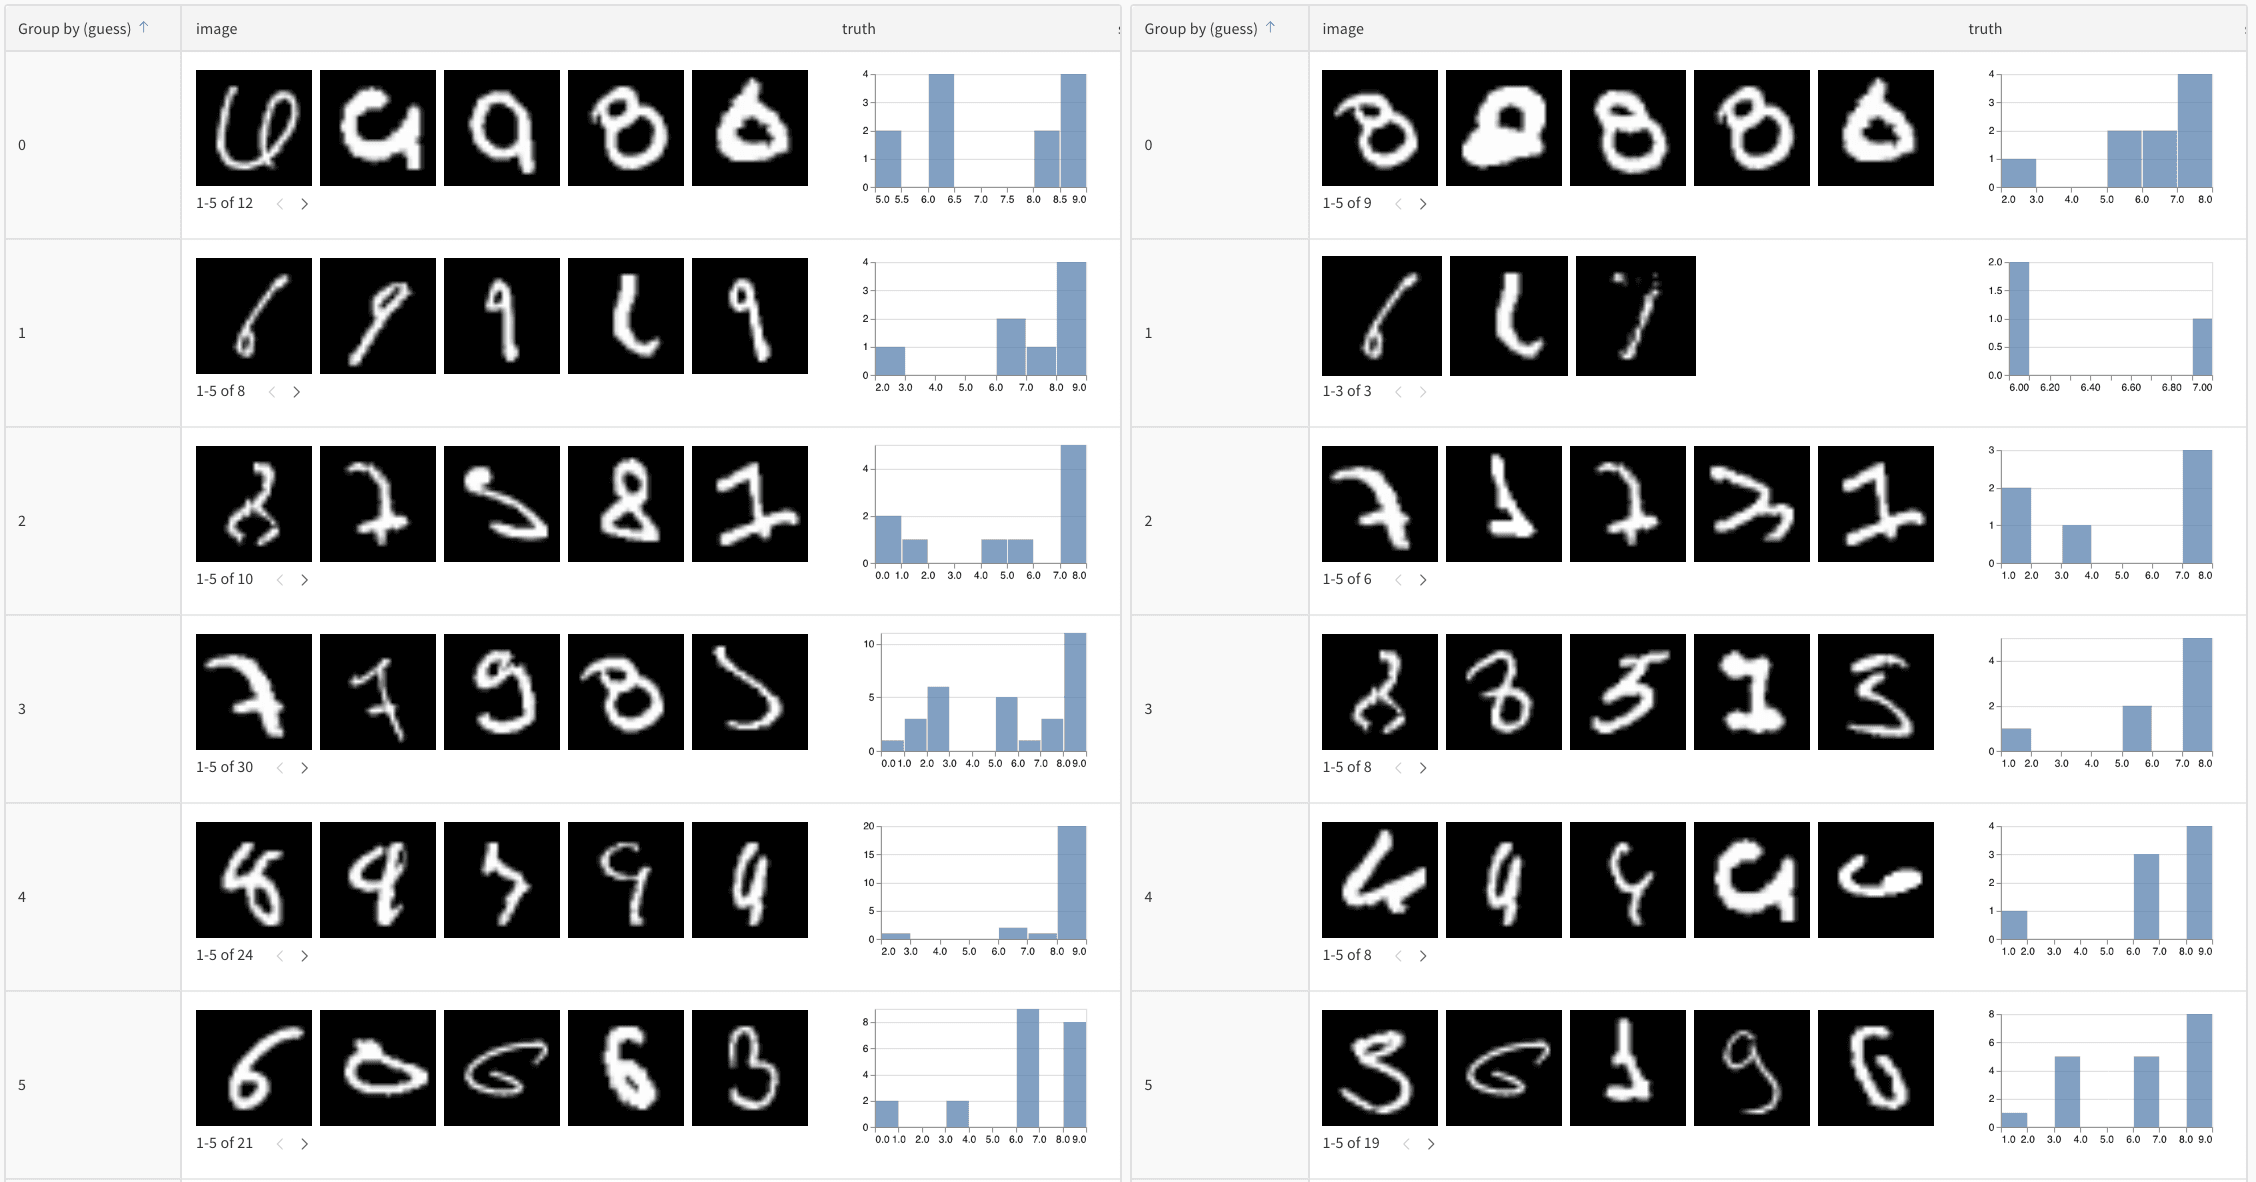
* **モデル予測の比較**: 同じテストセットで異なるモデルがどのように動作するかを並べて比較できます
* **予測の変化をトラッキングする**: トレーニングのエポックやモデルバージョン全体で予測がどのように変化するかを監視します
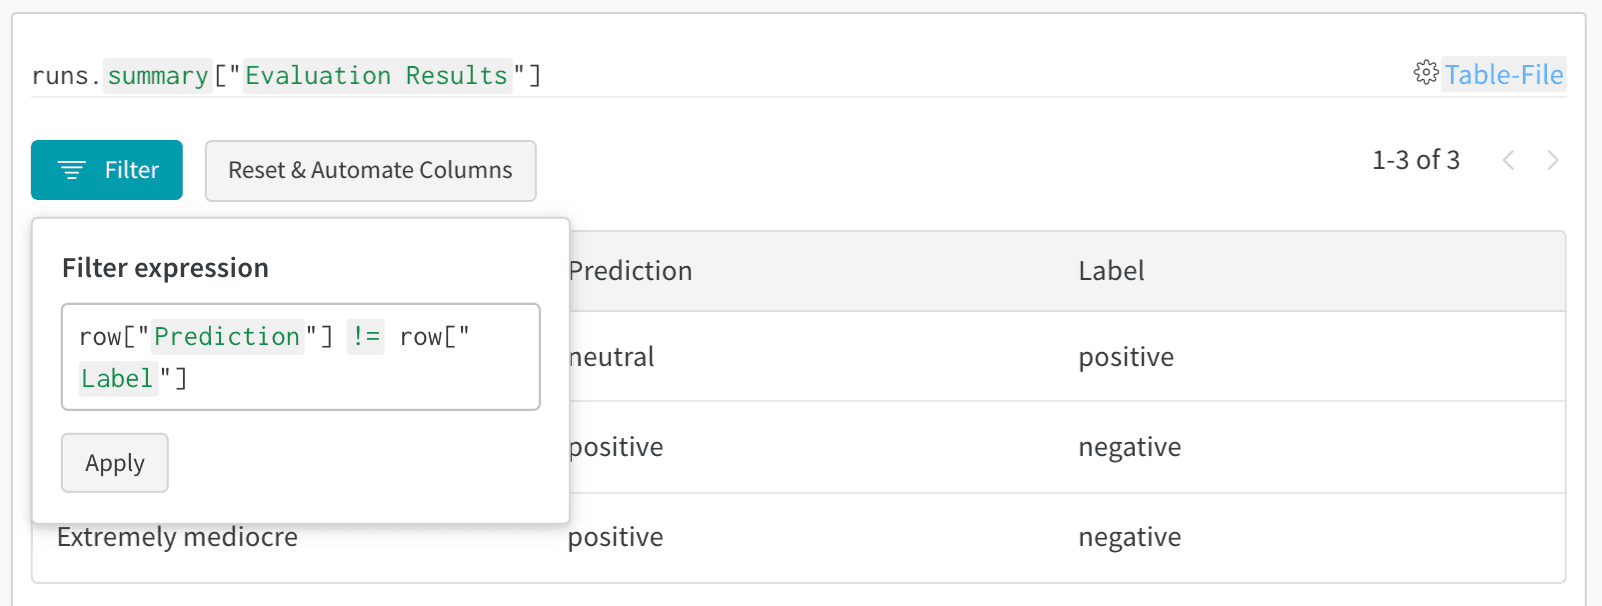
* **エラーの分析**: フィルターとクエリを使用して、よく誤分類される例やエラーパターンを検索します
* **リッチメディアの視覚化**: 予測やメトリクスとともに画像、オーディオ、テキスト、その他のメディアタイプを表示します
基本例: 評価結果をログする
```python theme={"system"}
import wandb
# run を初期化します
run = wandb.init(project="model-evaluation")
# 評価結果の表を作成します
columns = ["id", "input", "ground_truth", "prediction", "confidence", "correct"]
eval_table = wandb.Table(columns=columns)
# 評価データを追加します
for idx, (input_data, label) in enumerate(test_dataset):
prediction = model(input_data)
confidence = prediction.max()
predicted_class = prediction.argmax()
eval_table.add_data(
idx,
wandb.Image(input_data), # 画像やその他のメディアをログします
label,
predicted_class,
confidence,
label == predicted_class
)
# 表をログします
run.log({"evaluation_results": eval_table})
```
高度な表ワークフロー
複数のモデルを比較
異なるモデルの eval 表を同じ key にログして、直接比較します:
```python theme={"system"}
# モデル A の評価
with wandb.init(project="model-comparison", name="model_a") as run:
eval_table_a = create_eval_table(model_a, test_data)
run.log({"test_predictions": eval_table_a})
# モデル B の評価
with wandb.init(project="model-comparison", name="model_b") as run:
eval_table_b = create_eval_table(model_b, test_data)
run.log({"test_predictions": eval_table_b})
```
予測を時間の経過とともにトラッキングする
改善を視覚化するために、異なるトレーニングのエポックで表をログします:
```python theme={"system"}
for epoch in range(num_epochs):
train_model(model, train_data)
# このエポックの予測を評価してログする
eval_table = wandb.Table(columns=["image", "truth", "prediction"])
for image, label in test_subset:
pred = model(image)
eval_table.add_data(wandb.Image(image), label, pred.argmax())
wandb.log({f"predictions_epoch_{epoch}": eval_table})
```
W\&B UI でのインタラクティブな分析
ログしたら、次のことができます:
1. **結果をフィルターする**: 列ヘッダーをクリックして、予測精度、信頼度のしきい値、または特定のクラスでフィルターします
2. **表を比較する**: 複数の表バージョンを選択して、並べて比較します
3. **データをクエリする**: クエリバーを使用して特定のパターンを検索します (例: `"correct" = false AND "confidence" > 0.8`)
4. **グループ化と集計**: 予測されたクラスでグループ化して、クラスごとの精度メトリクスを表示します
Example: エンリッチされた表によるエラー分析
```python theme={"system"}
# 分析列を追加するための可変テーブルを作成します
eval_table = wandb.Table(
columns=["id", "image", "label", "prediction"],
log_mode="MUTABLE" # 後で列を追加できるようにします
)
# 初期予測
for idx, (img, label) in enumerate(test_data):
pred = model(img)
eval_table.add_data(idx, wandb.Image(img), label, pred.argmax())
run.log({"eval_analysis": eval_table})
# エラー分析用の信頼度スコアを追加します
confidences = [model(img).max() for img, _ in test_data]
eval_table.add_column("confidence", confidences)
# エラータイプを追加します
error_types = classify_errors(eval_table.get_column("label"),
eval_table.get_column("prediction"))
eval_table.add_column("error_type", error_types)
run.log({"eval_analysis": eval_table})
```