> ## Documentation Index
> Fetch the complete documentation index at: https://docs.coreweave.com/llms.txt
> Use this file to discover all available pages before exploring further.

> データセットを反復的に改善し、モデルの予測を理解します

# Tables の概要

export const TryProductLink = ({url}) => <a href={url} target="_blank" rel="noopener noreferrer" className="github-source-link">
    <svg width="20" height="20" viewBox="0 0 24 24" fill="none" stroke="currentColor" strokeWidth="2" strokeLinecap="round" strokeLinejoin="round" xmlns="http://www.w3.org/2000/svg">
      <line x1="4" y1="21" x2="4" y2="14"></line>
      <line x1="4" y1="10" x2="4" y2="3"></line>
      <line x1="12" y1="21" x2="12" y2="12"></line>
      <line x1="12" y1="8" x2="12" y2="3"></line>
      <line x1="20" y1="21" x2="20" y2="16"></line>
      <line x1="20" y1="12" x2="20" y2="3"></line>
      <circle cx="4" cy="12" r="2"></circle>
      <circle cx="12" cy="10" r="2"></circle>
      <circle cx="20" cy="14" r="2"></circle>
    </svg>
    Try in W&amp;B
  </a>;

export const ColabLink = ({url}) => <a href={url} target="_blank" rel="noopener noreferrer" className="colab-link">
    <svg width="20" height="20" viewBox="0 0 24 24" fill="currentColor" xmlns="http://www.w3.org/2000/svg">
      <path d="M14.25.18l.9.2.73.26.59.3.45.32.34.34.25.34.16.33.1.3.04.26.02.2-.01.13V8.5l-.05.63-.13.55-.21.46-.26.38-.3.31-.33.25-.35.19-.35.14-.33.1-.3.07-.26.04-.21.02H8.77l-.69.05-.59.14-.5.22-.41.27-.33.32-.27.35-.2.36-.15.37-.1.35-.07.32-.04.27-.02.21v3.06H3.17l-.21-.03-.28-.07-.32-.12-.35-.18-.36-.26-.36-.36-.35-.46-.32-.59-.28-.73-.21-.88-.14-1.05-.05-1.23.06-1.22.16-1.04.24-.87.32-.71.36-.57.4-.44.42-.33.42-.24.4-.16.36-.1.32-.05.24-.01h.16l.06.01h8.16v-.83H6.18l-.01-2.75-.02-.37.05-.34.11-.31.17-.28.25-.26.31-.23.38-.2.44-.18.51-.15.58-.12.64-.1.71-.06.77-.04.84-.02 1.27.05zm-6.3 1.98l-.23.33-.08.41.08.41.23.34.33.22.41.09.41-.09.33-.22.23-.34.08-.41-.08-.41-.23-.33-.33-.22-.41-.09-.41.09zm13.09 3.95l.28.06.32.12.35.18.36.27.36.35.35.47.32.59.28.73.21.88.14 1.04.05 1.23-.06 1.23-.16 1.04-.24.86-.32.71-.36.57-.4.45-.42.33-.42.24-.4.16-.36.09-.32.05-.24.02-.16-.01h-8.22v.82h5.84l.01 2.76.02.36-.05.34-.11.31-.17.29-.25.25-.31.24-.38.2-.44.17-.51.15-.58.13-.64.09-.71.07-.77.04-.84.01-1.27-.04-1.07-.14-.9-.2-.73-.25-.59-.3-.45-.33-.34-.34-.25-.34-.16-.33-.1-.3-.04-.25-.02-.2.01-.13v-5.34l.05-.64.13-.54.21-.46.26-.38.3-.32.33-.24.35-.2.35-.14.33-.1.3-.06.26-.04.21-.02.13-.01h5.84l.69-.05.59-.14.5-.21.41-.28.33-.32.27-.35.2-.36.15-.36.1-.35.07-.32.04-.28.02-.21V6.07h2.09l.14.01.21.03zm-6.47 14.25l-.23.33-.08.41.08.41.23.33.33.23.41.08.41-.08.33-.23.23-.33.08-.41-.08-.41-.23-.33-.33-.23-.41-.08-.41.08z" />
    </svg>
    Try in Colab
  </a>;

<CardGroup cols={4}>
  <ColabLink url="https://colab.research.google.com/github/wandb/examples/blob/master/colabs/datasets-predictions/W%26B_Tables_Quickstart.ipynb" />

  <TryProductLink url="https://forge.coreweave.com/wandb/wandb/examples/reports/AlphaFold-ed-Proteins-in-W-B-Tables--Vmlldzo4ODc0MDc" />
</CardGroup>

W\&B Tables を使用すると、表形式のデータを可視化したり、クエリしたりできます。たとえば、次のような用途があります。

* 同じテストセットでさまざまなモデルの性能を比較する
* データ内のパターンを特定する
* モデルの予測サンプルを視覚的に確認する
* クエリを使って、誤分類されやすい例を検索する
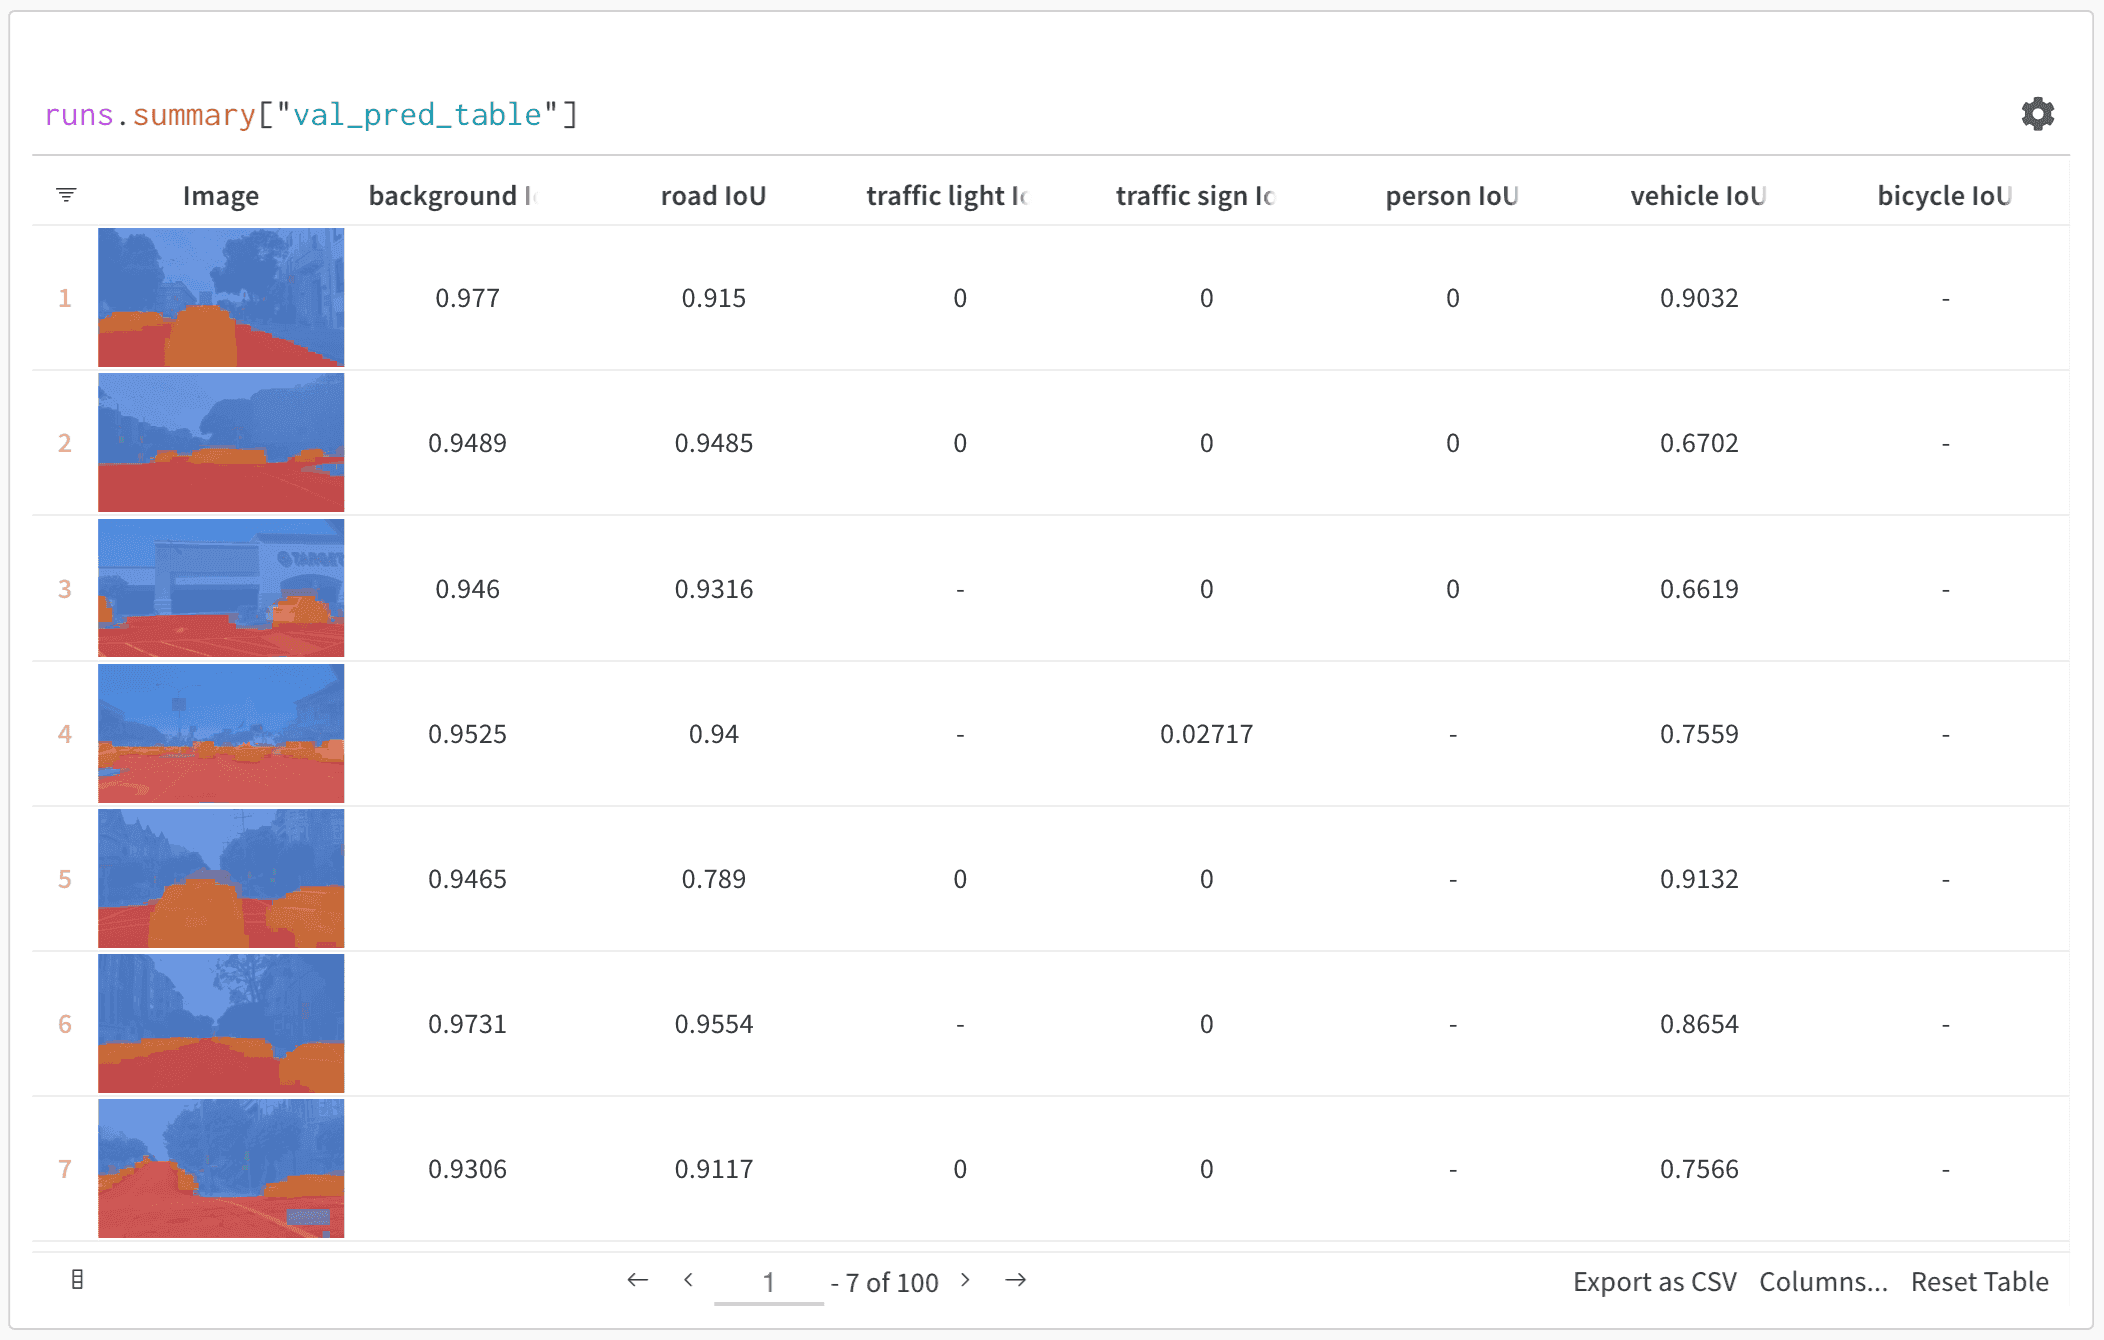
<Frame>
  <img src="https://mintcdn.com/coreweave-dbfa0e8d/3Dv_sw2eg8feUJlx/products/wandb/_media/tables_sample_predictions.png?fit=max&auto=format&n=3Dv_sw2eg8feUJlx&q=85&s=ee11673fdabf971d749abc5b4c8ea594" alt="セマンティックセグメンテーションの予測の表" width="2104" height="1340" data-path="products/wandb/_media/tables_sample_predictions.png" />
</Frame>

上の画像は、セマンティックセグメンテーションの結果とカスタムメトリクスを含む表です。この表は、[W\&B ML コースのサンプル project](https://wandb.ai/av-team/mlops-course-001) で確認できます。

<h2 id="how-it-works">
  仕組み
</h2>

表 は 2 次元のデータグリッドで、各列には 1 つのタイプのデータのみが格納されます。表 は、プリミティブ型と数値型に加えて、ネストされたリスト、辞書、リッチメディアタイプをサポートしています。

<h2 id="log-a-table">
  表をログする
</h2>

数行のコードで表をログできます。

* [`wandb.init()`](/ja/products/wandb/ref/python/functions/init): 結果をトラッキングするための [run](/ja/products/wandb/runs) を作成します。
* [`wandb.Table()`](/ja/products/wandb/ref/python/data-types/table): 新しい表オブジェクトを作成します。
  * `columns`: 列名を設定します。
  * `data`: 表の内容を設定します。
* [`run.log()`](/ja/products/wandb/ref/python/experiments/run#method-runlog): 表をログして Weights & Biases に保存します。

```python theme={"system"}
import wandb

with wandb.init(project="table-test") as run:
    my_table = wandb.Table(columns=["a", "b"], data=[["a1", "b1"], ["a2", "b2"]])
    run.log({"Table Name": my_table})
```

<h2 id="how-to-get-started">
  はじめに
</h2>

* [クイックスタート](/ja/products/wandb/tables/tables-walkthrough): データ表をログする方法や、データを可視化・クエリする方法を学びます。
* [Tables ギャラリー](/ja/products/wandb/tables/tables-gallery): Tables のユースケース例を紹介します。
