> ## Documentation Index
> Fetch the complete documentation index at: https://docs.coreweave.com/llms.txt
> Use this file to discover all available pages before exploring further.
> 機械学習の実験間で結果を比較します
# パラレル座標
パラレル座標チャートを使うと、多数のハイパーパラメーターとモデルのメトリクスの関係をひと目で把握できます。
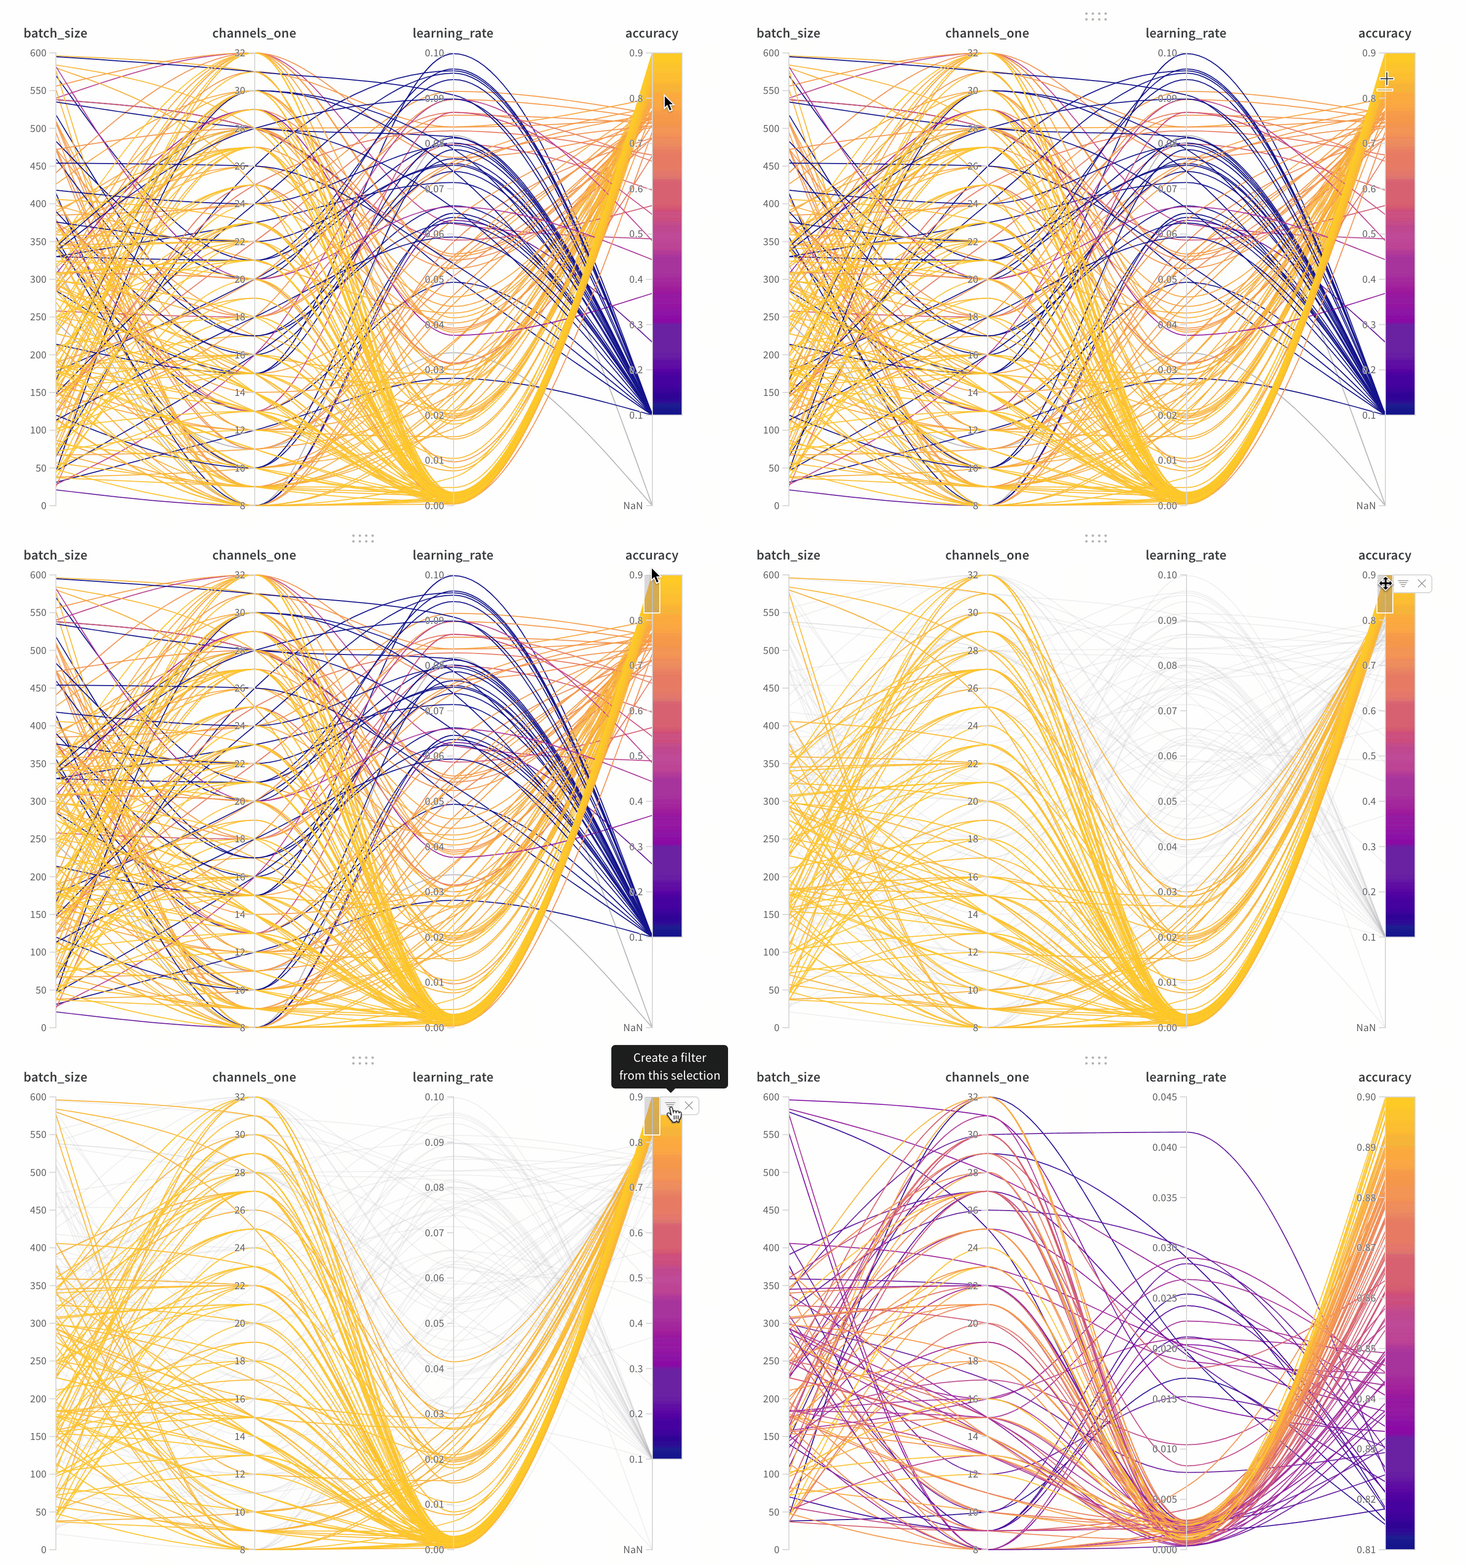 パラレル座標パネルは、次の要素で構成されています。
* **軸**: [`wandb.Run.config`](/ja/products/wandb/tables/evaluate-models) のハイパーパラメーターと、[`wandb.Run.log()`](/ja/products/wandb/tables/evaluate-models) でログしたメトリクスです。
* **線**: 各線は単一の run を表します。線にカーソルを合わせると、その run の詳細を示すツールチップが表示されます。現在のフィルターに一致する線はすべて表示されます。run の目のアイコンをオフにすると、その run の線は薄く表示されます。
パラレル座標パネルは、次の要素で構成されています。
* **軸**: [`wandb.Run.config`](/ja/products/wandb/tables/evaluate-models) のハイパーパラメーターと、[`wandb.Run.log()`](/ja/products/wandb/tables/evaluate-models) でログしたメトリクスです。
* **線**: 各線は単一の run を表します。線にカーソルを合わせると、その run の詳細を示すツールチップが表示されます。現在のフィルターに一致する線はすべて表示されます。run の目のアイコンをオフにすると、その run の線は薄く表示されます。
パラレル座標パネルを作成する
Workspace にパラレル座標パネルを追加するには、次の手順を実行します。
1. Workspace のランディングページにアクセスします。
2. **Add Panels** をクリックします。
3. **Parallel coordinates** を選択します。
パネル設定
パネルを設定するには、パネルの右上隅にある編集ボタンをクリックします。
次の設定を調整できます。
* **Tooltip**: カーソルを合わせると、各 run の情報を示す凡例が表示されます。
* **Titles**: 軸のタイトルを編集して、読みやすくできます。
* **Gradient**: グラデーションを任意の色範囲にカスタマイズできます。
* **Log scale**: 軸ごとに個別に対数スケールを設定できます。
* **Flip axis**: 軸の方向を反転します。精度と損失の両方を列に含めている場合に便利です。
実際に操作できる例については、[パラレル座標パネルのライブ例](https://forge.coreweave.com/wandb/example-team/sweep-demo/reports/Zoom-in-on-Parallel-Coordinates-Charts--Vmlldzo5MTQ4Nw)を参照してください。
## Related topics
- [実験を作成する](/ja/products/wandb/track/create-an-experiment.md)