> ## Documentation Index
> Fetch the complete documentation index at: https://docs.coreweave.com/llms.txt
> Use this file to discover all available pages before exploring further.
# Workspace、セクション、パネルの設定を管理する
> W&B アプリで Workspace、セクション、パネルの設定を管理します。レイアウトや折れ線グラフの設定オプションについても説明します。
Workspace ページには、Workspace、セクション、パネルという 3 つの設定レベルがあります。[Workspace settings](#workspace-settings) は Workspace 全体に適用されます。[セクション設定](#section-settings) はセクション内のすべてのパネルに適用されます。[パネル設定](#panel-settings) は個々のパネルに適用されます。
このページでは、各レベルの設定方法について説明します。これらの設定により、Workspace のレイアウトを制御したり、パネルを整理したり、データの表示方法をカスタマイズしたりできます。以下のセクションでは、各設定レベルを順に説明します。
Workspace settings
Workspace settings は、すべてのセクションと、各セクション内のすべてのパネルに適用されます。編集できる Workspace settings には、[Workspace layout](#workspace-layout-options) と [Line plots](#line-plots-options) の 2 つのタイプがあります。**Workspace layout** では Workspace の構造を決定し、**Line plots** では Workspace 内の折れ線グラフのデフォルト設定を制御します。
この Workspace 全体の構造に適用される設定を編集するには、次の手順を実行します。
1. プロジェクトの Workspace にアクセスします。
2. **New report** ボタンの横にある歯車アイコンをクリックして、Workspace settings を表示します。
3. Workspace のレイアウトを変更する場合は **Workspace layout** を、Workspace 内の折れ線グラフのデフォルト設定を構成する場合は **Line plots** を選択します。
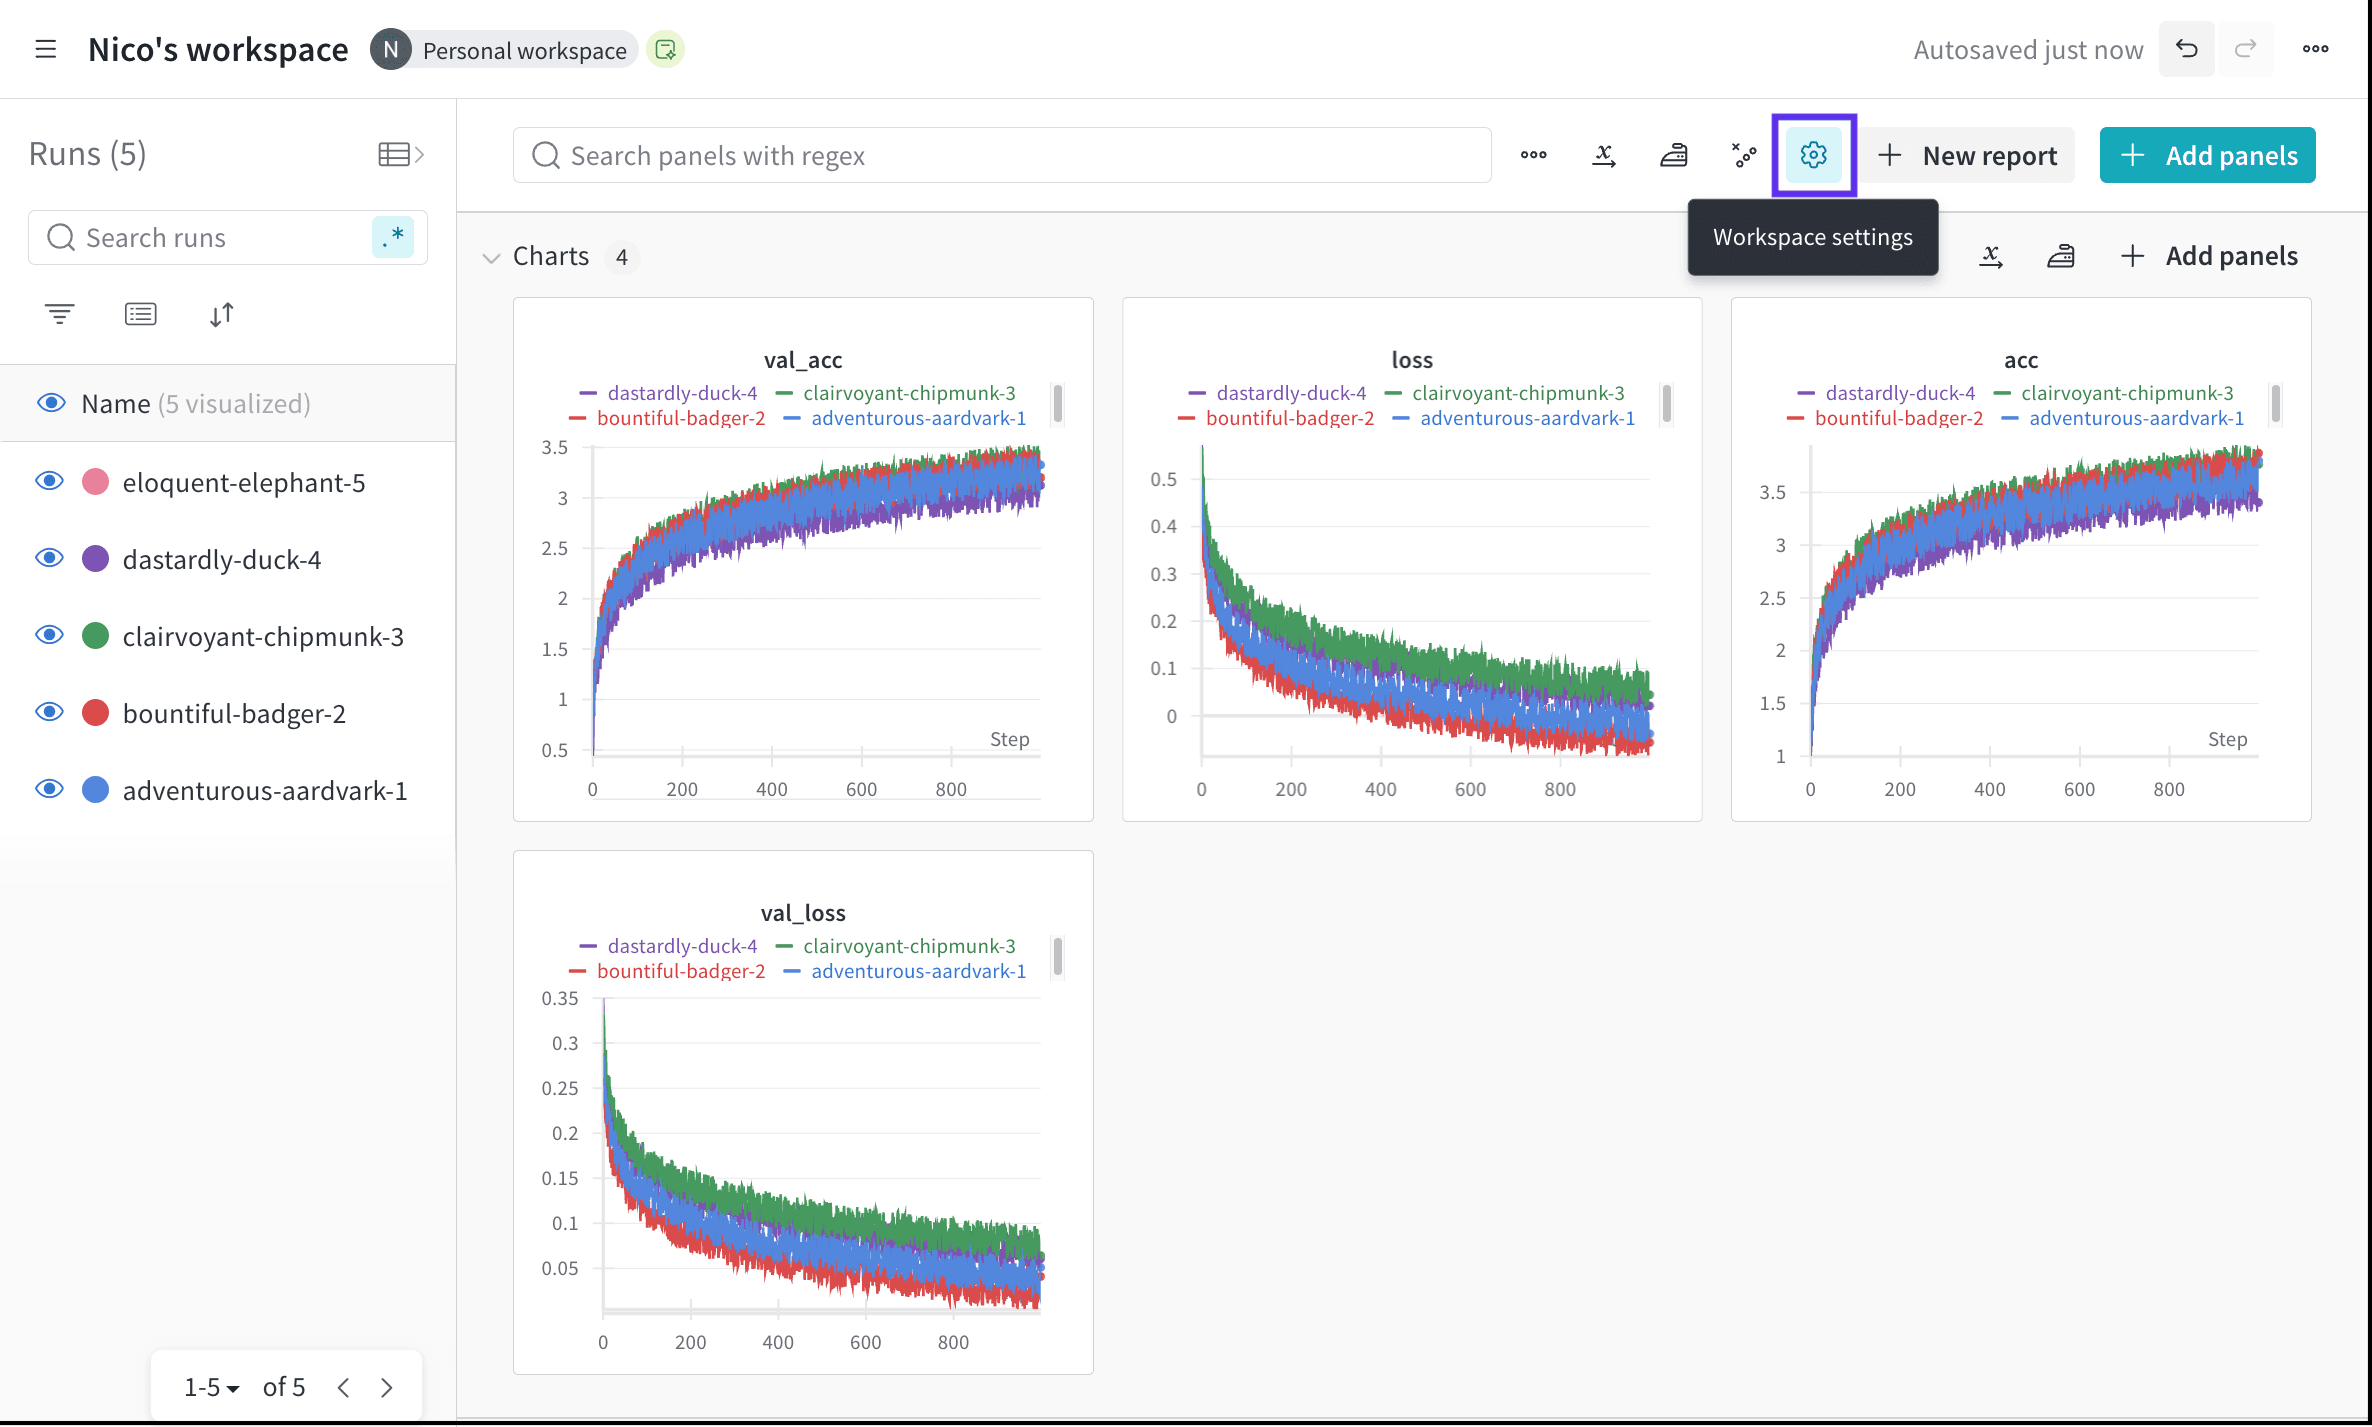 Workspace settings パネルが開きます。ここで、以下のセクションで説明する変更を適用できます。
Workspace をカスタマイズした後は、*Workspace テンプレート* を使用して、同じ設定の新しい Workspace を作成できます。詳しくは、[Workspace テンプレート](/ja/products/wandb/track/workspaces#workspace-templates) を参照してください。
Workspace settings パネルが開きます。ここで、以下のセクションで説明する変更を適用できます。
Workspace をカスタマイズした後は、*Workspace テンプレート* を使用して、同じ設定の新しい Workspace を作成できます。詳しくは、[Workspace テンプレート](/ja/products/wandb/track/workspaces#workspace-templates) を参照してください。
Workspace レイアウトオプション
Workspace のレイアウトを設定して、Workspace 全体の構造を定義します。これには、セクション分けのロジックやパネルの配置が含まれます。
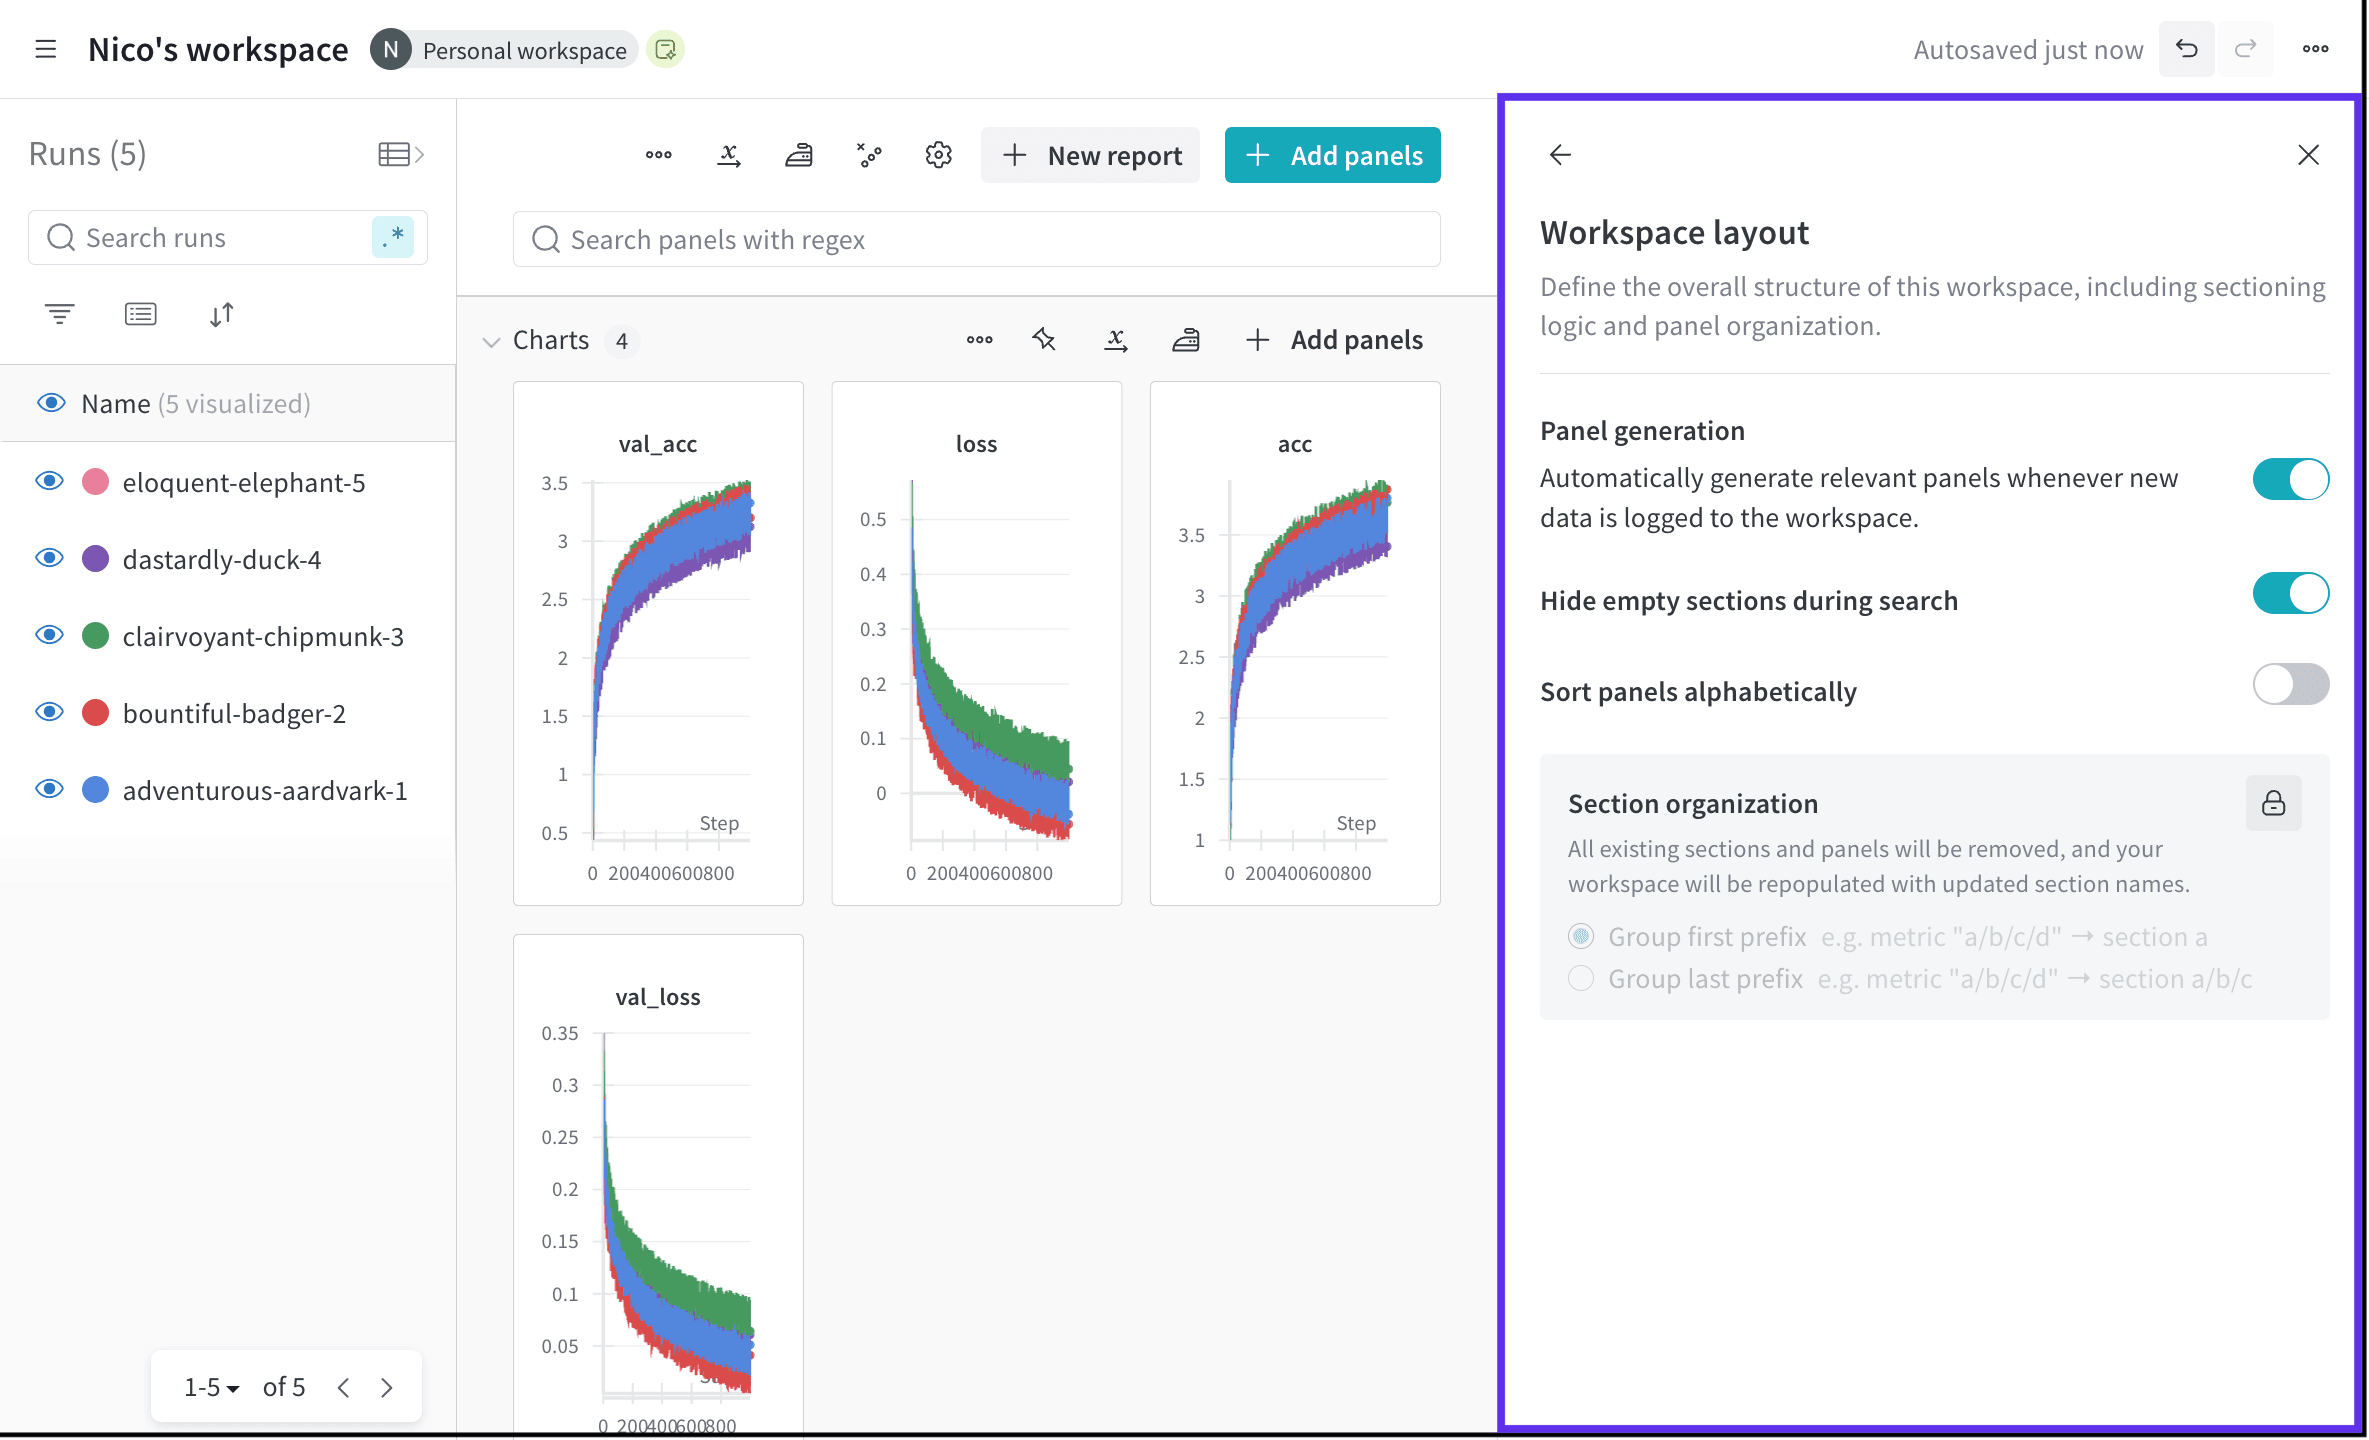 Workspace レイアウトオプションのページでは、Workspace のパネルが自動生成か手動生成かを確認できます。Workspace のパネル生成モードを変更するには、[パネル](/ja/products/wandb/app/features/panels)を参照してください。
次の表は、各 Workspace レイアウトオプションの説明です。
| Workspace 設定 | 説明 |
| - | - |
| **Hide empty sections during search** | パネルの検索時に、パネルを含まないセクションを非表示にします。 |
| **Sort panels alphabetically** | Workspace 内のパネルをアルファベット順に並べ替えます。 |
| **Section organization** | 既存のセクションとパネルをすべて削除し、新しいセクション名で再作成します。再作成されたセクションは、最初の接頭辞または最後の接頭辞でグループ化されます。 |
W\&B では、セクションを整理する際に、最後の接頭辞ではなく最初の接頭辞でグループ化することを推奨しています。最初の接頭辞でグループ化すると、セクション数が減り、パフォーマンスが向上する場合があります。
Workspace レイアウトオプションのページでは、Workspace のパネルが自動生成か手動生成かを確認できます。Workspace のパネル生成モードを変更するには、[パネル](/ja/products/wandb/app/features/panels)を参照してください。
次の表は、各 Workspace レイアウトオプションの説明です。
| Workspace 設定 | 説明 |
| - | - |
| **Hide empty sections during search** | パネルの検索時に、パネルを含まないセクションを非表示にします。 |
| **Sort panels alphabetically** | Workspace 内のパネルをアルファベット順に並べ替えます。 |
| **Section organization** | 既存のセクションとパネルをすべて削除し、新しいセクション名で再作成します。再作成されたセクションは、最初の接頭辞または最後の接頭辞でグループ化されます。 |
W\&B では、セクションを整理する際に、最後の接頭辞ではなく最初の接頭辞でグループ化することを推奨しています。最初の接頭辞でグループ化すると、セクション数が減り、パフォーマンスが向上する場合があります。
Line plots のオプション
**Line plots** の Workspace settings を変更すると、Workspace 内の折れ線グラフに適用するグローバルなデフォルトとカスタムルールを設定できます。
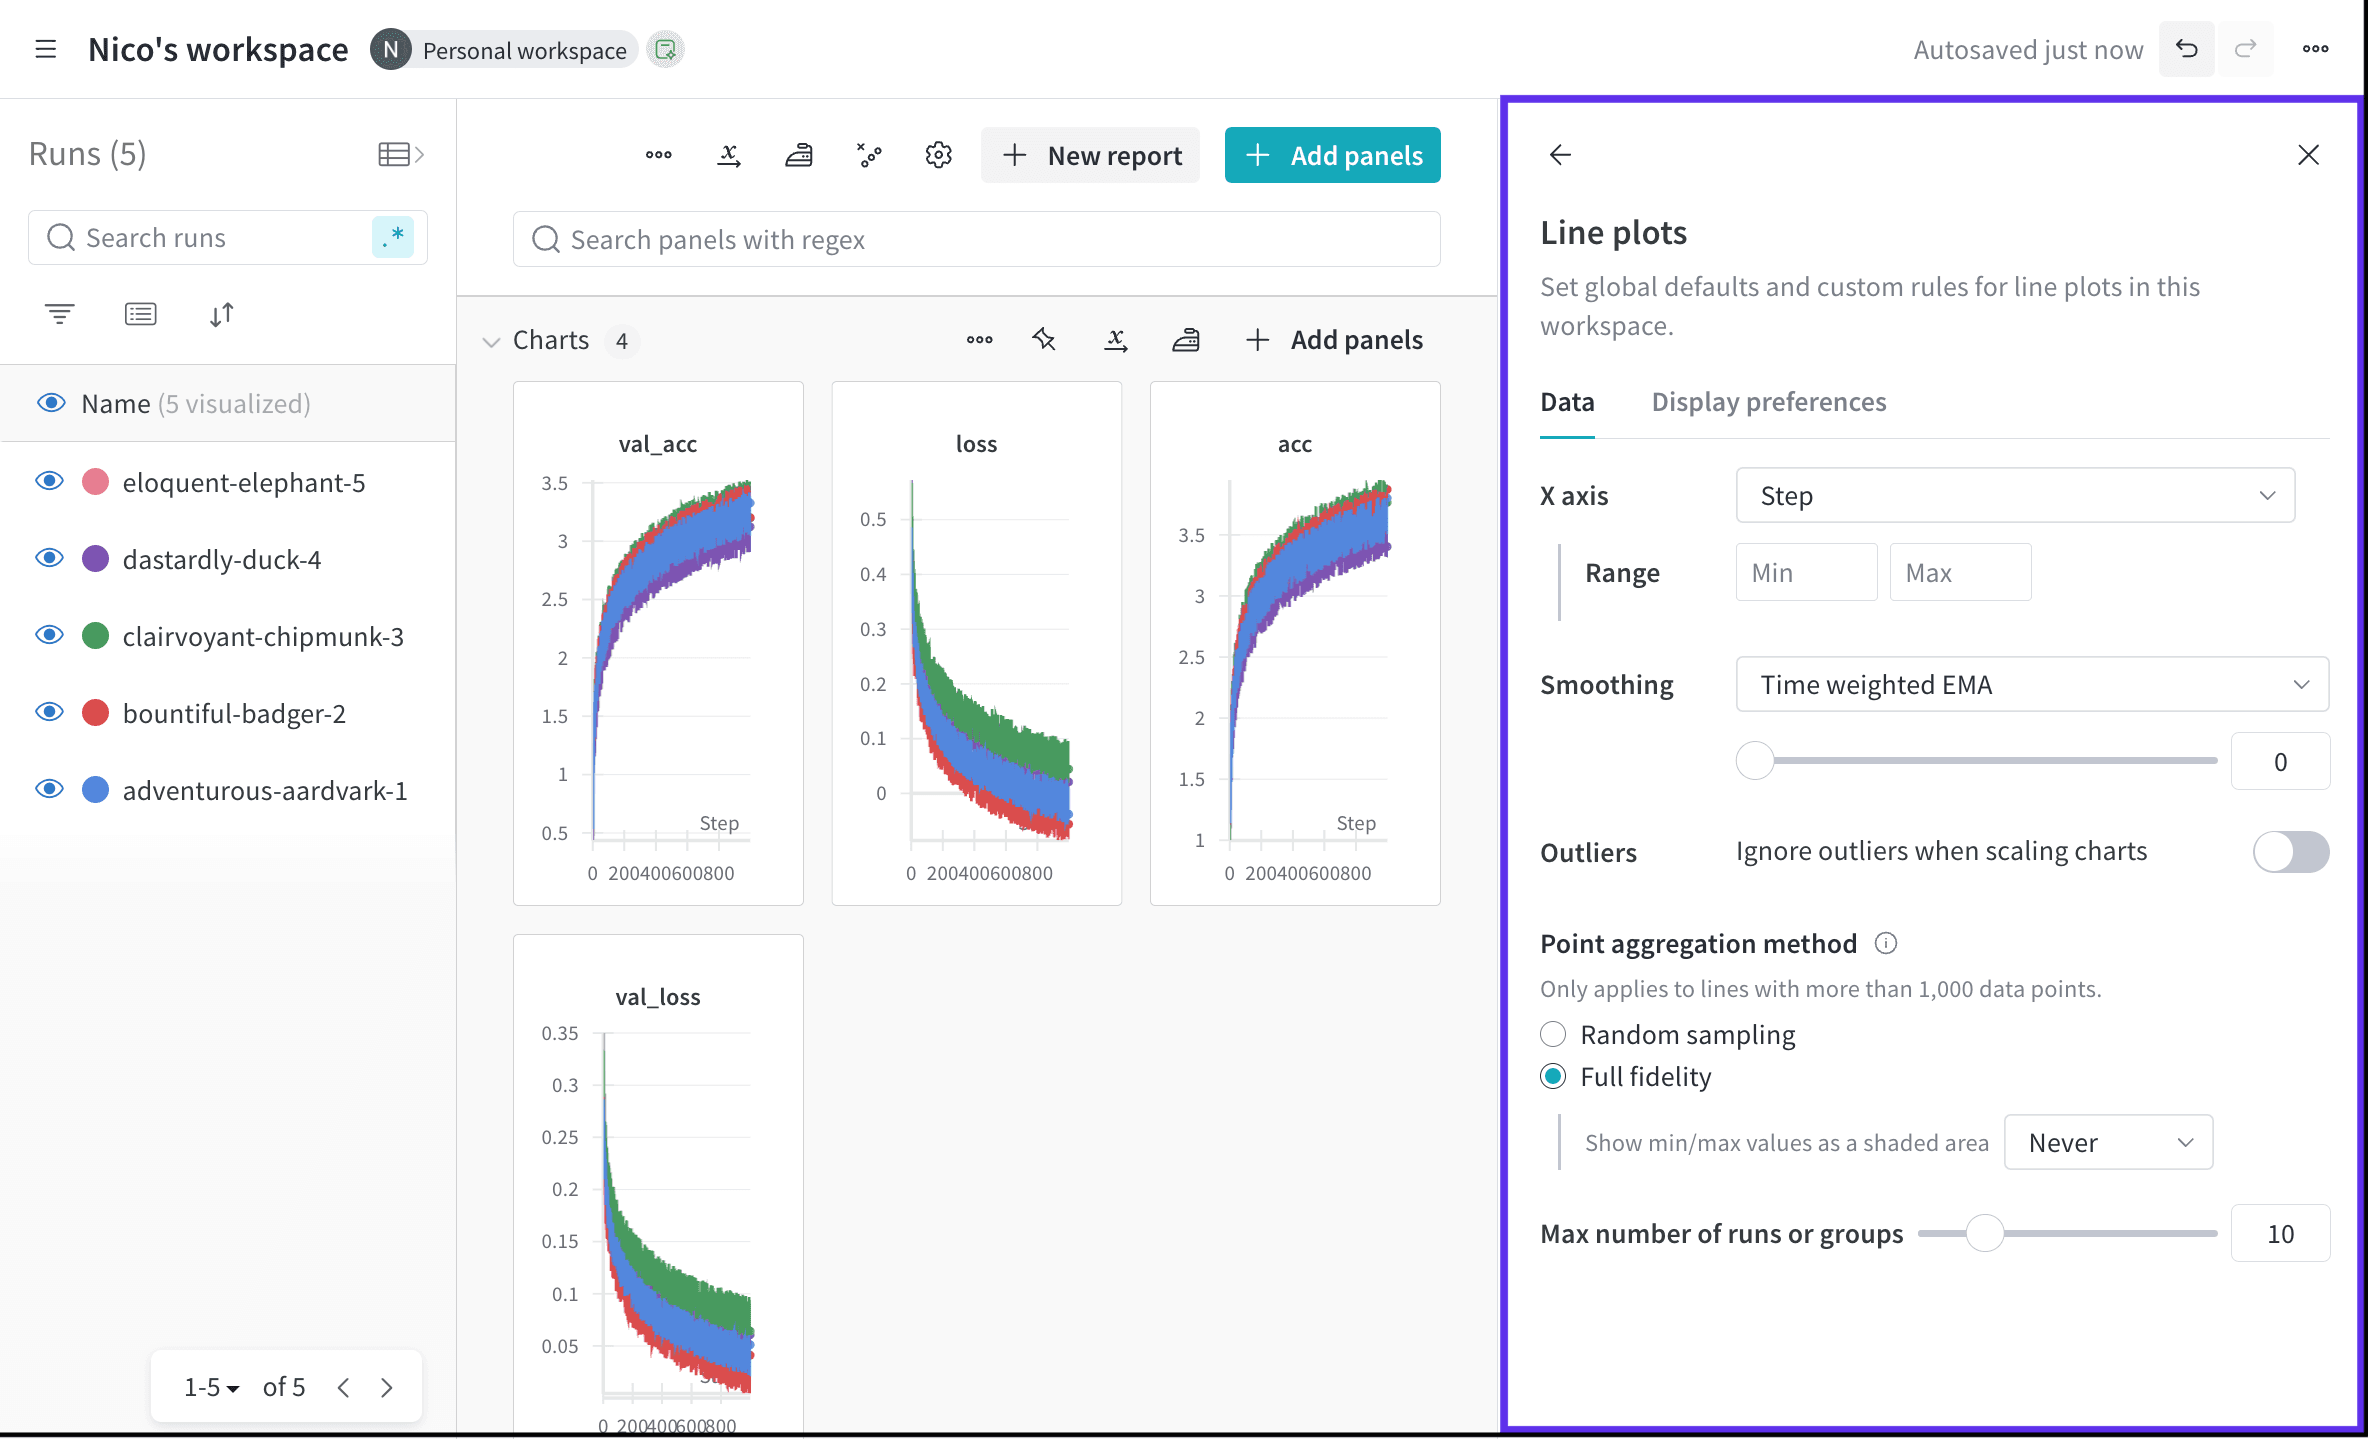 **Line plots** の設定では、主に **Data** と **Display preferences** の 2 つを編集できます。
データオプション
**Data** タブには次の設定があります。x 軸と y 軸のその他のオプションについては、後述の表を参照してください。
| Line plots の設定 | 説明 |
| - | - |
| **X axis** | Line plots の x 軸のスケール。 |
| **Y axis** | Line plots の y 軸のスケール。 |
| **Smoothing** | Line plots のスムージングを変更します。スムージングの詳細については、[Line plots のスムージング](/ja/products/wandb/app/features/panels/line-plot/smoothing)を参照してください。 |
| **Outliers** | 外れ値を除外するように、プロットのデフォルトの最小値・最大値のスケールを再調整します。 |
| **Point aggregation method** | データ可視化の精度とパフォーマンスを向上させます。詳細については、[ポイント集約](/ja/products/wandb/app/features/panels/line-plot/sampling)を参照してください。 |
| **Max number of runs or groups** | Line plots に表示する run またはグループの数を制限します。 |
| **Use grouping from the runs table in charts** | run テーブルのグループ化を Line plots に適用します。デフォルトでオンになっています。 |
| **Use only latest run per group** | グループ内の run をまとめるのではなく、グループごとに 1 つの run をプロットします。各グループに表示される run は、run selector の並べ替え順序によって決まります。詳細については、[run のグループ化](/ja/products/wandb/app/features/panels/line-plot/reference#run-grouping)を参照してください。 |
次の表は、x 軸のオプションを示しています。
| X 軸のオプション | 説明 |
| - | - |
| **Step** | `wandb.Run.log()` を呼び出すたびに増加します。x 軸はデフォルトで **Step** に設定されています。 |
| **Relative Time (Wall)** | プロセス開始時点からのタイムスタンプ。たとえば、run を開始し、翌日にその run を再開したとします。その後に何かをログすると、記録されるポイントは 24 時間になります。 |
| **Relative Time (Process)** | 実行中のプロセス内でのタイムスタンプ。たとえば、run を開始して 10 秒間実行したとします。翌日にその run を再開した場合、ポイントは 10 秒として記録されます。 |
| **Wall Time** | グラフ上の最初の run の開始からの経過時間 (分) 。 |
| **Range** | x 軸に表示する範囲の最小値と最大値。 |
次の表は、y 軸のオプションを示しています。
| Y 軸のオプション | 説明 |
| - | - |
| **Log scale** | y 軸を対数スケールで表示します。 |
| **Range** | y 軸に表示する範囲の最小値と最大値。 |
y 軸の範囲を手動で設定すると、W\&B はその範囲を Workspace 内のすべての Line plots に適用します。値の幅がメトリクスごとに大きく異なる場合は、セクション単位で範囲を設定することを検討してください。
個々の Line plots を編集する方法については、「Line plots」の[ラインパネル設定を編集する](/ja/products/wandb/app/features/panels/line-plot#edit-line-panel-settings)を参照してください。
Display preferences
**Display preferences** タブでは、次の設定のオン/オフを切り替えられます。
| 表示設定 | 説明 |
| - | - |
| **Remove legends from all panels** | パネルの凡例を削除します。 |
| **Display colored run names in tooltips** | ツールチップ内で run を色付きテキストで表示します。 |
| **Only show highlighted run in companion chart tooltip** | チャートのツールチップに、ハイライトされた run のみを表示します。 |
| **Number of runs shown in tooltips** | ツールチップに表示する run の数を指定します。 |
| **Display full run names on the primary chart tooltip** | チャートのツールチップに run の完全な名前を表示します。 |
| **Show bin range in tooltip** | [full fidelity](/ja/products/wandb/app/features/panels/line-plot/sampling#full-fidelity) のポイント集約で網掛けの帯がレンダリングされる場合に、バケットの最小値と最大値をツールチップに表示します。デフォルトではオフです。 |
セクション設定
セクション設定は、そのセクション内のすべてのパネルに適用されます。Workspace のセクション内では、パネルの並べ替えや配置の変更、セクションのリネームを行えます。
セクション設定を変更するには、セクションの右上にある **action ()** メニューを選択します。
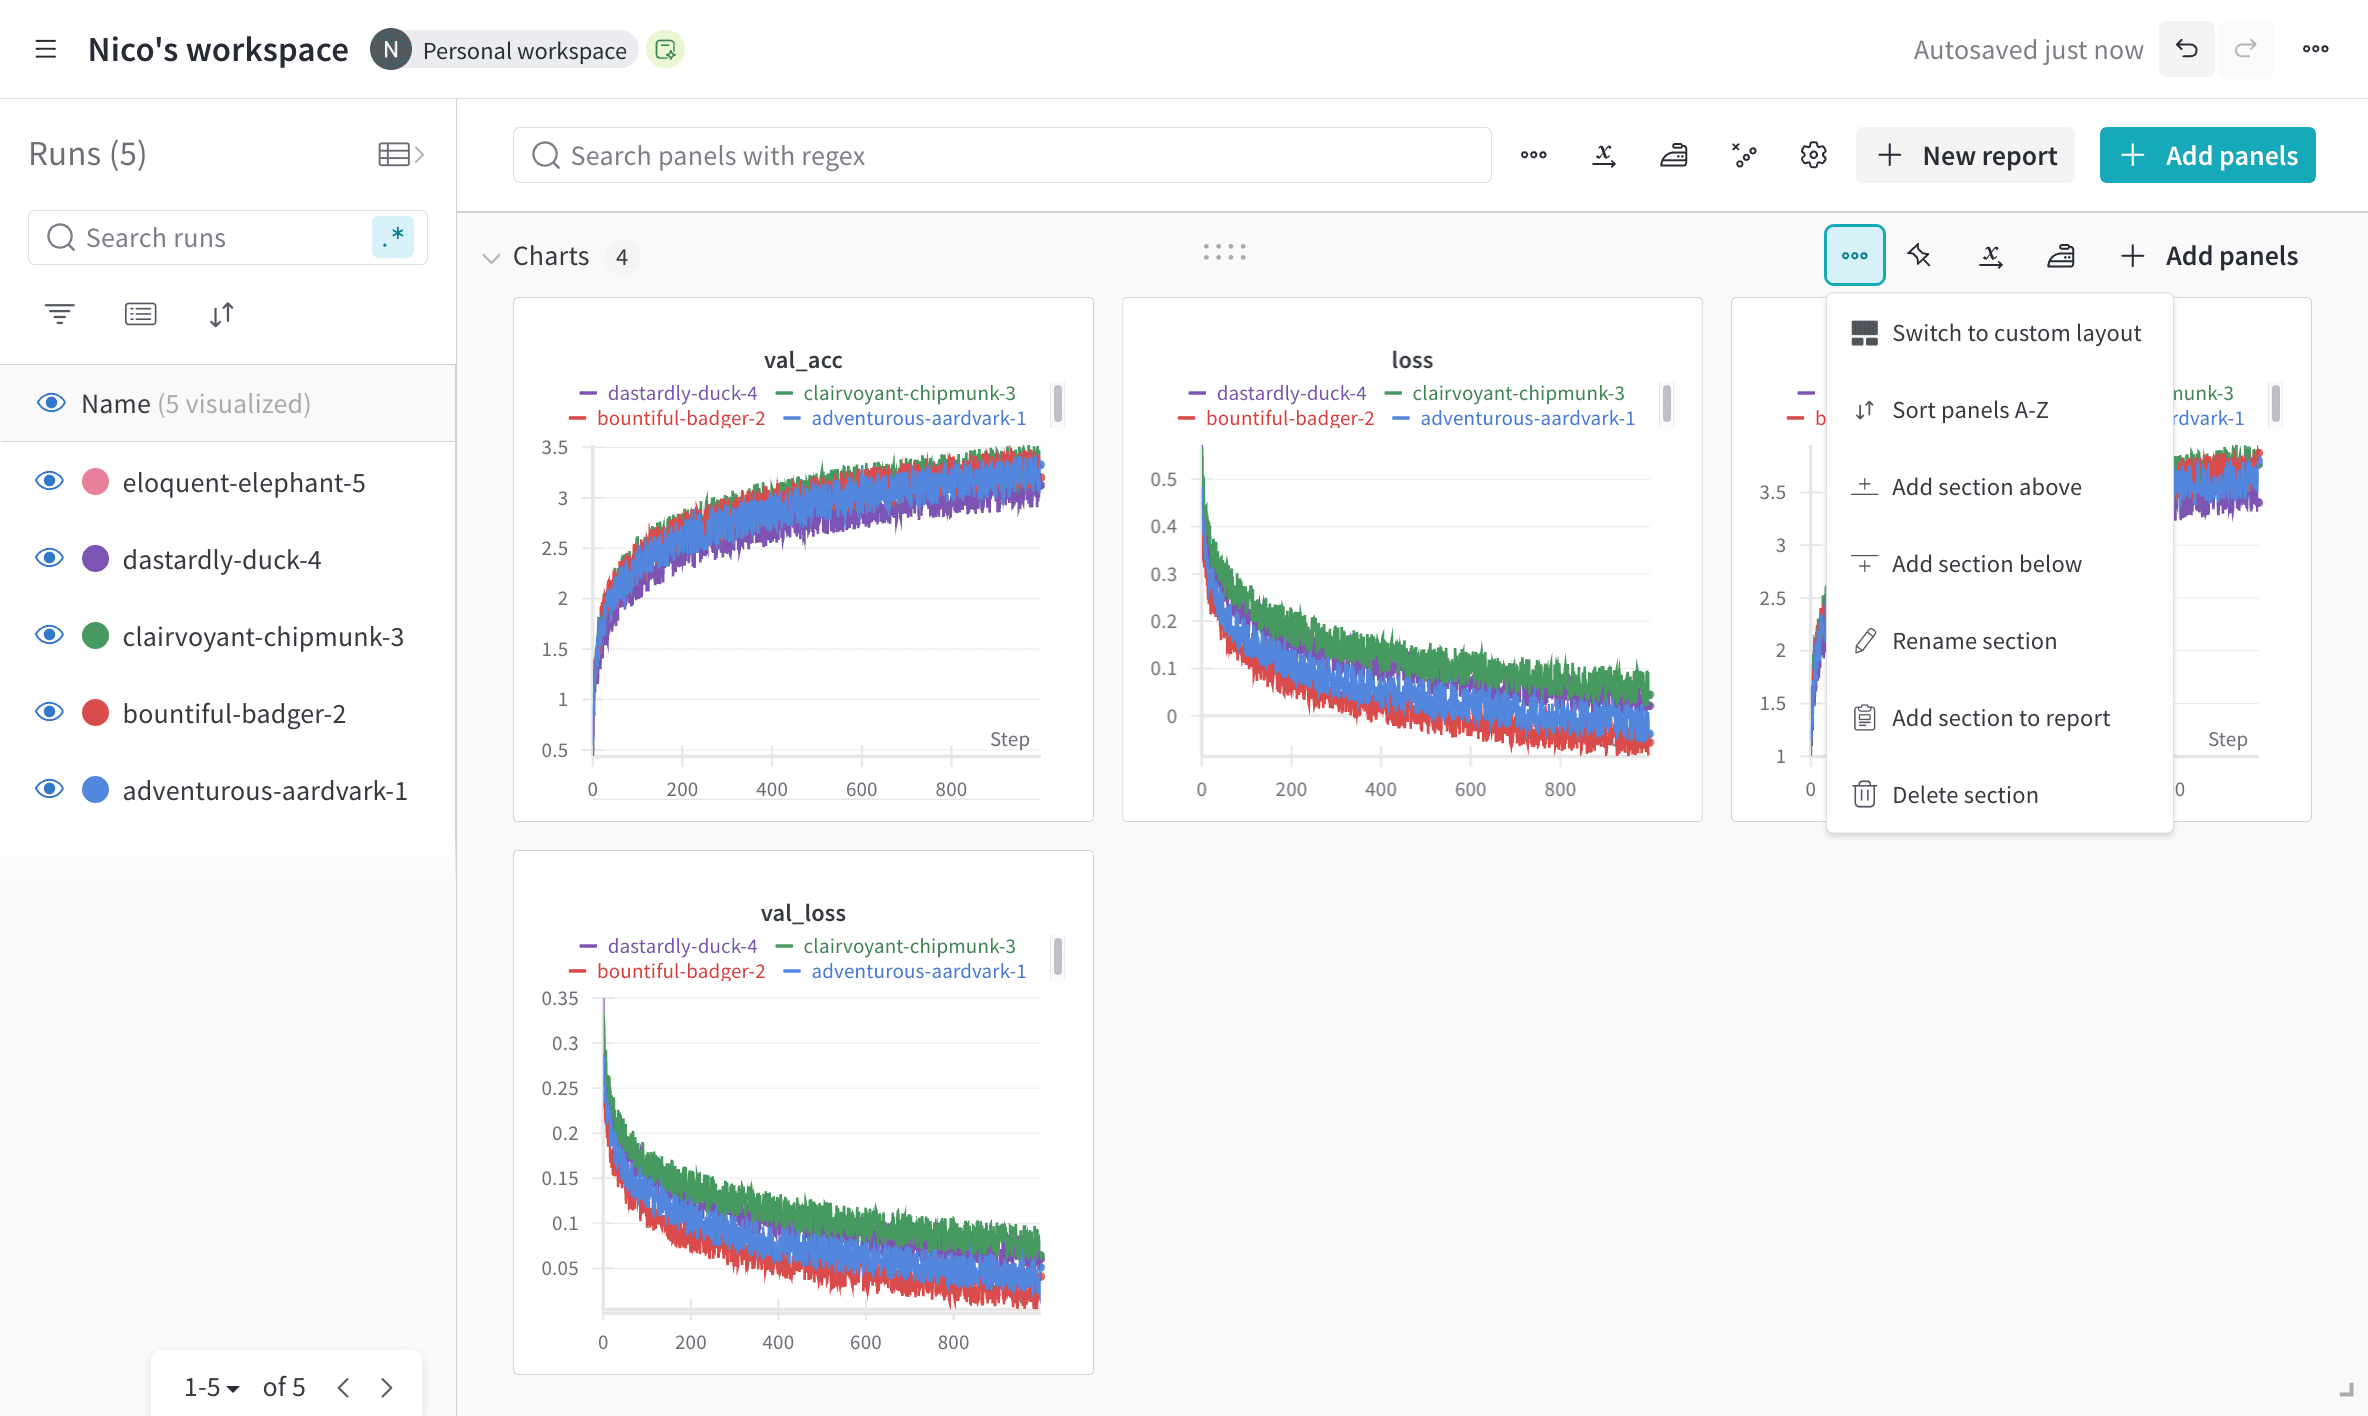 ドロップダウンでは、セクション全体に適用される次の設定を編集できます。
| セクション設定 | 説明 |
| - | - |
| **Rename a section** | セクションをリネームします。 |
| **Sort panels A-Z** | セクション内のパネルをアルファベット順に並べ替えます。 |
| **Rearrange panels** | セクション内のパネルを選択してドラッグし、パネルの順序を手動で変更します。 |
次のアニメーションは、セクション内でパネルの配置を変更する方法を示しています。
ドロップダウンでは、セクション全体に適用される次の設定を編集できます。
| セクション設定 | 説明 |
| - | - |
| **Rename a section** | セクションをリネームします。 |
| **Sort panels A-Z** | セクション内のパネルをアルファベット順に並べ替えます。 |
| **Rearrange panels** | セクション内のパネルを選択してドラッグし、パネルの順序を手動で変更します。 |
次のアニメーションは、セクション内でパネルの配置を変更する方法を示しています。
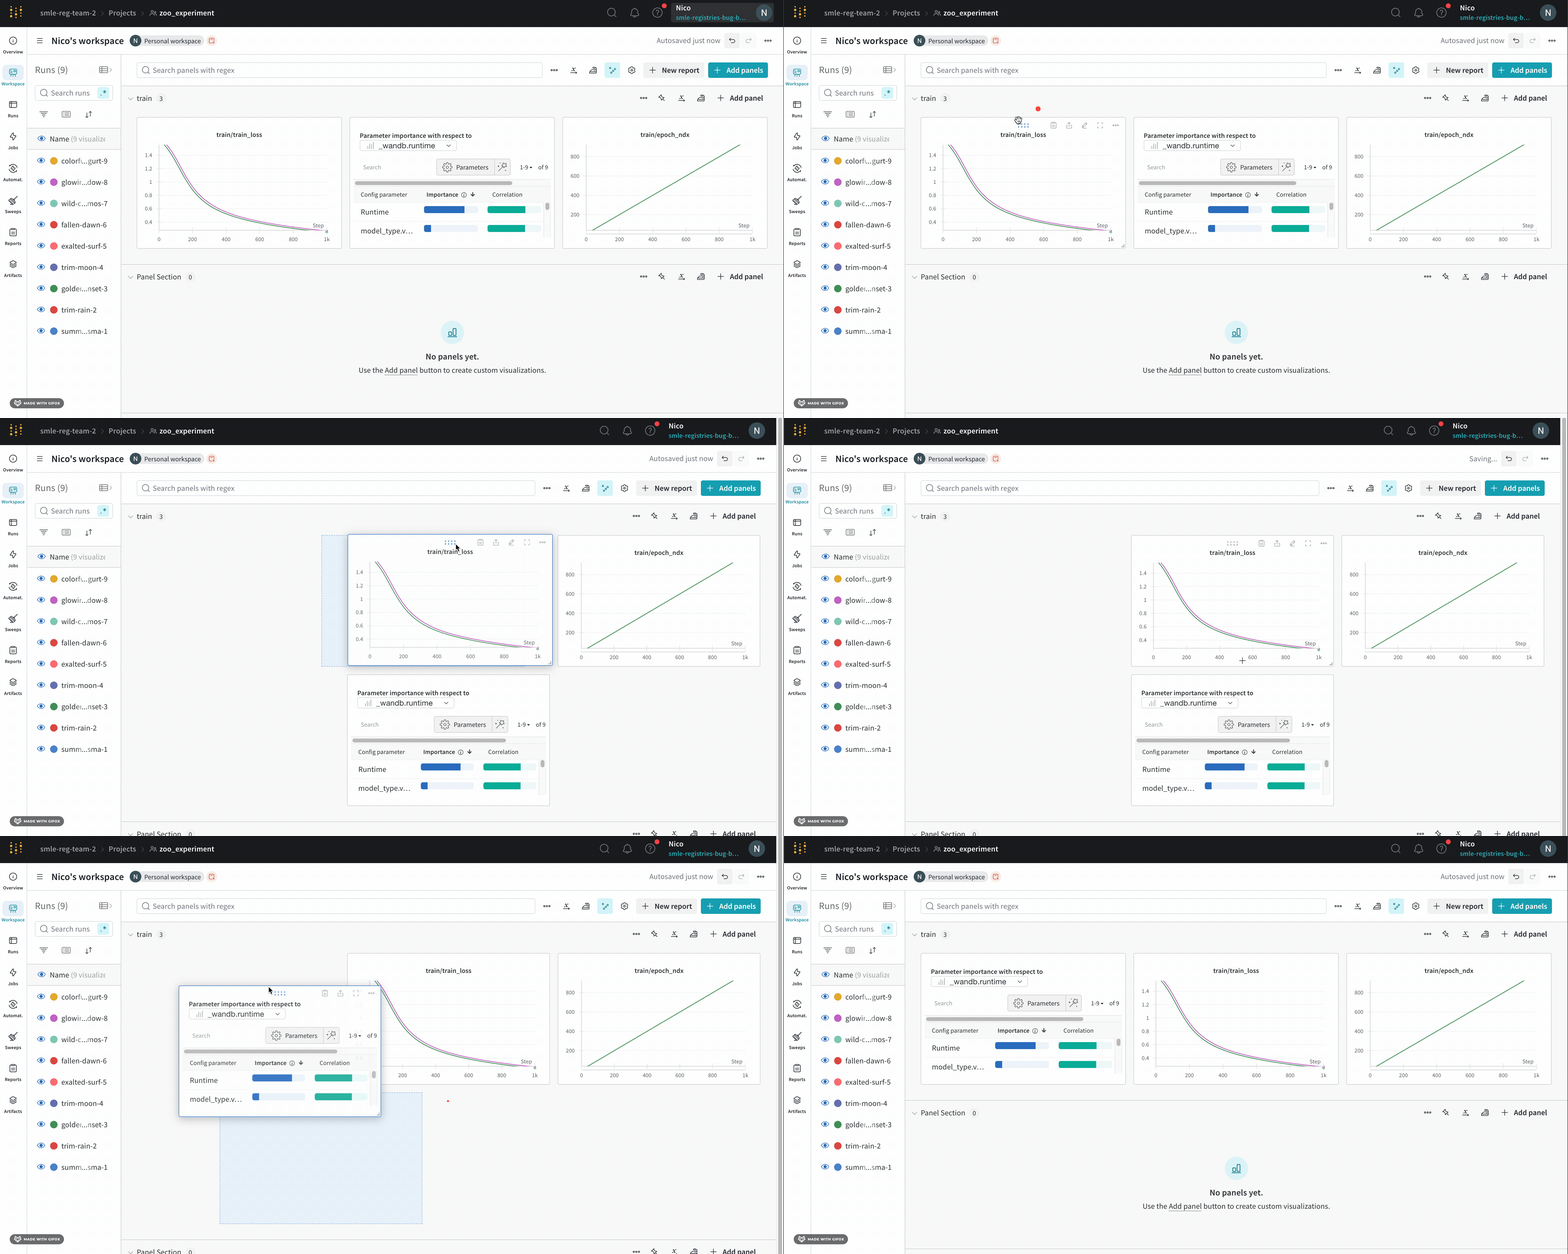 前述の表の設定に加えて、**Add section below**、**Add section above**、**Delete section**、**Add section to report** などを使用して、Workspace でのセクションの表示方法を編集することもできます。
パネル設定
個々のパネルの設定をカスタマイズすると、同じプロット上で複数のラインを比較したり、カスタム軸を計算したり、ラベルをリネームしたりできます。パネルの設定を編集するには、次の手順に従います。
1. 編集するパネルにカーソルを合わせます。
2. 表示される鉛筆アイコンを選択します。
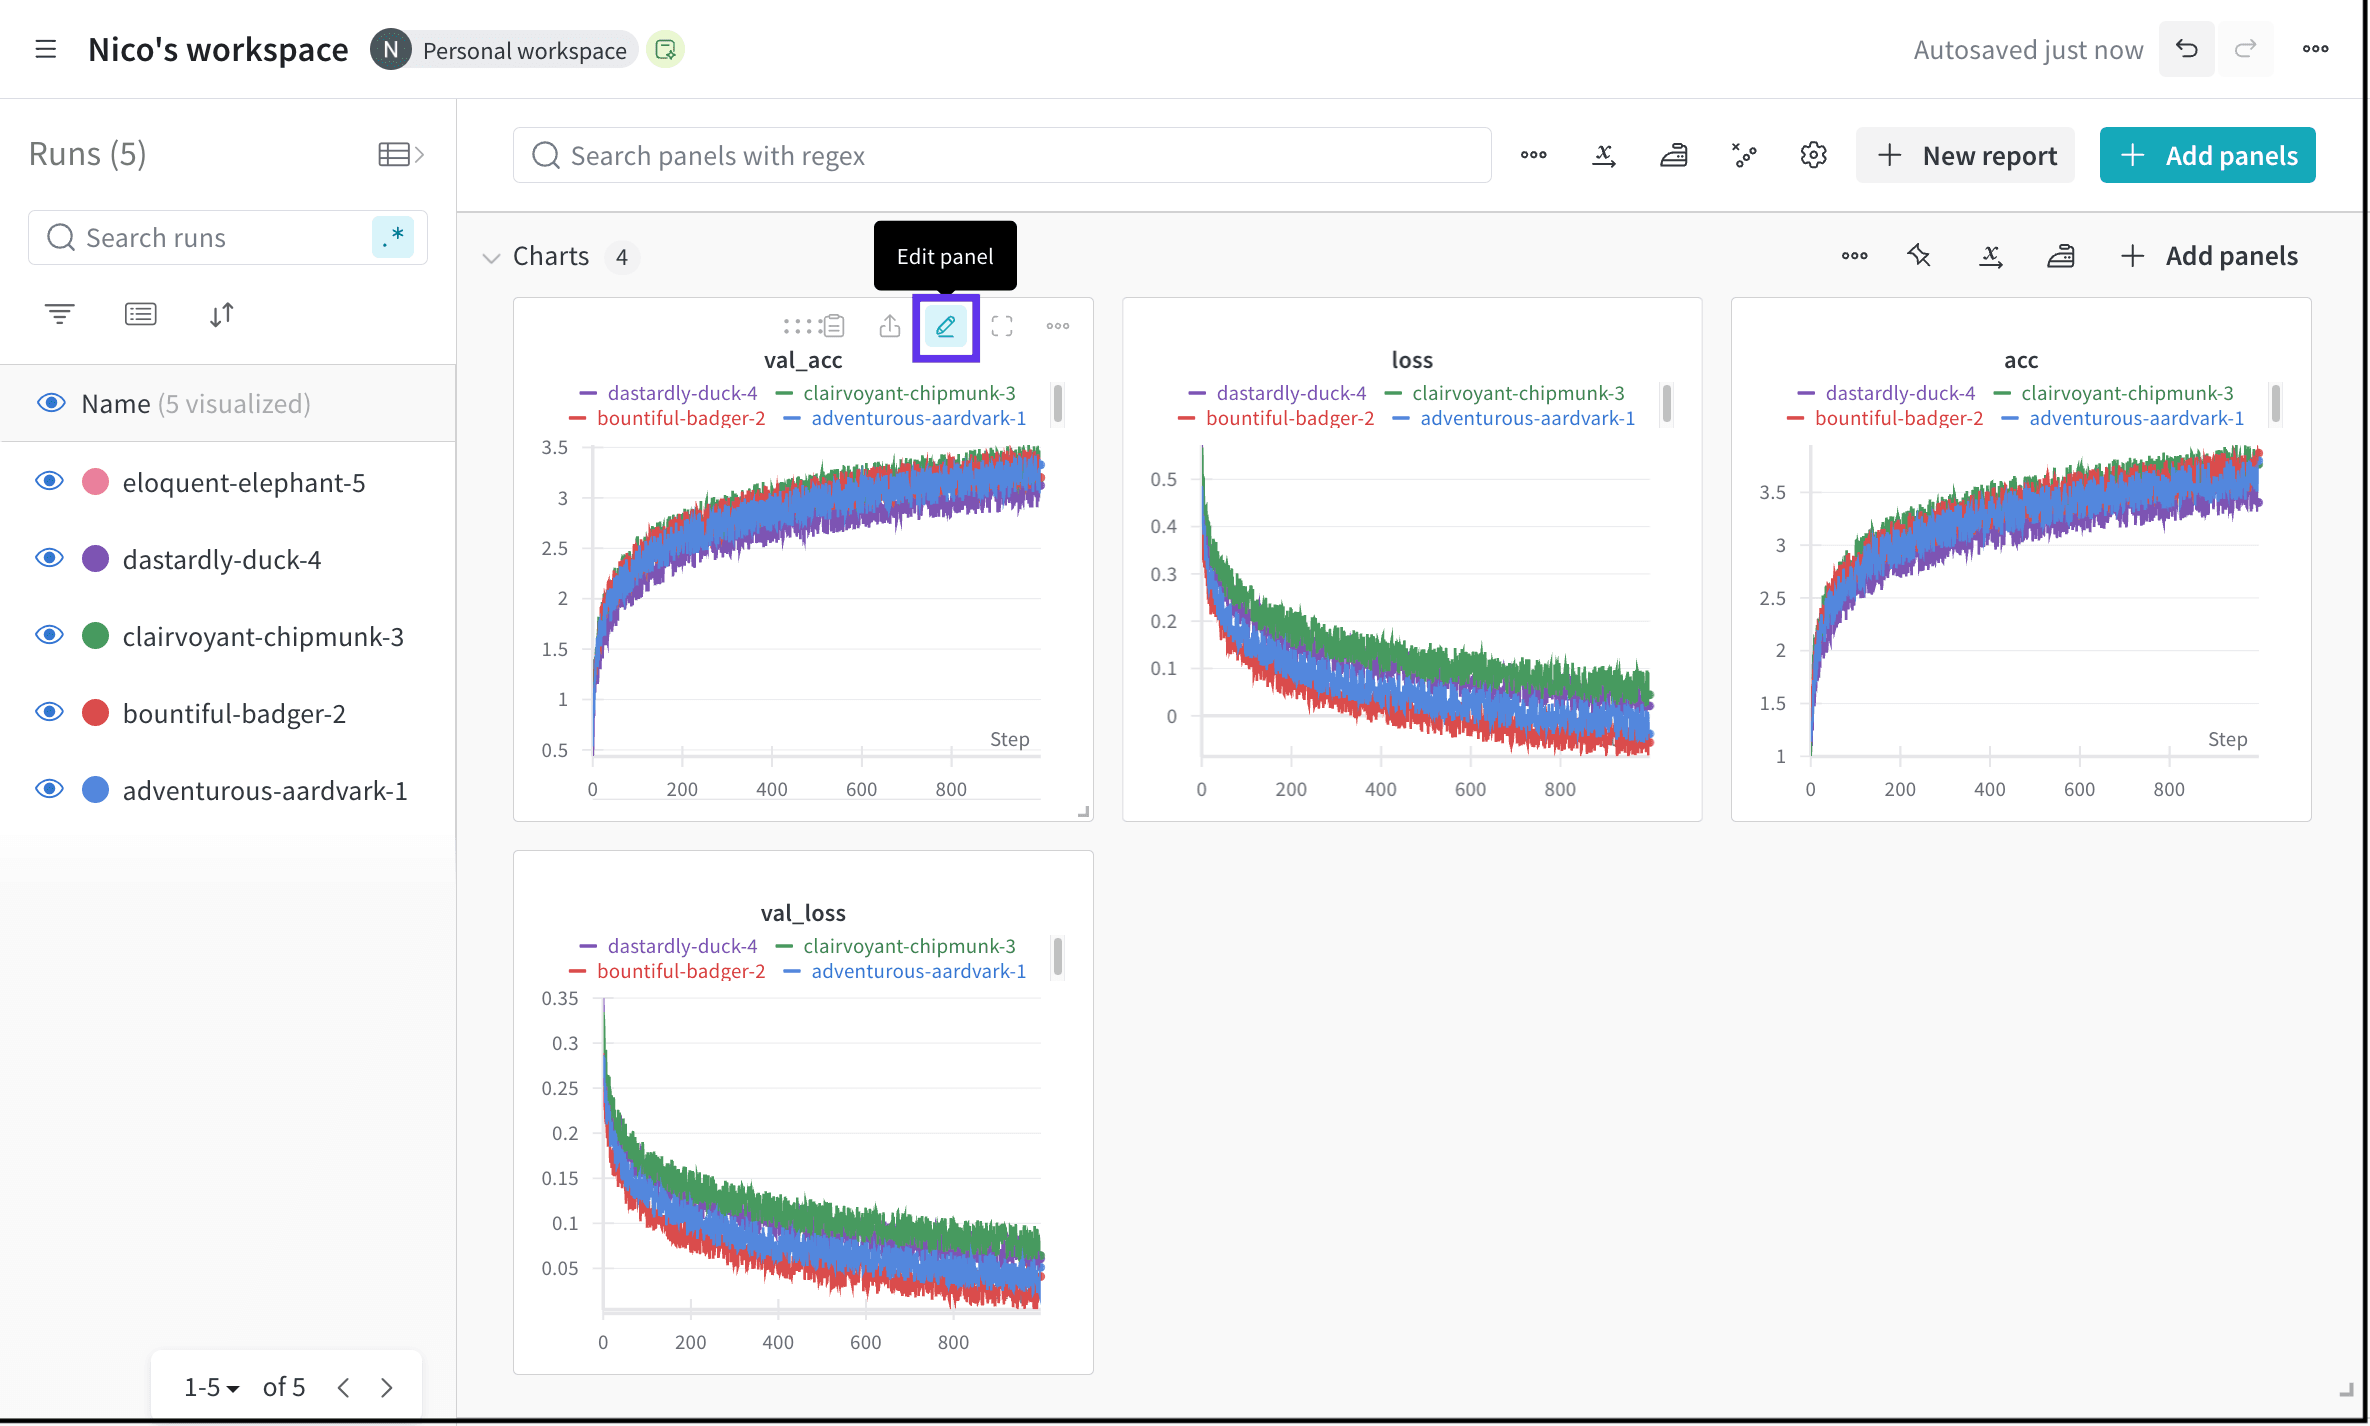 3. 表示されるモーダルで、パネルのデータや表示設定などを編集できます。
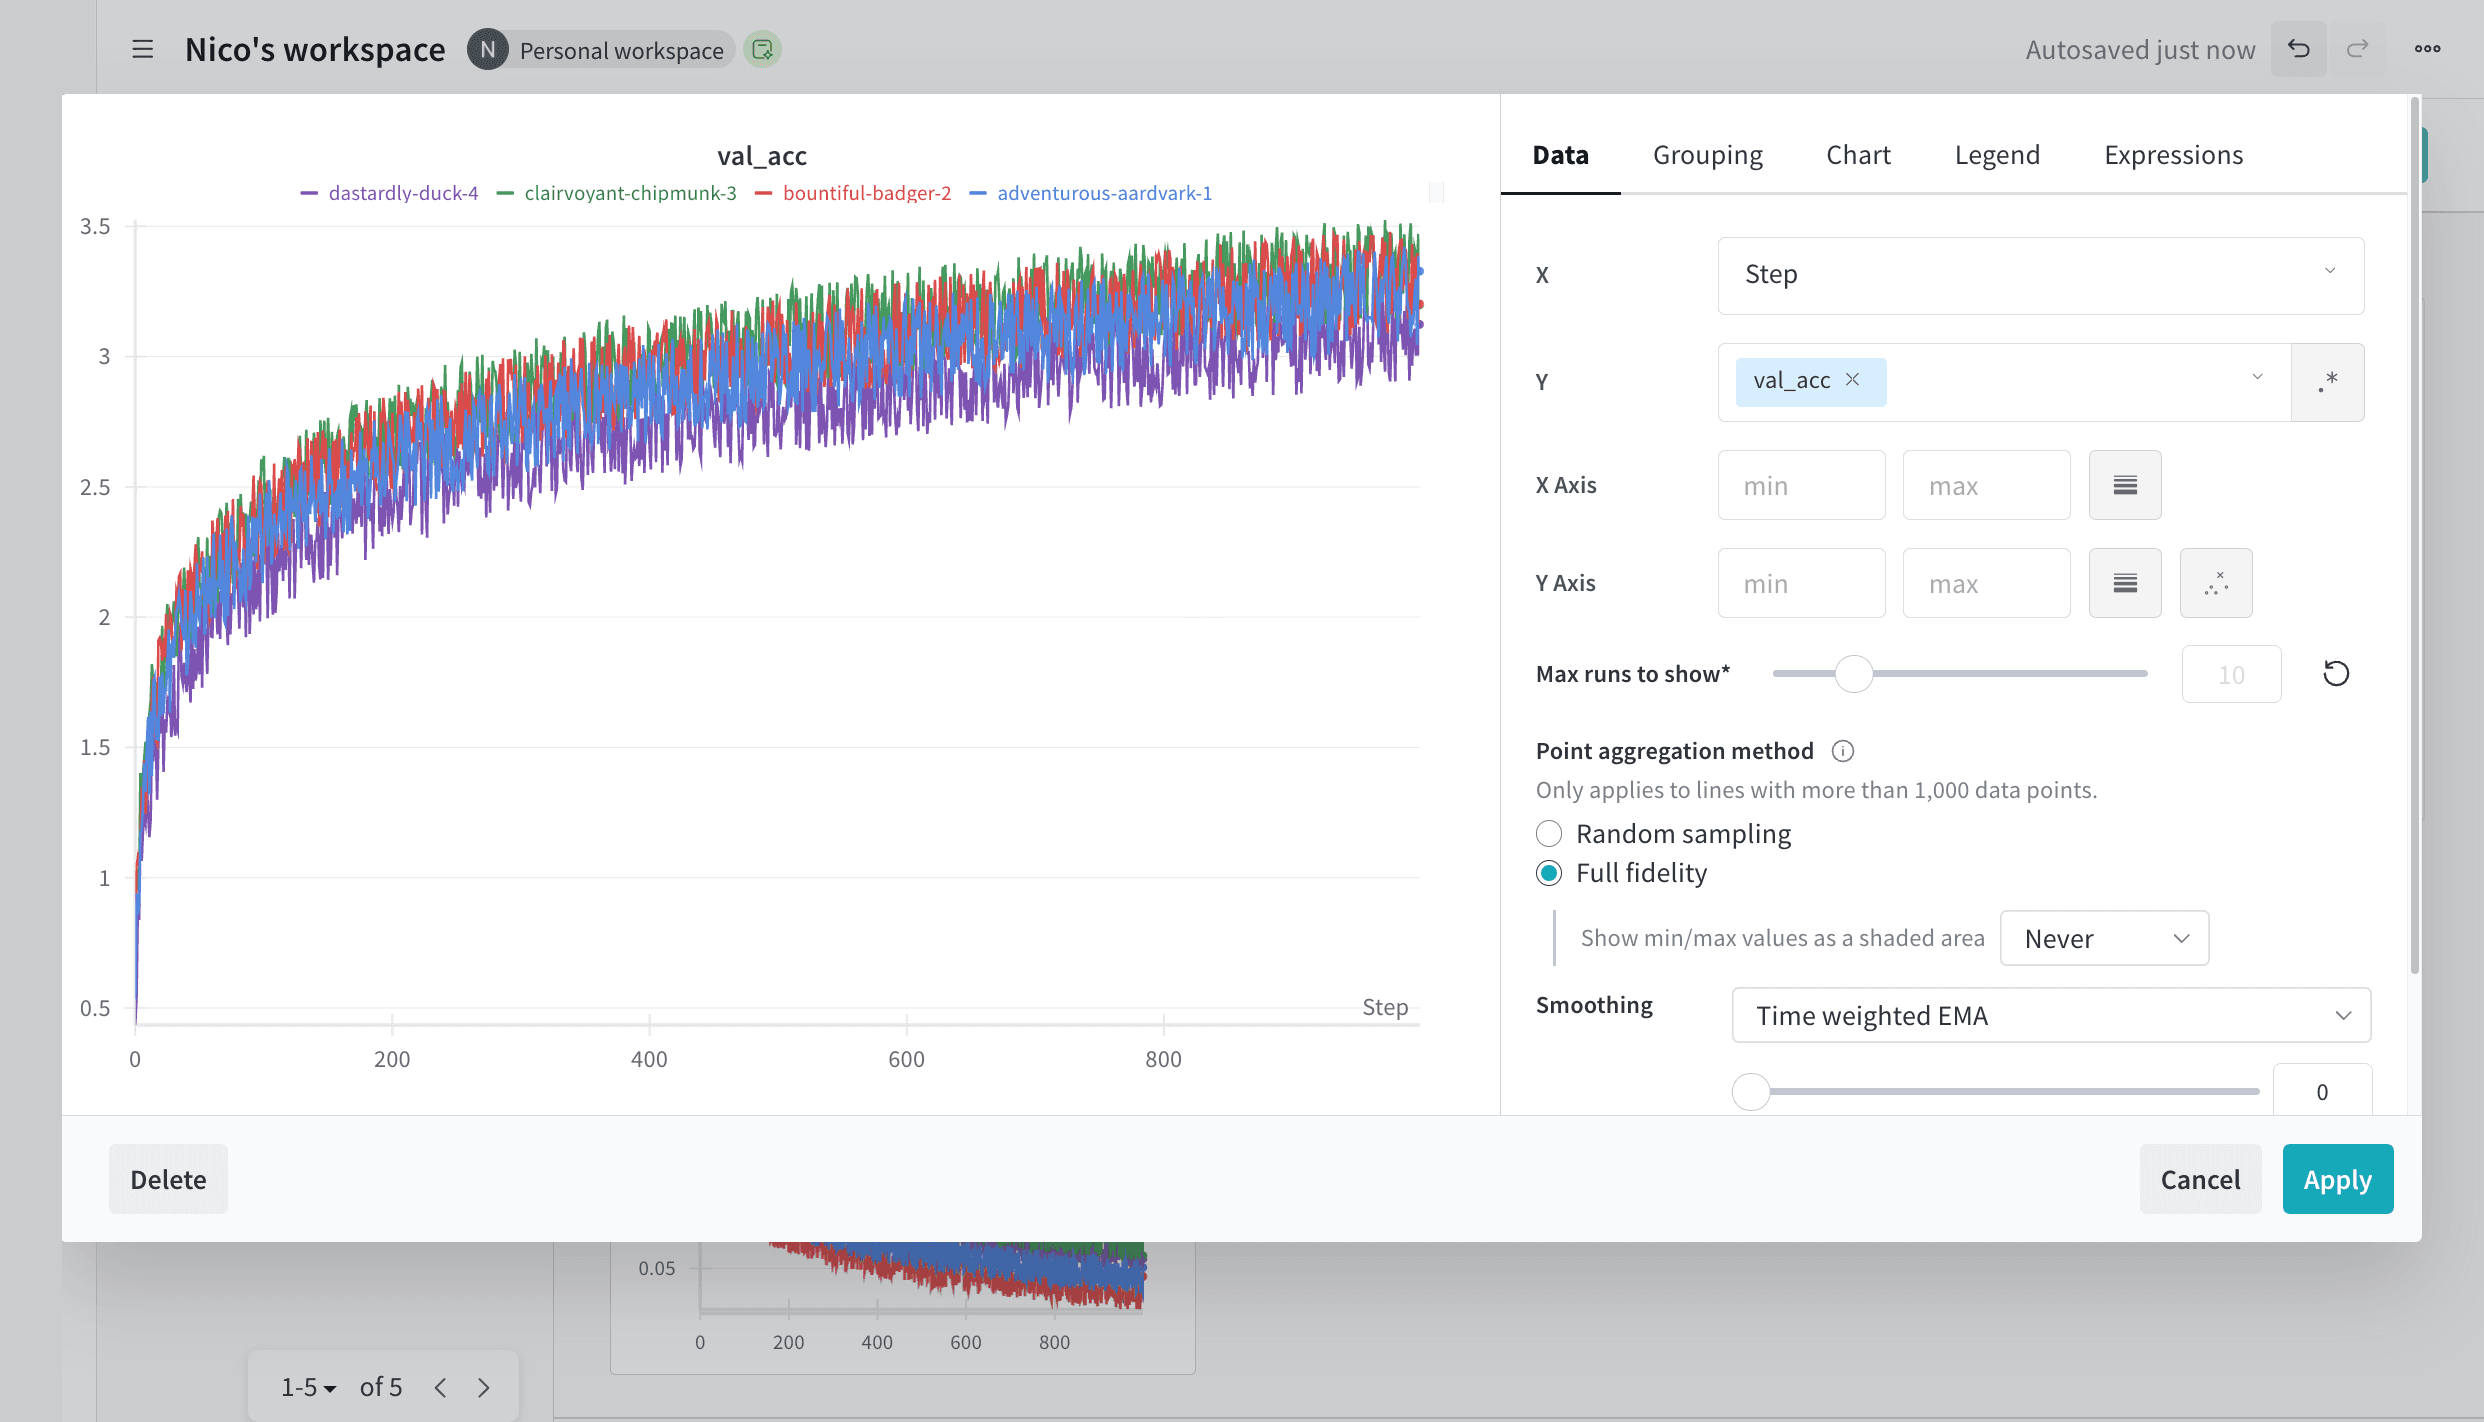 変更はそのパネルにのみ適用され、保存した時点で反映されます。パネルに適用できる設定の一覧については、[ラインパネル設定を編集する](/ja/products/wandb/app/features/panels/line-plot#edit-line-panel-settings)を参照してください。