> ## Documentation Index
> Fetch the complete documentation index at: https://docs.coreweave.com/llms.txt
> Use this file to discover all available pages before exploring further.
> Découvrez comment utiliser les tableaux W&B grâce à ce démarrage rapide de 5 minutes.
# Tutoriel : journaliser des tableaux, visualiser et interroger des données
export const ColabLink = ({url}) =>
Try in Colab
;
Ce guide de démarrage rapide montre comment journaliser des tableaux de données, puis les visualiser et les interroger.
Cliquez sur le bouton ci-dessous pour essayer un exemple de projet de démarrage rapide PyTorch sur les données MNIST.
1. Journaliser un tableau
Journalisez un tableau avec W\&B. Vous pouvez soit créer un nouveau tableau, soit transmettre un DataFrame Pandas.
Pour créer et journaliser un nouveau tableau, vous utiliserez :
* [`wandb.init()`](/fr/products/wandb/ref/python/functions/init) : crée un [run](/fr/products/wandb/runs) pour suivre les résultats.
* [`wandb.Table()`](/fr/products/wandb/ref/python/data-types/table) : crée un nouvel objet tableau.
* `columns` : définit les noms des colonnes.
* `data` : définit le contenu de chaque ligne.
* [`wandb.Run.log()`](/fr/products/wandb/ref/python/experiments/run#method-runlog) : journalise le tableau pour l’enregistrer dans W\&B.
Voici un exemple :
```python theme={"system"}
import wandb
with wandb.init(project="table-test") as run:
# Créer et journaliser un nouveau tableau.
my_table = wandb.Table(columns=["a", "b"], data=[["a1", "b1"], ["a2", "b2"]])
run.log({"Table Name": my_table})
```
Transmettez un DataFrame Pandas à `wandb.Table()` pour créer un nouveau tableau.
```python theme={"system"}
import wandb
import pandas as pd
df = pd.read_csv("my_data.csv")
with wandb.init(project="df-table") as run:
# Créer un nouveau tableau à partir du DataFrame
# et le journaliser dans W&B.
my_table = wandb.Table(dataframe=df)
run.log({"Table Name": my_table})
```
Pour plus d’informations sur les types de données pris en charge, consultez la page [`wandb.Table`](/fr/products/wandb/ref/python/data-types/table) du guide de référence de l’API W\&B.
2. Visualiser les tableaux dans le workspace de votre projet
Affichez le tableau obtenu dans votre workspace.
1. Accédez à votre projet dans la W\&B App.
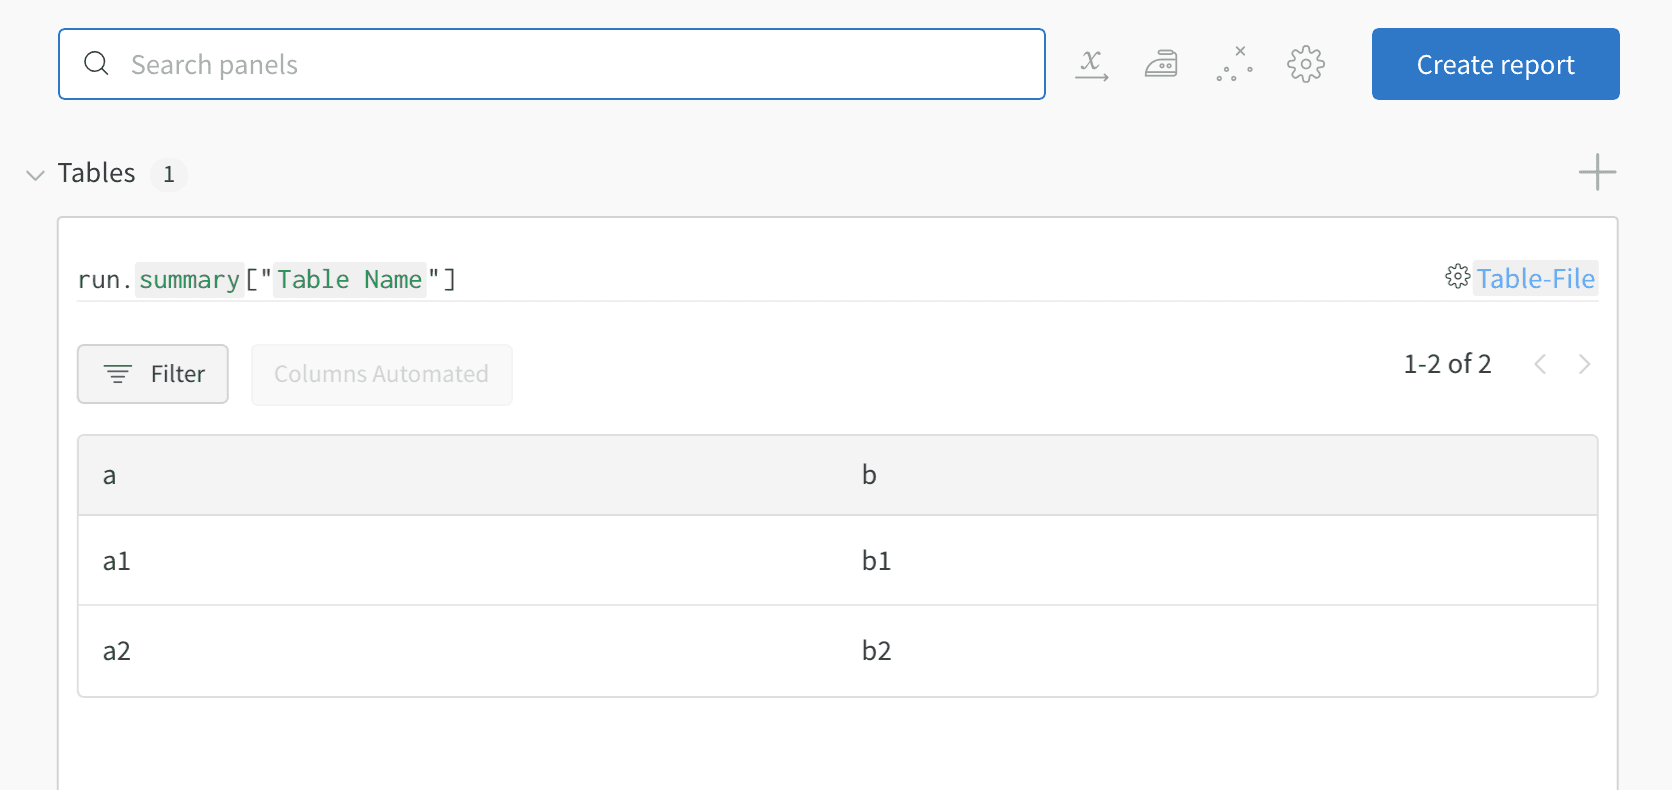
2. Sélectionnez le nom de votre run dans le workspace de votre projet. Un nouveau panneau est ajouté pour chaque clé de tableau unique.
Dans cet exemple, `my_table` est journalisé sous la clé `"Table Name"`.
3. Comparer plusieurs versions de modèles
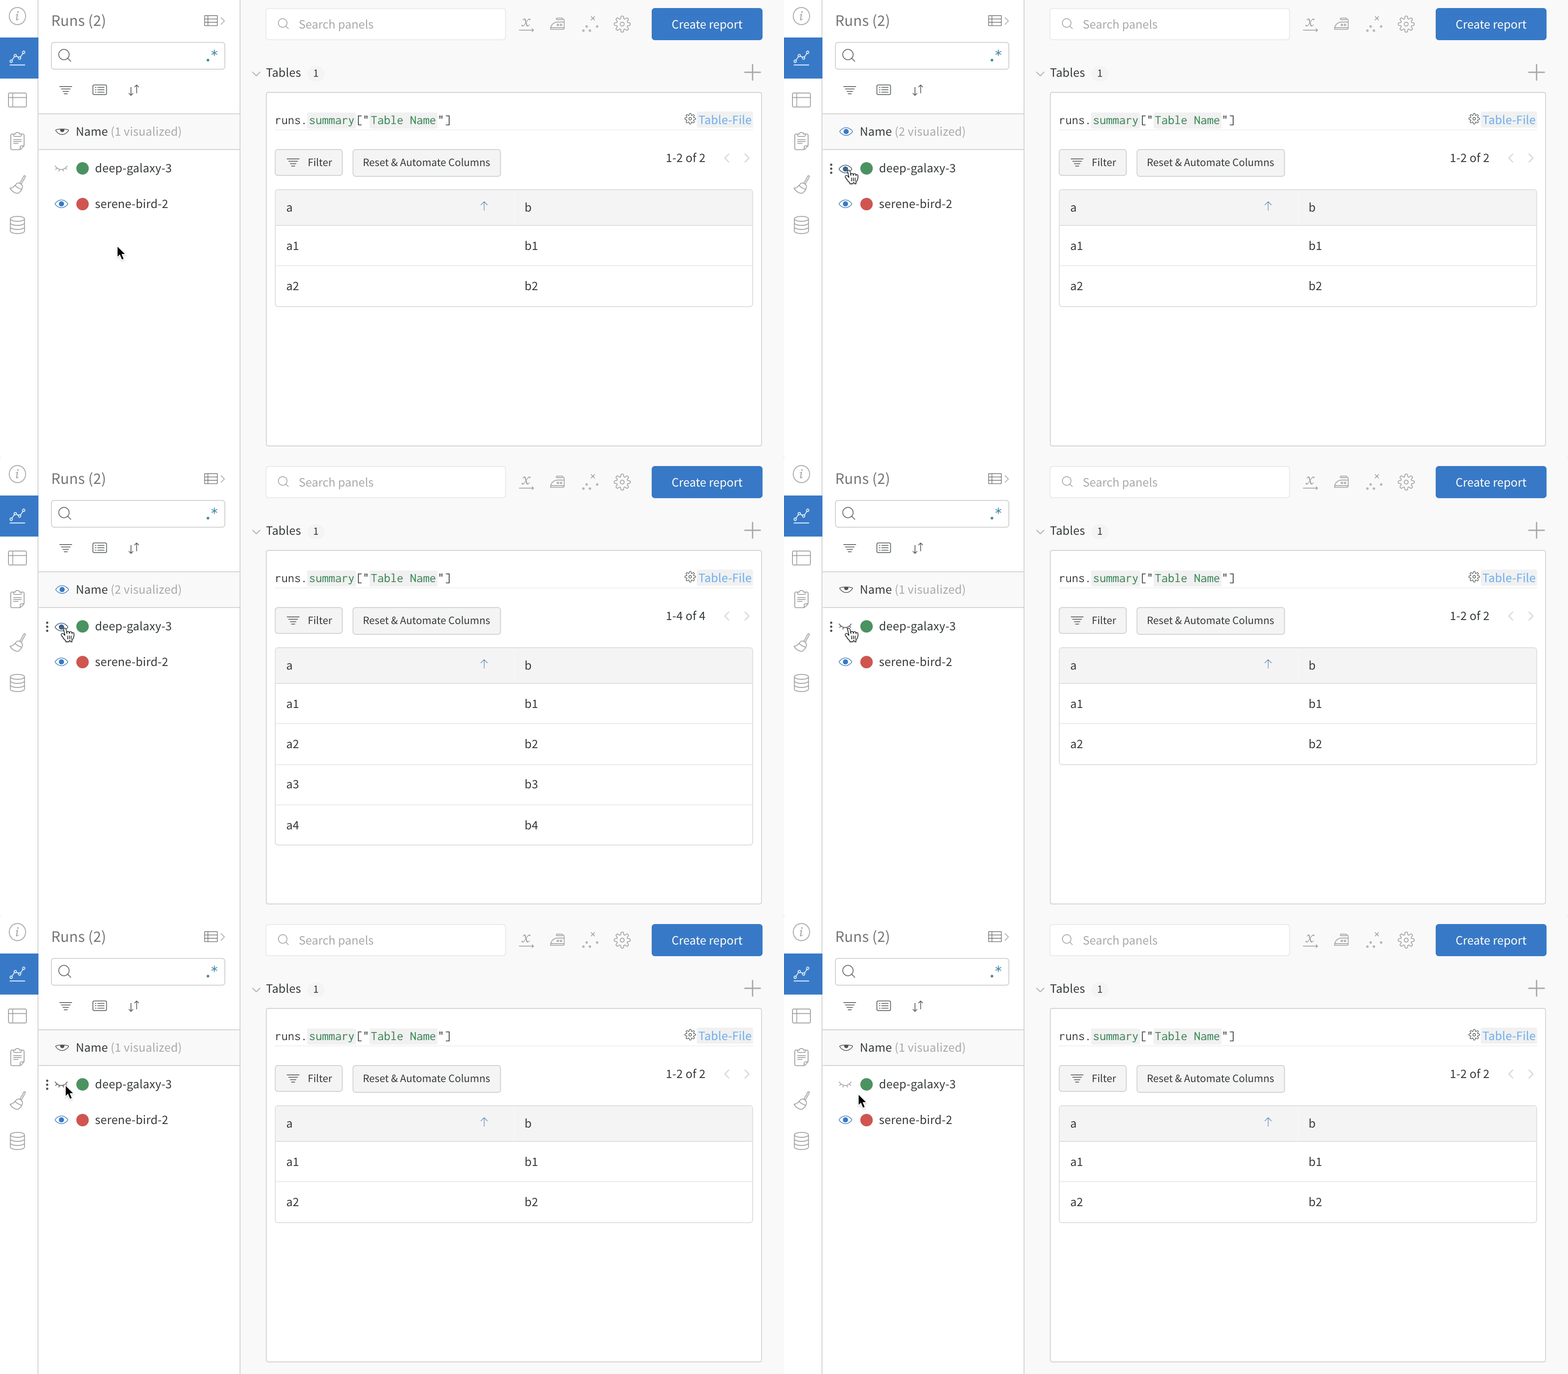
Journalisez des tableaux d’échantillons issus de plusieurs runs W\&B et comparez les résultats dans le Workspace du projet. Cet [exemple de workspace](https://wandb.ai/carey/table-test?workspace=user-carey) montre comment combiner dans un même tableau des lignes provenant de plusieurs versions différentes.
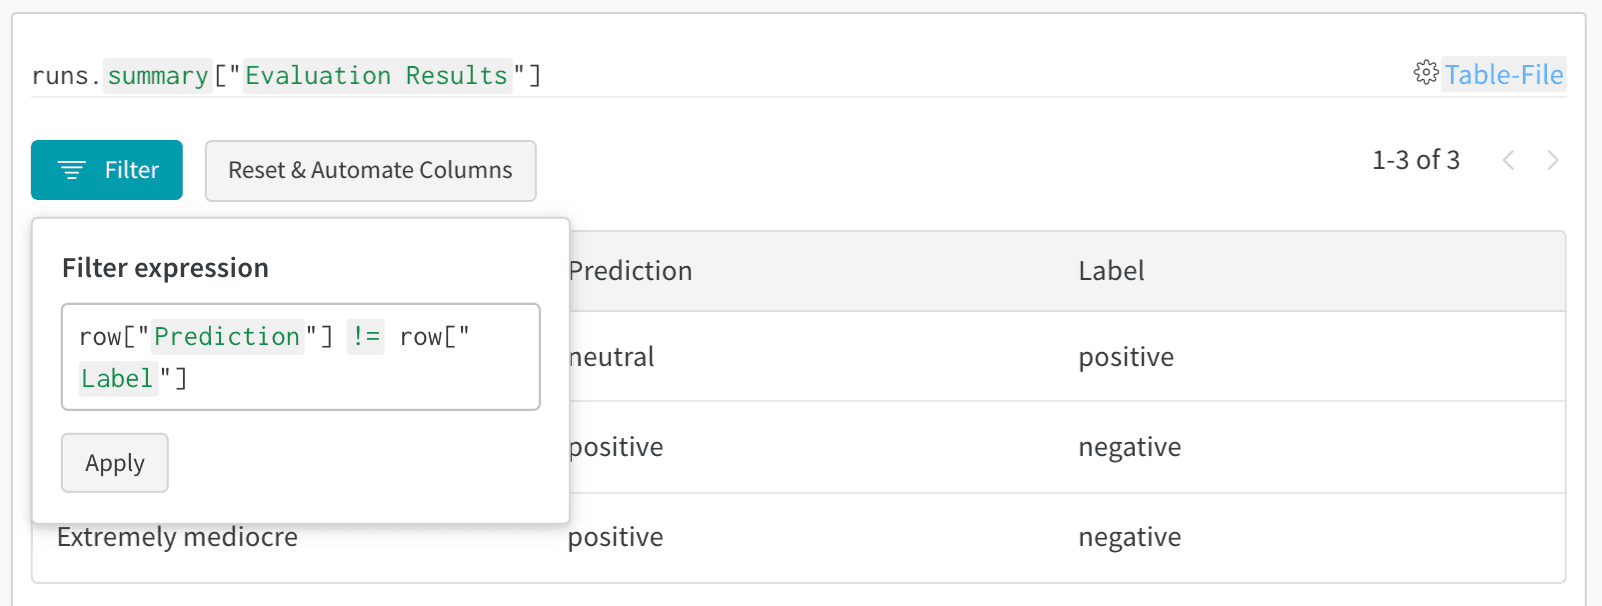
Utilisez les fonctionnalités de filtrage, de tri et de regroupement des tableaux pour explorer et évaluer les résultats des modèles.
## Related topics
- [Run](/fr/products/wandb/ref/python/experiments/run.md)
 Dans cet exemple, `my_table` est journalisé sous la clé `"Table Name"`.
 Utilisez les fonctionnalités de filtrage, de tri et de regroupement des tableaux pour explorer et évaluer les résultats des modèles.
 ## Related topics
- [Run](/fr/products/wandb/ref/python/experiments/run.md)
## Related topics
- [Run](/fr/products/wandb/ref/python/experiments/run.md)