4. Monitor jobs with Grafana
Monitoring Slurm jobs with CoreWeave Grafana
To open CoreWeave Grafana, first log in to the CoreWeave Cloud Console.
From the Console, either navigate to Grafana from the left-hand navigation or access it directly at https://cks-grafana.coreweave.com. From there, select Dashboards, then select the Slurm / Job metrics dashboard.
Slurm Job / Metrics dashboard
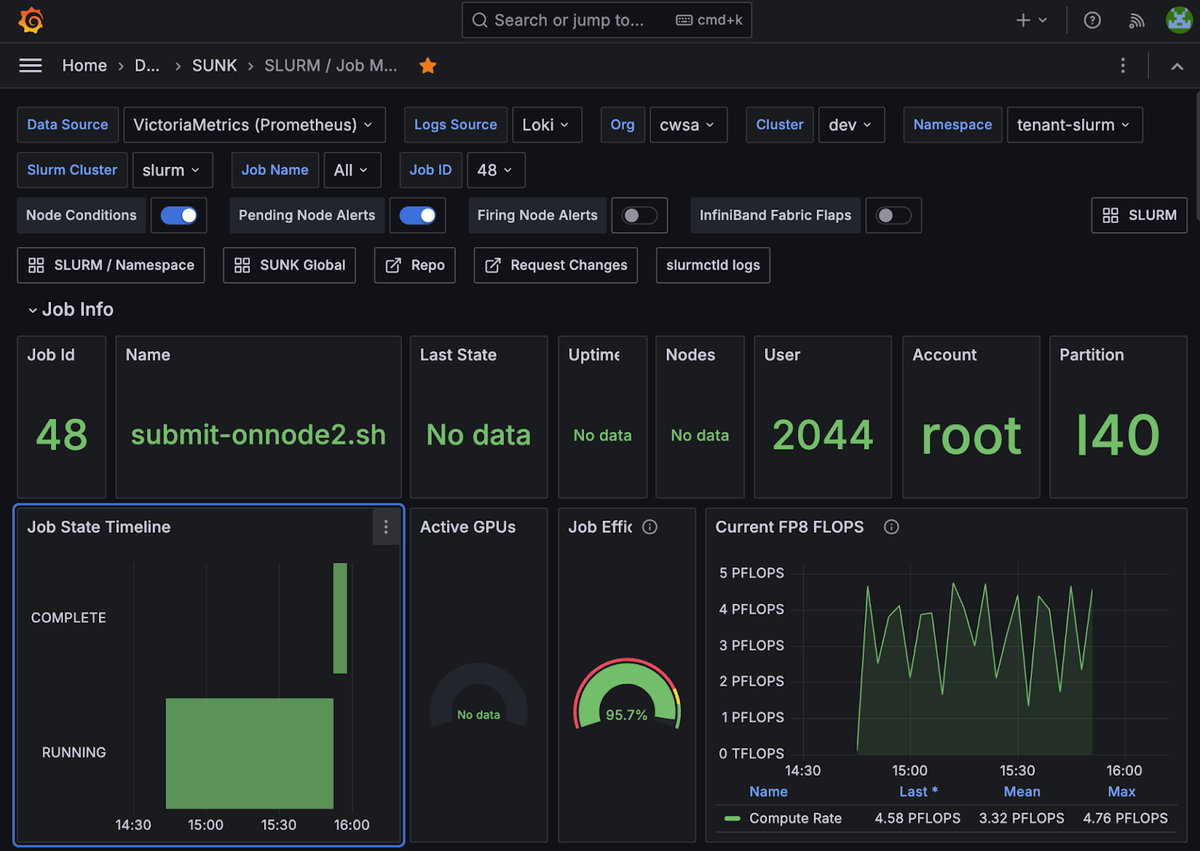
This dashboard displays metrics used for debugging and analyzing the performance of specific jobs within your cluster. It provides detailed information about the nodes running a given job, including alerts and node details.
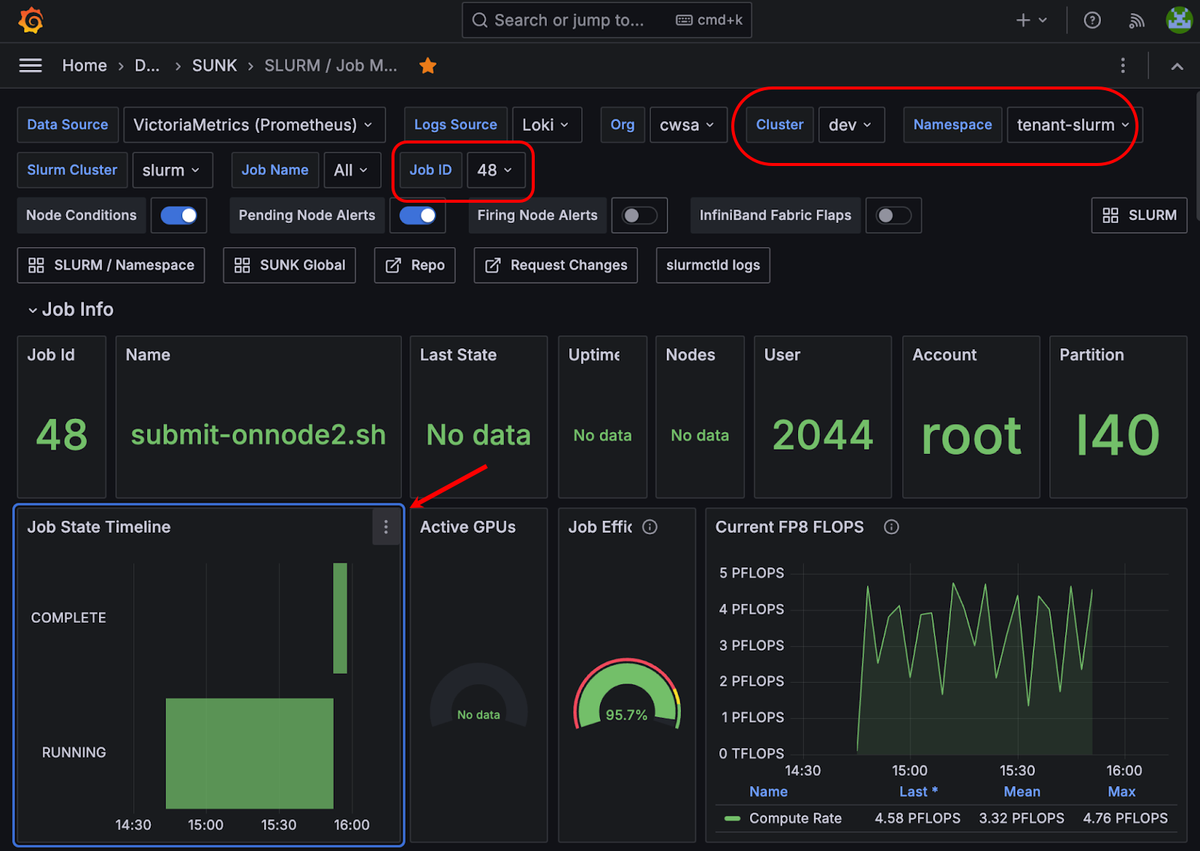
To display details about a specific job, including information about the nodes the job ran on, select the cluster and job of interest from the top of the dashboard. For example, in the image below, details on job 48 are displayed. The Job State Timeline in the lower left-hand corner shows that the job ran for over one hour.
The various states of the job - Pending, Running, Complete, and so on - are also captured here chronologically. This information can be useful for debugging and performance analysis.
On the right, we can see two key metrics:
- Job Efficiency captures an estimate of GPU usage during the job's run.
- Current FP8 FLOPS shows the compute rate as the job runs. It is very common to see a regular pattern of peaks and valleys as the job runs. Typically, areas with less compute usage are shown when data is being loaded or when checkpoints are being saved.
More information is displayed further down the dashboard page, including the nodes used to run the job and additional GPU metrics. To open a Grafana page on a specific node, select the displayed node ID.
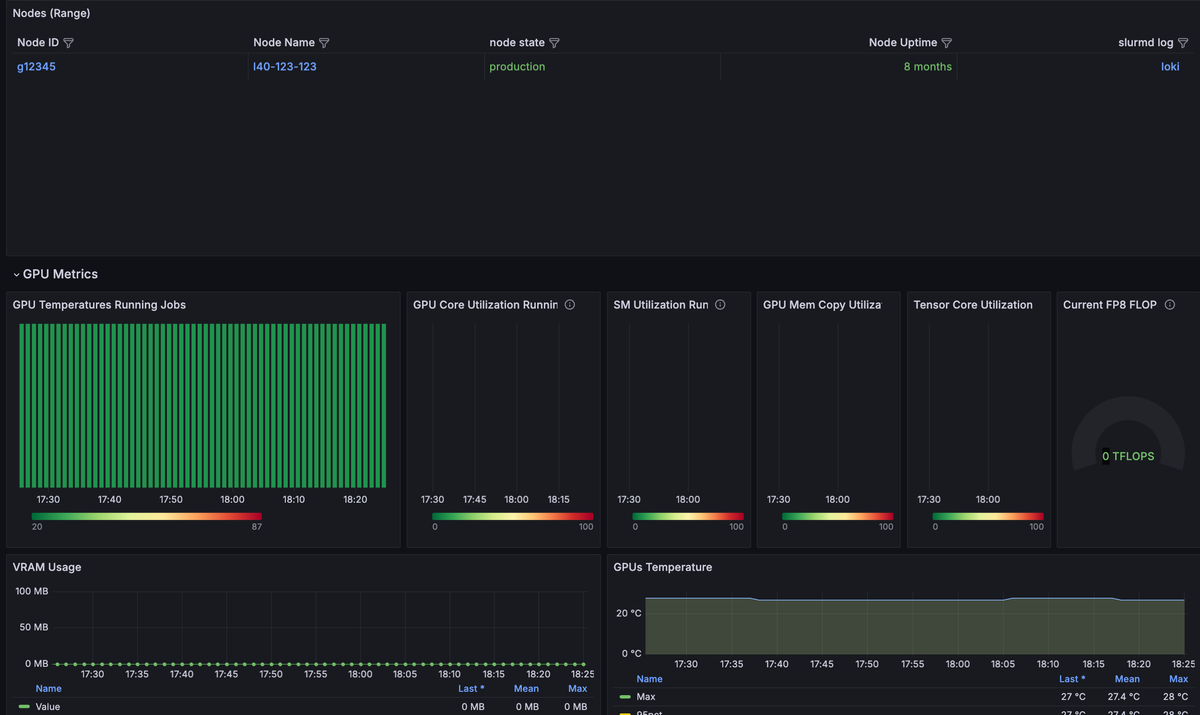
GPU metrics
The included GPU metrics display information on the job's run. At its most abstracted level, the presence of red indicates that the given aspect of the GPU is working very hard, whereas the presence of green signifies that the given part of the GPU is working less hard.
In this example, a 124M cell GPT2 test model is run on two L40 nodes, without InfiniBand.
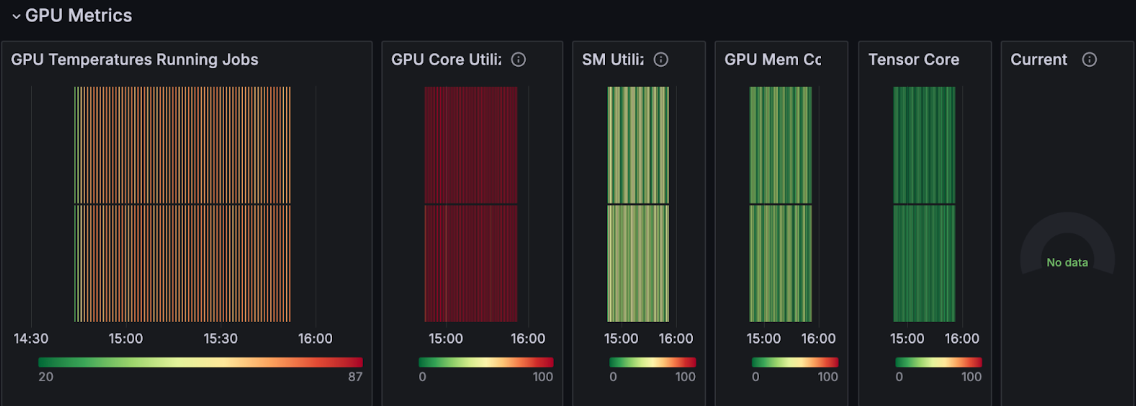
Different codes and data stress different parts of the GPU. A quick glance at the graphs is an easy way to quickly check if the job is running correctly.
At a glance, we can see that:
- The GPU temperature rises (progressing from a green average into an orange average) while the job is running. This is an easily understood indication that the GPUs are busy.
- The GPU Core Utilization is high, while GPU Mem is less used - an expected outcome for a relatively small model.
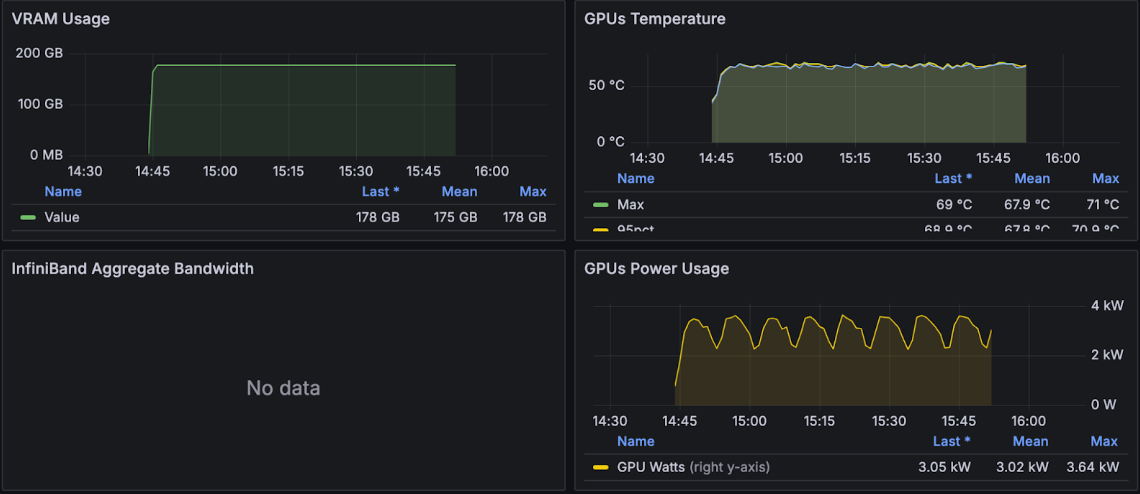
Even further down on this same dashboard, we can see the job uses about 175GB of memory, and the GPU temperature hovers around 68°C - both indicators that the job is progressing well. We also see the GPU power usage levels.
Filesystem metrics
Even further down the dashboard is information on the filesystem. Two metrics of importance displayed on the bottom left-hand side of the dashboard are the NFS Average Response/Request and NFS Total Read/Write rate.
- The NFS Average graphs indicate how well the filesystem is performing. A slowdown or spike indicates that the storage is slowing down, and that the job may perform better with faster or different storage, such as CoreWeave AI Object Storage.
- The NFS Total Read / Write Rate demonstrates the total
readandwriteoperations on the filesystem. When a job first begins, it is typical to see a largereadspike as the model and data are read in to the job. While the job runs, a regularwritespike is typical - this indicates when checkpoints are written out.
For more information on the metrics displayed in this dashboard, see: Slurm / Job Metrics.