4. Monitor performance and test autoscaling
Access Grafana dashboards and test autoscaling behavior of your vLLM inference deployment
Overview
Now that your vLLM inference service is running, you'll learn how to monitor its performance using Grafana dashboards and test the autoscaling capabilities. This step covers accessing metrics, setting up alerts, and validating autoscaling behavior.
For production deployments, consider using CoreWeave's managed monitoring stack instead of self-hosted Prometheus and Grafana for better reliability and maintenance.
Step 1: Access Grafana dashboard
Get your Grafana URL:
$kubectl get ingress observability-grafana -n monitoring \-o=jsonpath='{.spec.rules[0].host}' ; echo
Navigate to the URL in your browser and log in with:
- Username:
admin - Password: (You generated this in the Get Grafana credentials section.)
Step 2: View vLLM metrics
In Grafana:
- Go to Dashboards → Browse
- Select the vLLM Dashboard
- Monitor key metrics like:
- Token throughput
- Cache utilization
- Queue depth
Congratulations
You've deployed an open-source LLM on CKS with observability for monitoring. The remainder of the steps on this page are optional.
To free up your resources after completing this guide, be sure to complete the Cleanup steps.
Step 3: Set up alerts (optional)
Configure Grafana alerts for important metrics like:
- High error rates
- Elevated response times
- GPU memory usage
- Service availability
Step 4: Test autoscaling (optional)
If you installed KEDA, test the autoscaling behavior.
To scale on different metrics, you can create a custom ScaledObject. For information about ScaledObject, see the KEDA ScaledObject specification.
You can also change the autoscaling threshold in the helm values overrides: vllm.workload.deployment.autoscale.cacheUtilizationThreshold.
Generate load
Use the included load testing script. Navigate to the inference/basic/hack/tests directory and run the following command:
Note that it takes a few minutes to run.
$python load-test.py \--endpoint "https://$VLLM_ENDPOINT/v1" \--model "$VLLM_MODEL" \--prompts-file prompts.txt \--concurrency 64 \--requests 512 \--out results.json
You should see output similar to the following:
▶ Concurrency 64 …↳ 512/512 ok | median 41.598s | p95 99.423s | 1.19 rps | 1497.92 tpsWrote results to results.json
If you check results.json, you should see something similar to the following:
{"concurrency": 64,"requests": 512,"success": 512,"fail": 0,"median_latency_s": 41.598,"p95_latency_s": 99.423,"throughput_rps": 1.19,"tokens_per_second": 1497.92}
Monitor scaling
Watch the Pods scale up based on demand:
$kubectl get pods -n inference -w
Note that if the threshold for deploying more Pods isn't reached, the number of Pods will stay the same. This is expected.
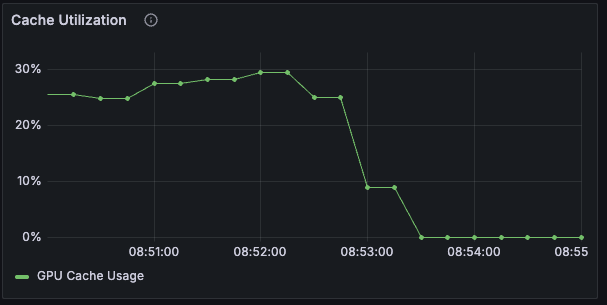
Check the cache utilization in Grafana to see the autoscaler trigger. You should see something similar to the following:
Step 5: Using your inference service (optional)
Python OpenAI client
Use the standard OpenAI Python library:
from openai import OpenAI# Initialize client with your vLLM endpointclient = OpenAI(base_url=f"https://{VLLM_ENDPOINT}/v1", # Replace with your VLLM_ENDPOINTapi_key="unused", # vLLM doesn't require API keys)# Chat completionresponse = client.chat.completions.create(model=VLLM_MODEL, # Replace with your VLLM_MODELmessages=[{"role": "system", "content": "You are a helpful assistant."},{"role": "user", "content": "What are the advantages of using CoreWeave for AI workloads?"}],max_tokens=500,temperature=0.7)print(response.choices[0].message.content)
Example base_url and model variables:
base_url=f"https://basic-inference.cw**-infer.coreweave.app/v1"model="meta-llama/Llama-3.1-8B-Instruct"
Streaming responses
For real-time applications, use streaming:
stream = client.chat.completions.create(model=VLLM_MODEL,messages=[{"role": "user", "content": "Explain quantum computing in simple terms."}],max_tokens=500,temperature=0.7,stream=True)for chunk in stream:if chunk.choices and chunk.choices[0].delta.content:print(chunk.choices[0].delta.content, end="", flush=True)
Step 6: Advanced configuration (optional)
Multi-node deployment
For larger models, enable multi-node deployment by setting:
vllm:workload:type: "leaderWorkerSet"leaderWorkerSet:replicas: 2workerReplicas: 2
Note: Multi-node requires LeaderWorkerSet to be installed in your cluster. See the LeaderWorkerSet documentation for installation instructions.
Custom model configuration
To use a different model, update your values file:
vllm:model: "mistralai/Mistral-7B-Instruct-v0.3"extraArgs:- "--max-model-len=8192"- "--gpu-memory-utilization=0.9"
Resource tuning
Adjust resource requests and limits based on your model size:
vllm:resources:requests:nvidia.com/gpu: 1memory: "32Gi"cpu: "8"limits:nvidia.com/gpu: 1memory: "64Gi"cpu: "16"
Cleanup
To remove the deployment and free up resources:
# Remove vLLM deployment$helm uninstall basic-inference --namespace inference# Remove monitoring stack$helm uninstall observability --namespace monitoring# Remove autoscaling$helm uninstall keda --namespace keda# Remove ingress$helm uninstall traefik --namespace traefik# Remove cert-manager$helm uninstall cert-manager --namespace cert-manager# Clean up secrets and storage$kubectl delete secret hf-token -n inference$kubectl delete -f hack/huggingface-model-cache.yaml# Remove namespaces$kubectl delete namespace inference monitoring keda traefik cert-manager
Next steps
Now that you have a working vLLM deployment, consider:
- Adding authentication: Implement API key validation or OAuth
- Model routing: Deploy multiple models with intelligent traffic routing
- Cost optimization: Set up Node autoscaling and instance usage
- Advanced monitoring: Configure custom alerts and dashboards
- CI/CD integration: Automate deployments with GitOps workflows