Create a CKS Cluster
Create and access CKS clusters
Create a cluster using the Cloud Console
To create a new CKS cluster using the Cloud Console, open the Cloud Console dashboard. The cluster dashboard is also the homepage of the Cloud Console, so it is the first dashboard you'll see. From here, you can create new CKS clusters, or view and manage deployed ones.
If you do not yet have any clusters, this dashboard will be empty.
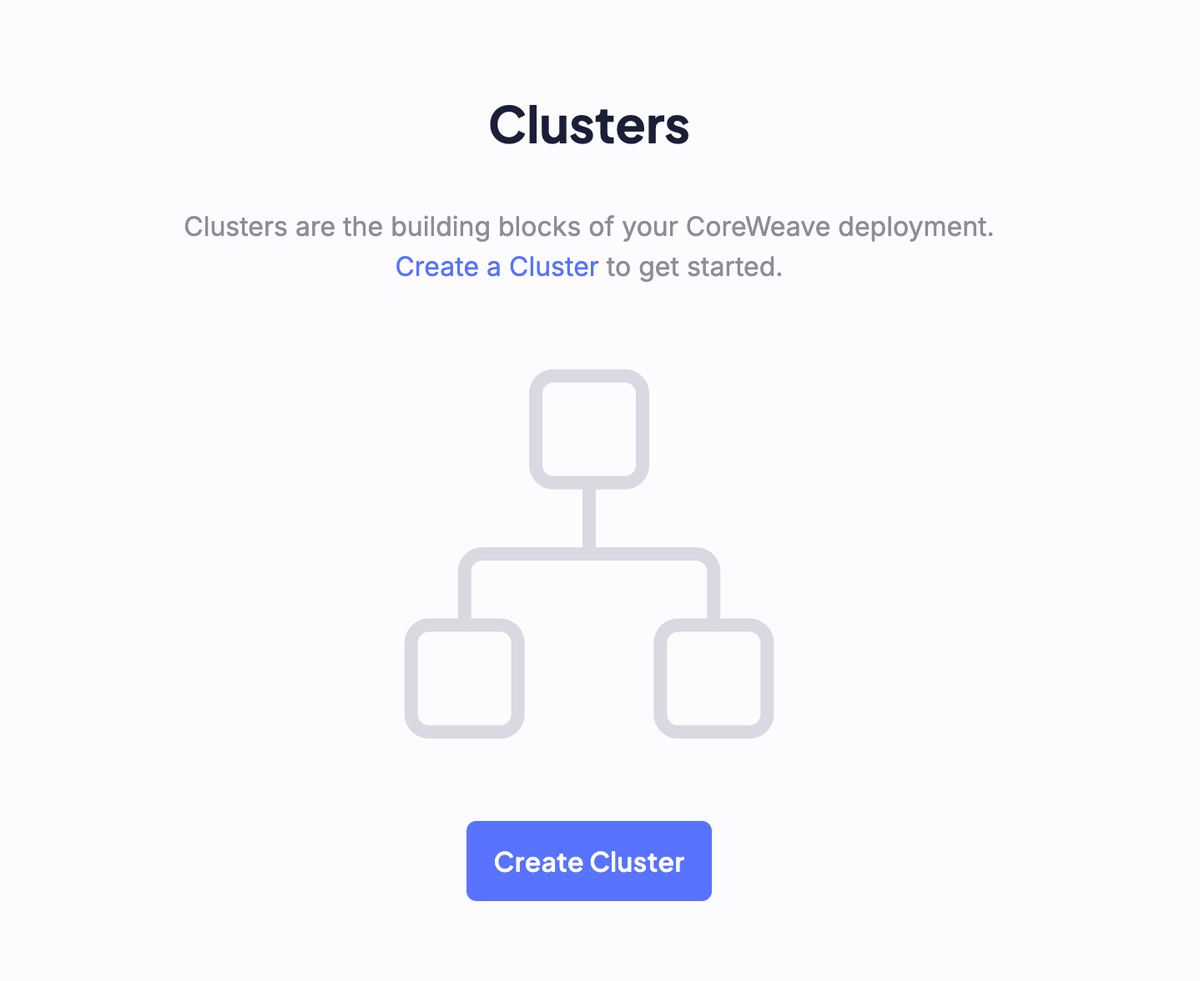
To begin creating a cluster, click the Create Cluster button.
1. Setup
In the first step, Setup, give your cluster a name, then select a Kubernetes version from a dropdown list of supported versions.
CKS generally supports the latest three versions of Kubernetes.
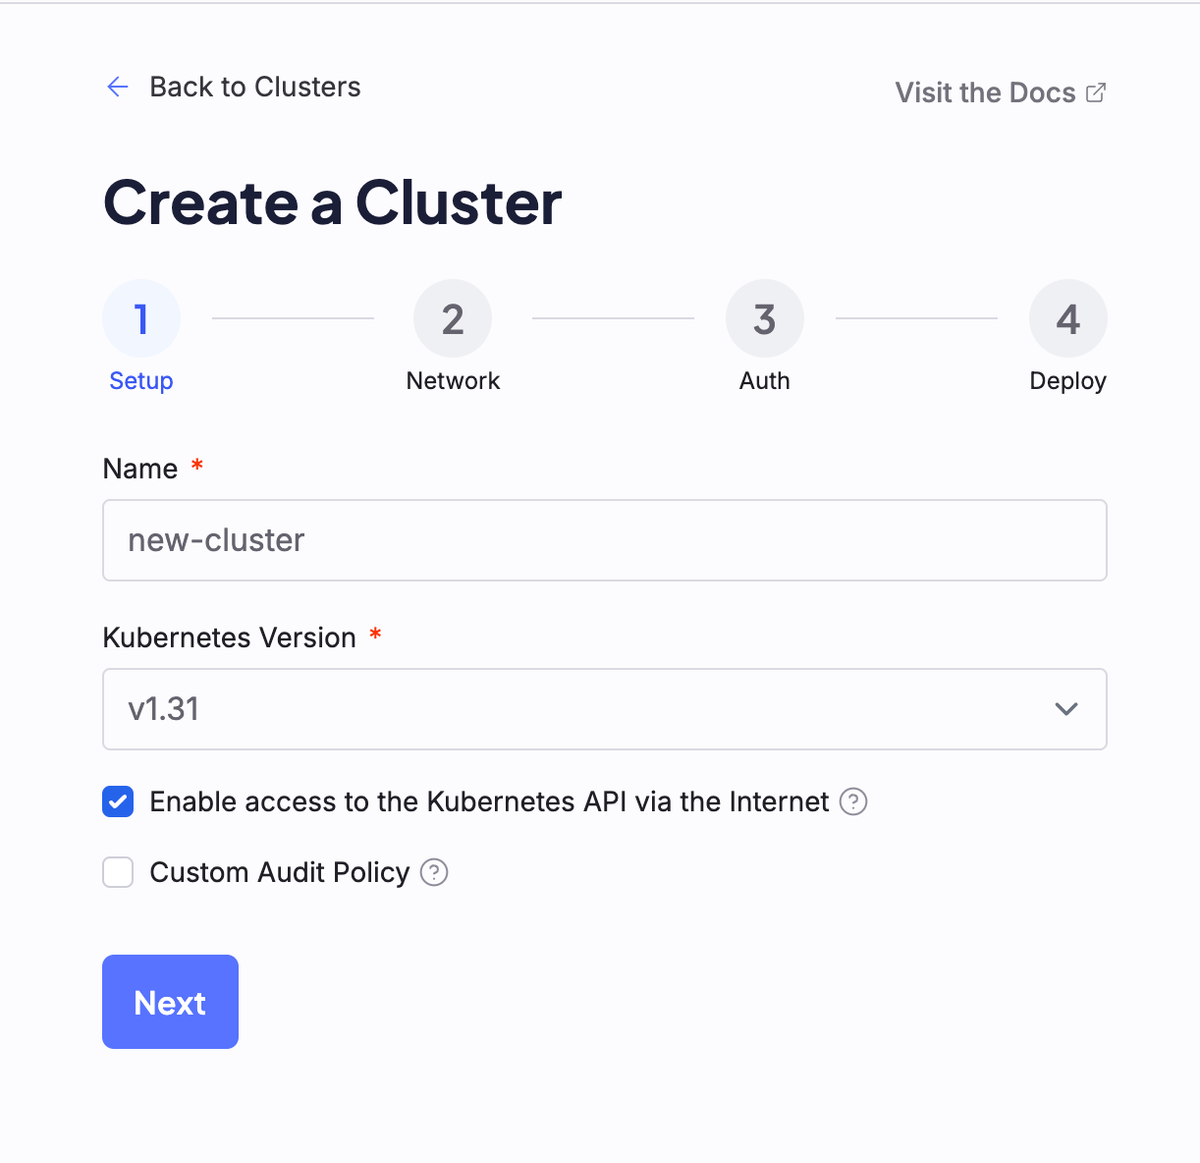
Next, select whether you'd like your cluster to be able to access the Kubernetes API via the Internet.
CKS currently only supports public clusters as a self-service option. For assistance setting up a private cluster, please reach out to our Support team.
To configure a custom Audit Policy for the cluster, select the Custom Audit Policy checkbox to open the Audit Policy YAML editor.
To learn more about cluster Audit Policies, see the official Kubernetes documentation.
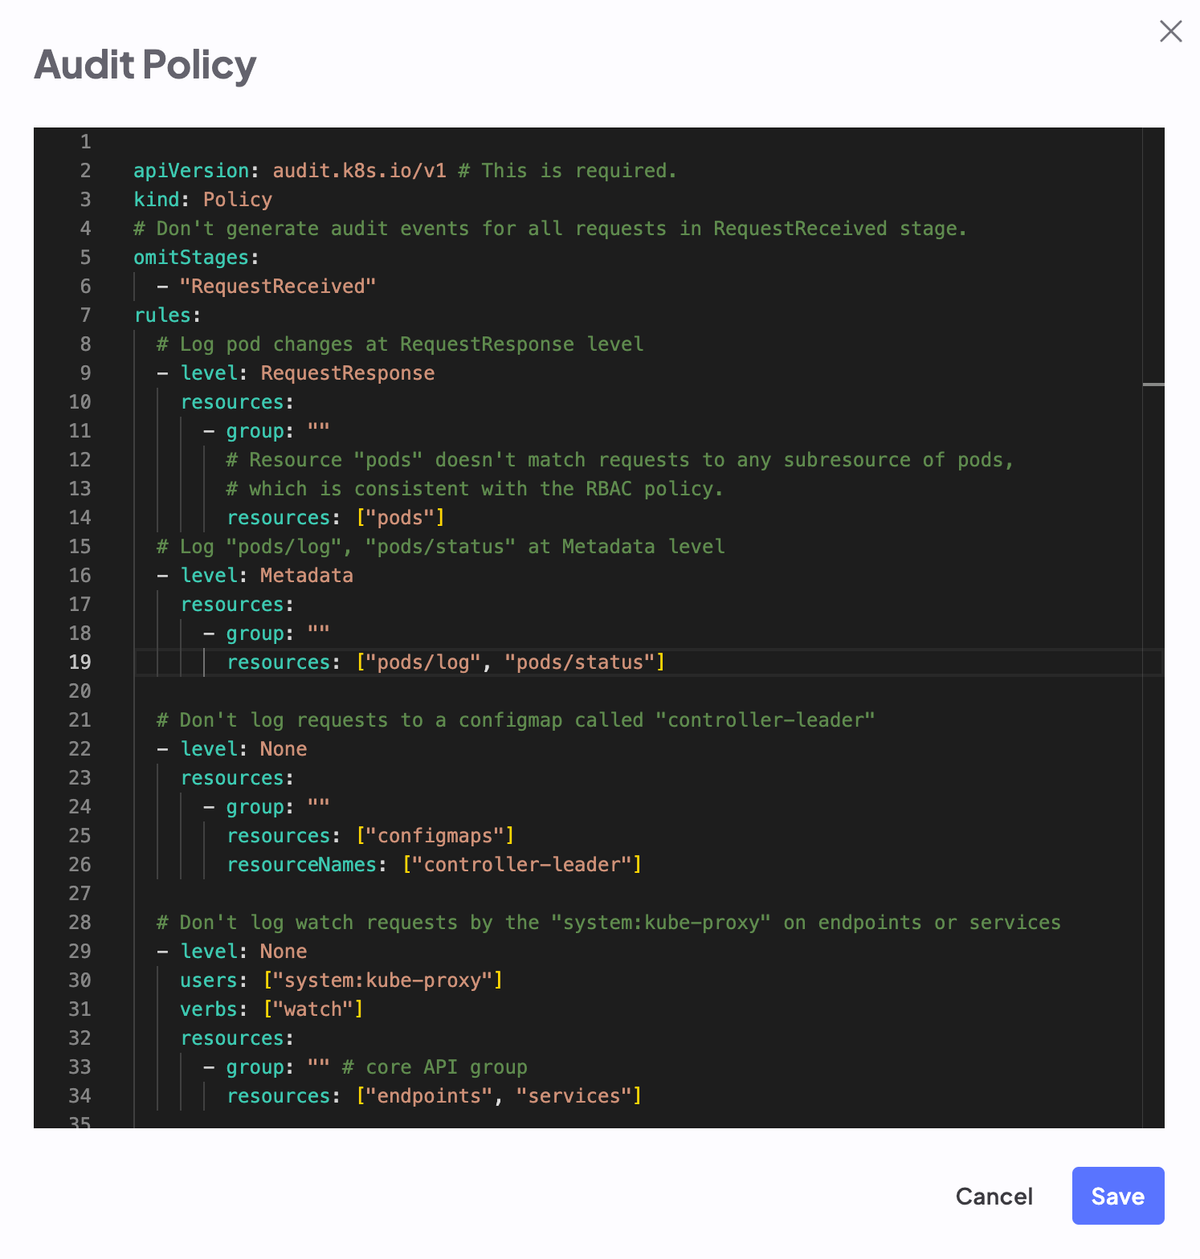
This window allows direct editing of the Audit Policy configuration file. Click the Save button in the bottom right corner to save the Audit Policy and resume the cluster creation process.
The Audit Policy is populated with the following settings by default, which can be changed as desired.
Click to expand: Default cluster audit policy
1apiVersion: audit.k8s.io/v1 # This is required.2kind: Policy3# Don't generate audit events for all requests in RequestReceived stage.4omitStages:5- "RequestReceived"6rules:7# Log pod changes at RequestResponse level8- level: RequestResponse9resources:10- group: ""11# Resource "pods" doesn't match requests to any subresource of pods,12# which is consistent with the RBAC policy.13resources: ["pods"]14# Log "pods/log", "pods/status" at Metadata level15- level: Metadata16resources:17- group: ""18resources: ["pods/log", "pods/status"]1920# Don't log requests to a configmap called "controller-leader"21- level: None22resources:23- group: ""24resources: ["configmaps"]25resourceNames: ["controller-leader"]2627# Don't log watch requests by the "system:kube-proxy" on endpoints or services28- level: None29users: ["system:kube-proxy"]30verbs: ["watch"]31resources:32- group: "" # core API group33resources: ["endpoints", "services"]3435# Don't log authenticated requests to certain non-resource URL paths.36- level: None37userGroups: ["system:authenticated"]38nonResourceURLs:39- "/api*" # Wildcard matching.40- "/version"4142# Log the request body of configmap changes in kube-system.43- level: Request44resources:45- group: "" # core API group46resources: ["configmaps"]47# This rule only applies to resources in the "kube-system" namespace.48# The empty string "" can be used to select non-namespaced resources.49namespaces: ["kube-system"]5051# Log configmap and secret changes in all other namespaces at the Metadata level.52- level: Metadata53resources:54- group: "" # core API group55resources: ["secrets", "configmaps"]5657# Log all other resources in core and extensions at the Request level.58- level: Request59resources:60- group: "" # core API group61- group: "extensions" # Version of group should NOT be included.6263# A catch-all rule to log all other requests at the Metadata level.64- level: Metadata65# Long-running requests like watches that fall under this rule will not66# generate an audit event in RequestReceived.67omitStages:68- "RequestReceived"
2. Network
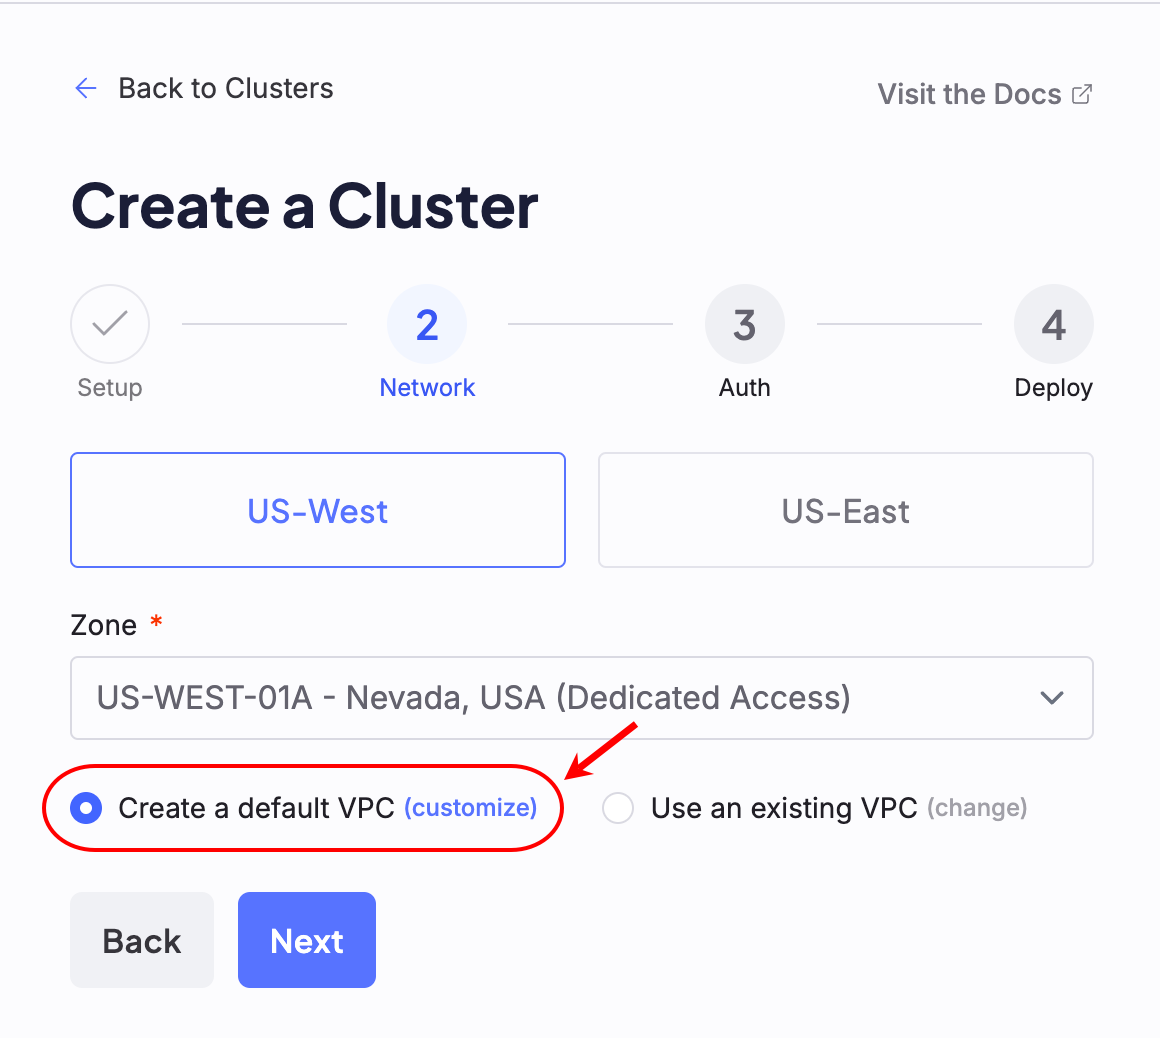
Next, configure the network settings for the cluster. On the Network configuration page, first select the Super Region where you'd like to deploy the cluster. Then, select the Zone.
Zone availability is subject to capacity.
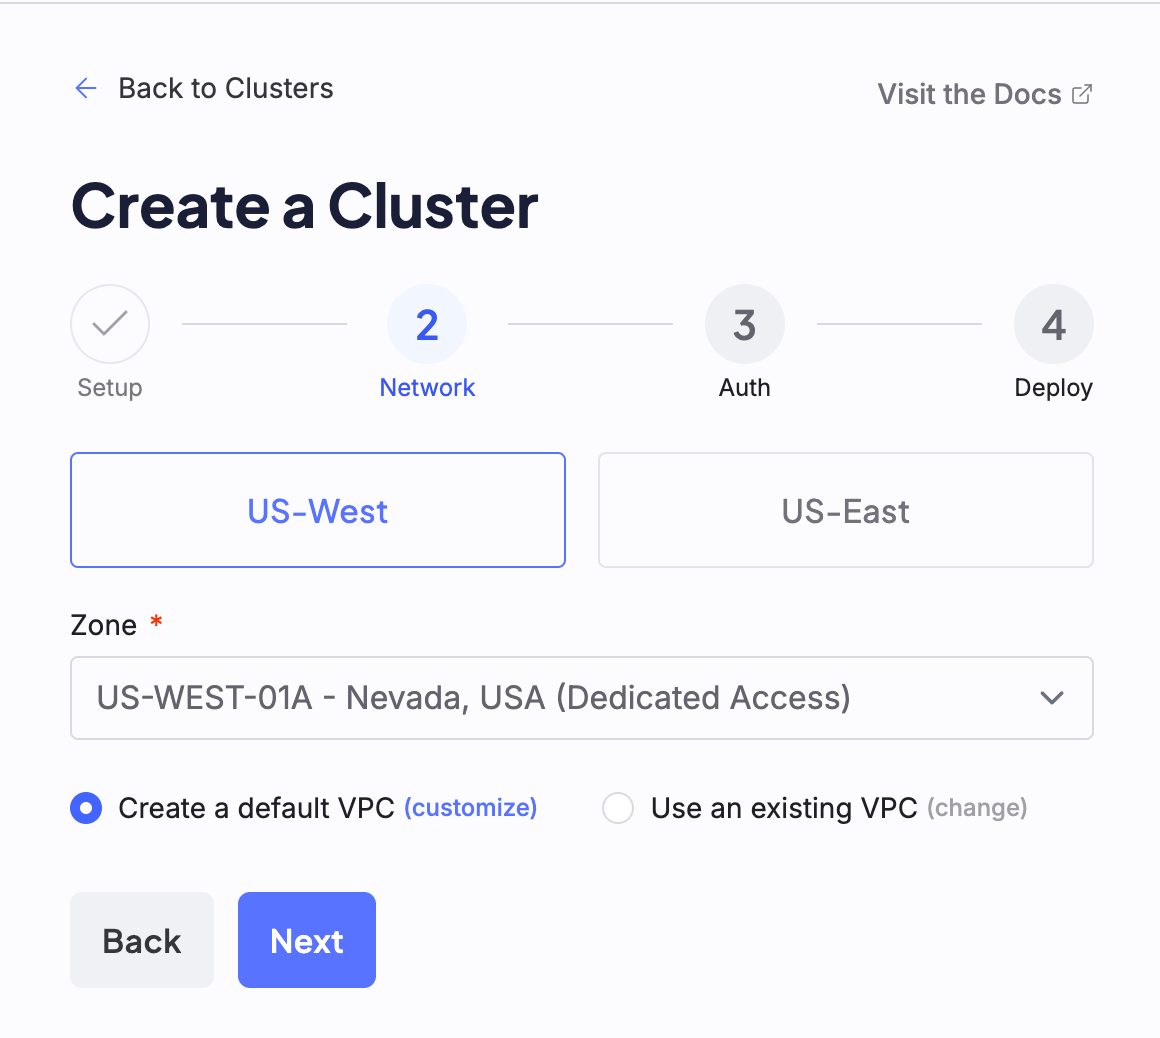
Select a VPC
If you have already created a VPC to use with this cluster, select the same Zone where that VPC was deployed. Otherwise, you can either elect to use a default VPC to be created for you during this process, or create a new custom VPC.
Default VPCs can still be customized from this page, by clicking the Customize option beside the Create a default VPC radio button.
This opens a configuration screen, where the available VPC prefixes and Host Prefixes may be adjusted as desired. The default Host Prefix assigned to the default VPC is also seen here.
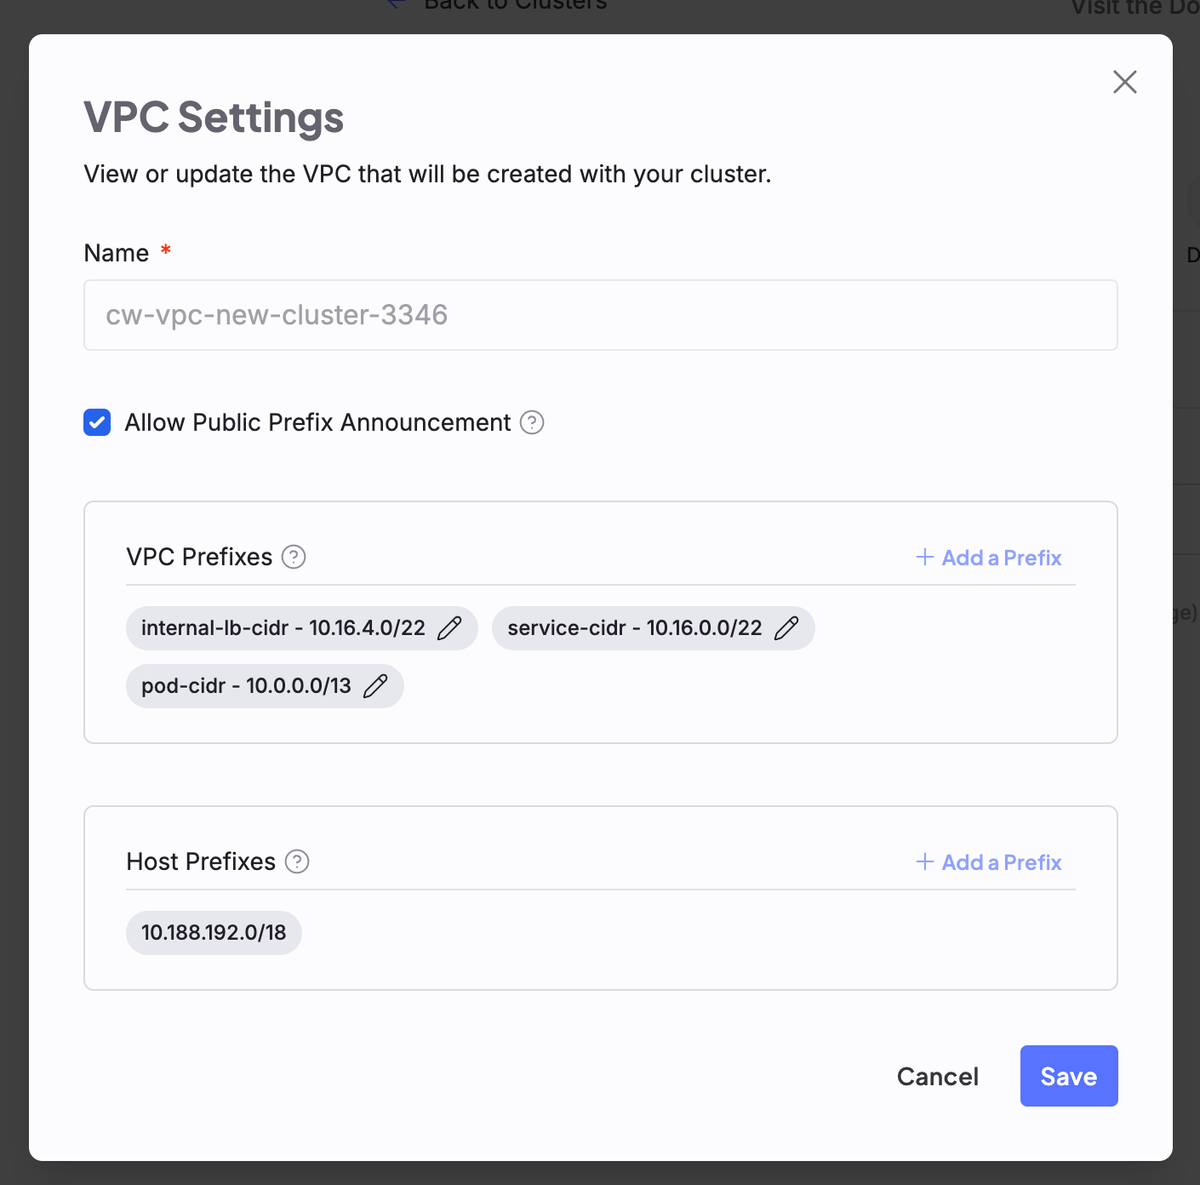
Each Zone features its own default prefixes, which are used to populate default VPCs. These can be changed. Refer to Regions to see each Zone's default prefixes.
3. Auth
The Auth screen exposes authentication and authorization configuration options, which may be enabled or disabled by toggling them on or off on this screen. Selecting any of these options causes additional configuration fields to appear.
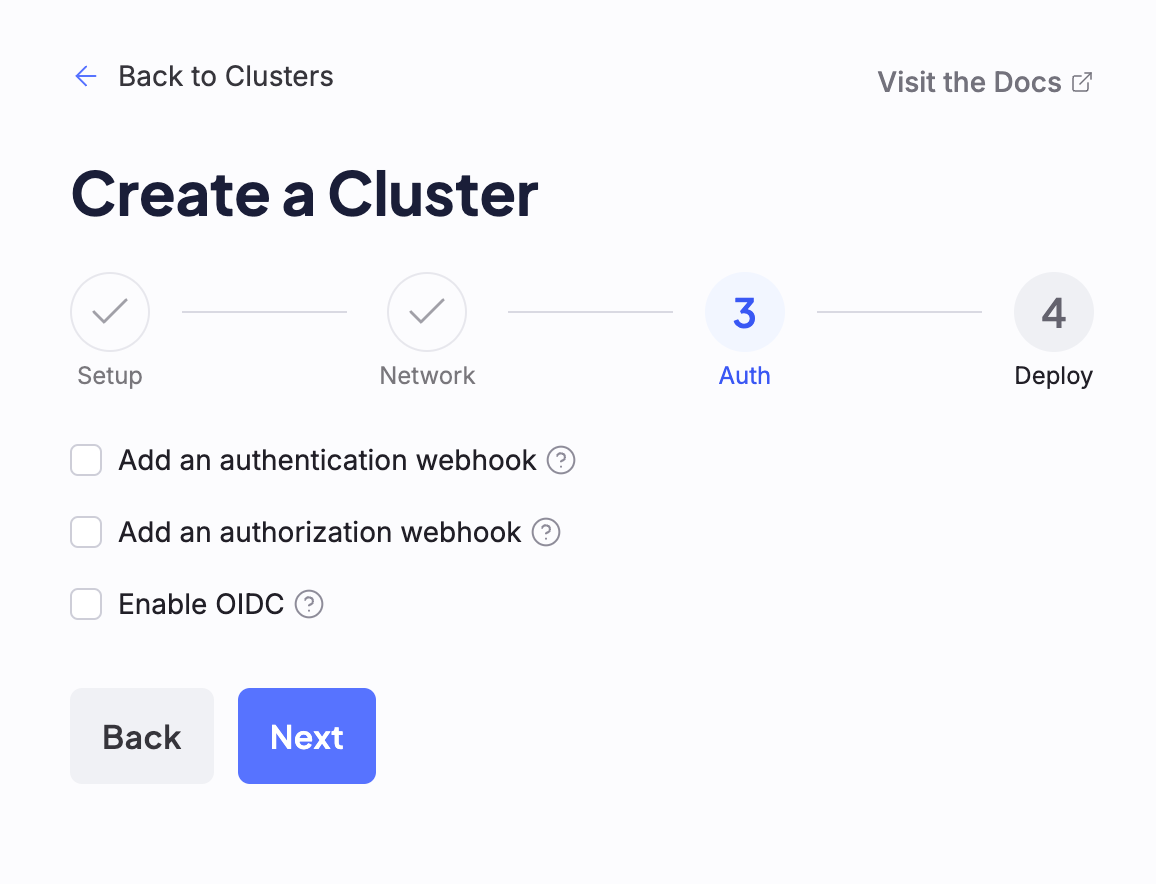
All settings on this screen are optional. If you do not wish to enable any of these features, you may proceed with cluster creation by clicking the Next button, without selecting any options in this step.
Add an authentication webhook
Selecting the Add an authentication webhook checkbox causes the Server and Certificate Authority fields to appear. If this option is selected, you must provide a URL in the Server input field, and may optionally include a Certificate Authority.
To learn more about Webhook authentication in Kubernetes, see the official Kubernetes documentation.
Add an authorization webhook
Selecting the Add an authorization webhook checkbox causes the Server and Certificate Authority fields to appear. If this option is selected, you must provide a URL in the Server input field.
To learn more about Webhook authorization in Kubernetes, see the official Kubernetes documentation.
Enable OIDC
To enable OIDC, the Issuer URL and Client ID fields are required. All other fields are optional.
To learn more about OIDC for Kubernetes, see the official Kubernetes documentation.
Certificate Authority
Each of the authentication and authorization options provides an optional Certificate Authority checkbox. Clicking this box opens a YAML editor, which can be used to input a Certificate Authority X.509 certificate.
4. Deploy
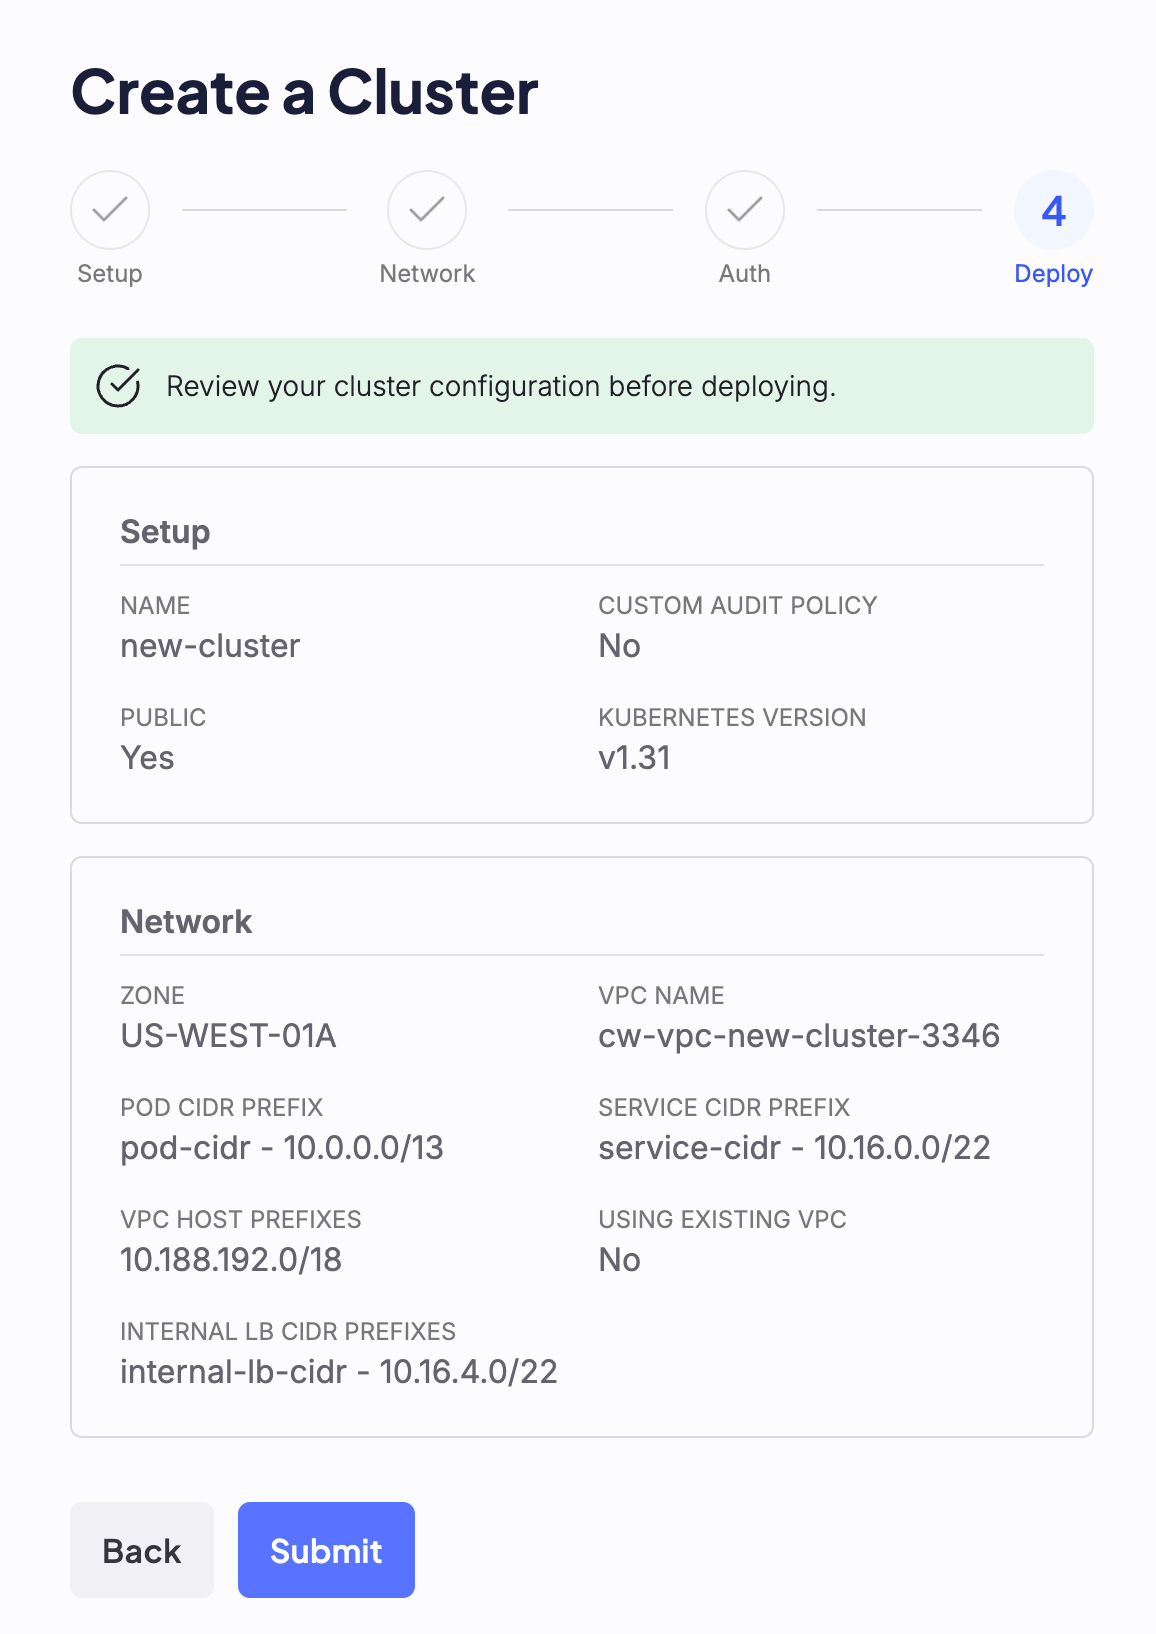
The final step of cluster creation provides an overview of all options selected during the creation process. After reviewing and confirming the cluster's configuration, click the Submit button to deploy the new cluster.
Your cluster will appear on the cluster dashboard with the status Creating. When a cluster is ready, its status changes to Healthy. If there are configuration or deployment issues, the cluster's status changes to Unhealthy.
View details of deployed clusters
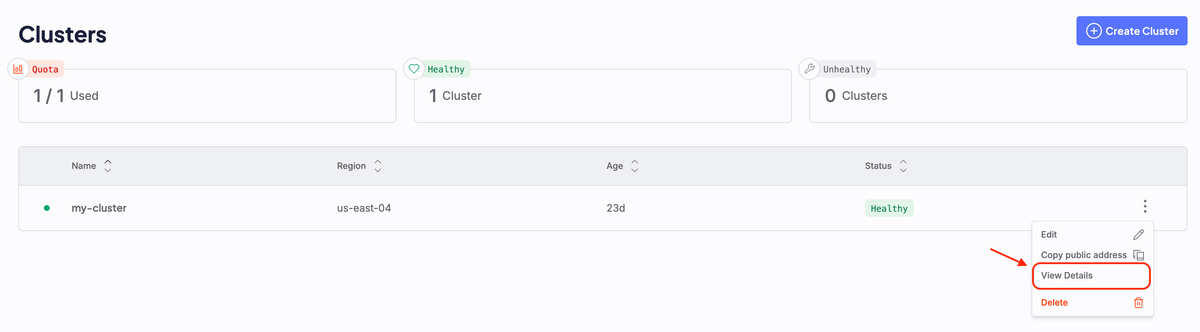
To view more information about a deployed cluster, click the vertical ellipses menu beside the cluster name and select View Details. This opens the cluster's current configuration in JSON, as well as information about the cluster's age, location, name, associated API endpoint, and current state. To return to the dashboard, close this panel.
Cluster statuses
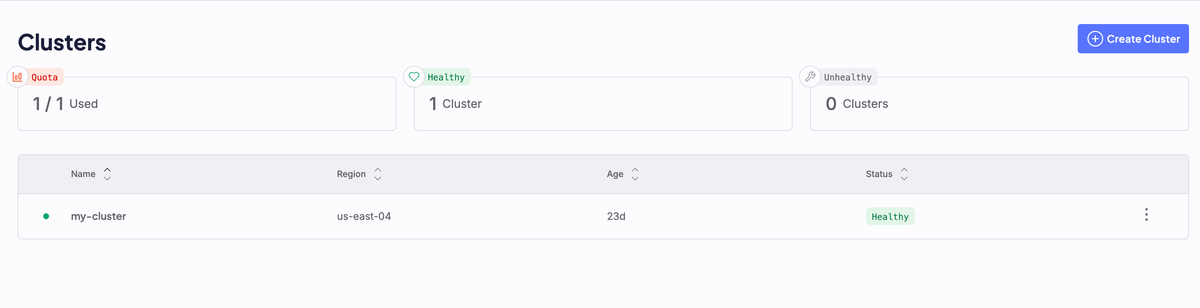
The cards at the top of the cluster dashboard provide information about the status of your current clusters.
The cluster's status refers to the status of the cluster's Control Plane. A CKS cluster with a Healthy status may in fact still be provisioning in-cluster resources, such as required Control Plane Node Pools, or required applications such as CNI and DNS configurations. See Cluster Components for more information.
| Name | Description |
|---|---|
| Quota | Displays the number of CKS clusters your organization has deployed, over the maximum limit of clusters it is allowed to create as defined by the organization's quota. Represented as count/quota. If you have not yet created any clusters, or you have no quota assigned, the status presented is No Quota. |
| Healthy | Displays the number of healthy clusters deployed. In a healthy cluster, all Control Plane elements, servers, and Pods are in a Healthy state. The cluster is stable and responsive, and can manage workloads. |
| Unhealthy | Displays the number of unhealthy clusters. A cluster can become Unhealthy for many reasons, including Control Plane issues, unresponsive Nodes, failing Pods, network failures, or storage problems. |