For instructions about accessing CoreWeave Grafana dashboards, see Access and use CoreWeave Grafana dashboards.
- Monitor the GPU and CPU utilization of a given Slurm job.
- Track the rate of filesystem operations related to the Slurm job.
- View Node conditions and alerts that may impact the performance of the Slurm job.
Filters and parameters
Use these filters at the top of the page to choose the data you want to view:| Field | Value |
|---|---|
| Data Source | The Prometheus data source selector. |
| Logs Source | The Loki logs source selector. |
| Org | The organization that owns the cluster. |
| Cluster | The specific Kubernetes cluster in the organization to view. |
| Namespace | The Kubernetes namespace where the Slurm cluster is located. |
| Slurm Cluster | The Slurm cluster containing the job to view. |
| Job Name | The name of the Slurm job to view. Select “All” to view all the Slurm jobs in the Slurm Cluster. |
| Job ID | The Slurm Job ID to view. Select “All” to view all the Slurm jobs in the Slurm Cluster. |
| Node Conditions | Toggled on by default. Click to disable. |
| Pending Node Alerts | Toggled on by default. Click to disable. |
| Firing Node Alerts | Toggled off by default. Click to enable. |
| InfiniBand Fabric Flaps | Toggled off by default. Click to enable. |
slurmctld logs.
Set the time range and refresh rate parameters at the top-right of the page. The default time range is 5 minutes, and the default refresh rate is 1 minute.
Panel descriptions
The following sections describe each group of panels on the dashboard, starting with Job Info and continuing through GPU Metrics, Filesystem, and Node Resources.Job Info
The Job Info section displays identifying information about the selected Slurm job, including:| Panel | Displays |
|---|---|
| Job Id | The Slurm job ID. |
| Name | The name of the Slurm job. |
| Last State | Displays the most recently reported state of the Slurm job. |
| User | The user who created the Slurm job. |
| Account | The user account running the Slurm job. |
| Nodes | The number of CPUs allocated for the Slurm job. |
| Partition | The partition where the selected job is running. |
| Job State Timeline | A chart that shows the Slurm job’s states over time. |
| Uptime | The Slurm job uptime in seconds. |
| Active GPUs | The number of GPUs allocated to the Slurm job that are currently running. |
| Job Efficiency | Indicates how active the GPUs were while working on the selected job. This value is estimated based on idle time, defined as a node with at least 1 GPU under 50% utilization. The estimate excludes restarts and checkpointing. This is not a Model FLOPS (MFU) metric. |
| Current FP8 Flops | Graphs the Compute rate over the job run. The graph typically displays peaks and valleys in a regular pattern. Points with lower Compute values often correspond with loading data or saving checkpoints. This number assumes FP8 training. |
| Node conditions | Lists nodes that have been assigned a condition, along with timestamps indicating when the condition was noticed and addressed. |
| Alerts | Displays all alerts with a severity level higher than Informational, over a 10-minute interval. Alerts may have a PENDING or FIRING state. |
| Nodes (Range) | Lists all nodes along with their state, uptime, and a link to their associated slurmd logs. |
Estimate model flop utilization (MFU) from tensor core utilization
Use the Tensor Core Utilization Running Jobs panel in the GPU Metrics section to get a rough estimate of MFU.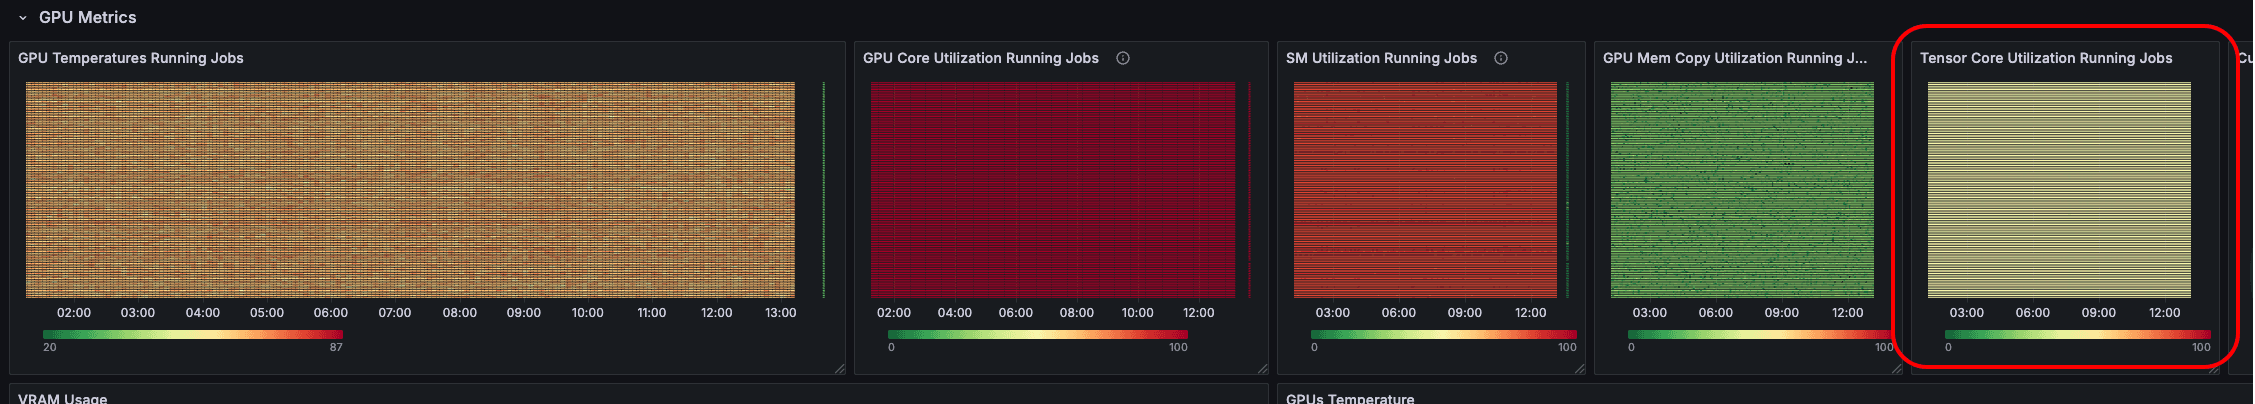
Job Info: Job State Timeline and Last State
The Job Info section contains panels that display information about the state of the selected Slurm job. Last State displays the most recent reported state, while the Job State Timeline displays the job’s status over time.
| State | Meaning |
|---|---|
RUNNING | Actively executing on allocated resources. |
PENDING | Queued to run when resources are available. |
CANCELLED | Canceled by a user. |
COMPLETING | Finished or canceled, and currently performing cleanup tasks, such as an epilog script. |
PREEMPTED | Preempted by another job. |
COMPLETED | Successfully completed execution. |
Job Info: Node alerts
Job alerts in the Slurm Job / Metrics dashboard are generated by CoreWeave’s Mission Control, an automated system that continuously monitors and manages the underlying compute infrastructure to maintain high cluster reliability and availability. These alerts target hardware and system-level issues, such as GPU errors, networking failures, and endpoint timeouts. These conditions aren’t typically observable through application-layer metrics such as training metrics or standard logs.Understanding Node alerts and conditions
The following image shows an interruption caused by a Node alert, namelyGPUContainedECCError.
- Blue lines: Indicate Node conditions.
- Red lines: Indicate Node alerts.
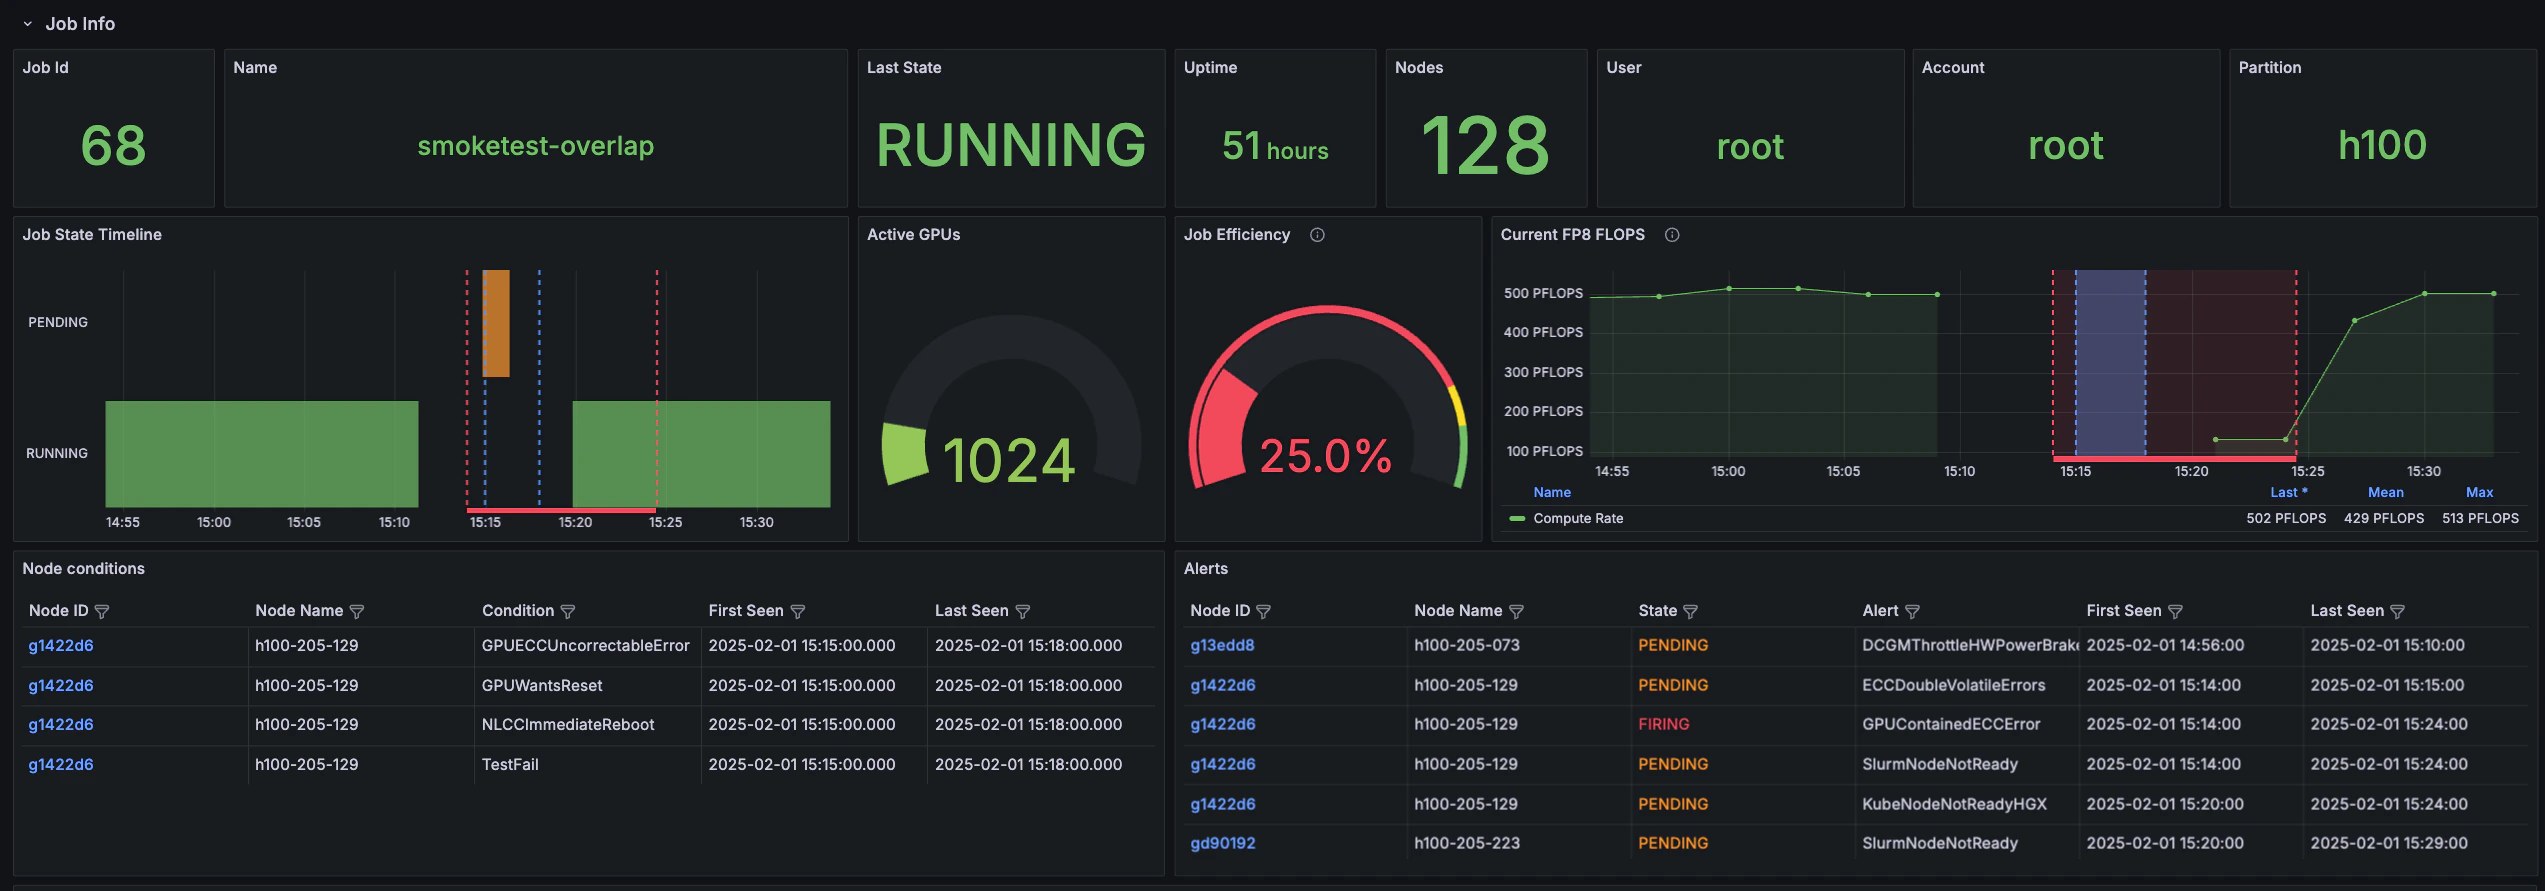
GPUContainedECCError, appears before the drop in compute, while the Node conditions indicated by the blue lines delineate the window the drop in compute occurred within.
The image shows that the H100 cluster experienced a hard fault around 15:15. Throughput dropped from 500 PFLOPS to 0 because the Slurm scheduler pulled a Node out of the pool due to a GPUContainedECCError. Understanding how Node alerts and conditions are overlaid on Node metrics can help you diagnose and troubleshoot problems with a running job.
GPU Metrics
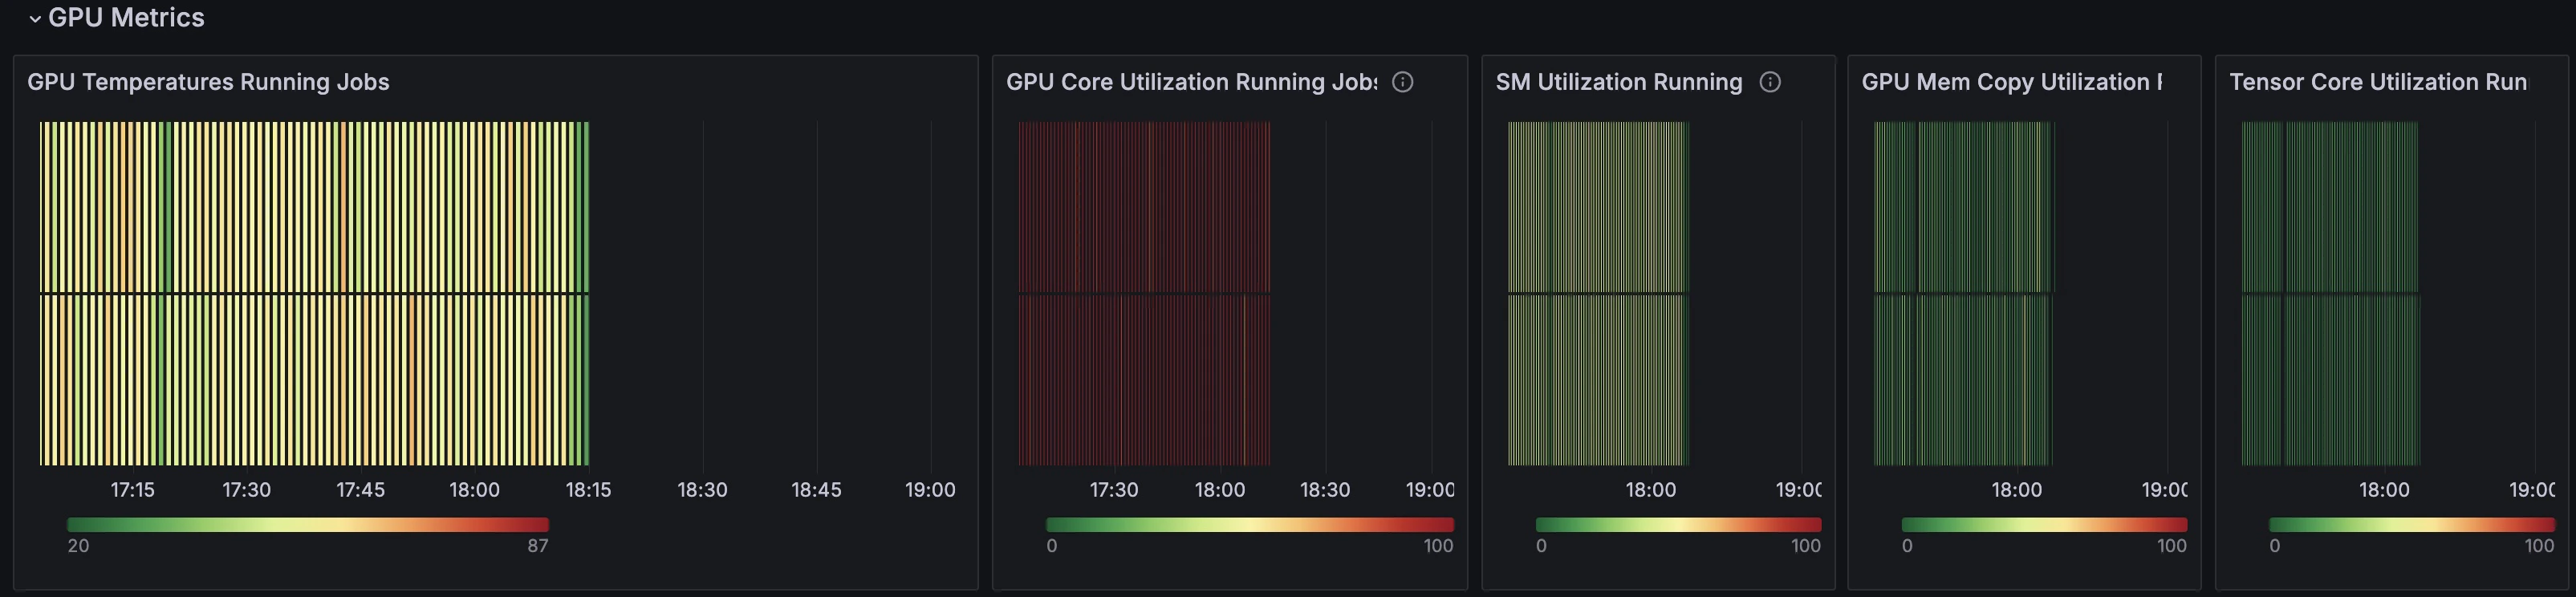
The GPU Metrics section displays detailed information related to hardware utilization. In this section, red lines correspond with higher temperature or utilization of the measured value, while green lines indicate a lower value or idle state. Whether these values suggest “good” or “bad” performance depends on the expected behavior and resource utilization of the job.| Panel | Description |
|---|---|
| GPU Temperatures Running Jobs | Displays the temperature of the GPUs over time. Generally, an increase in temperature corresponds with a job run, indicating that the GPUs are busy. |
| GPU Core Utilization Running Jobs | Displays the utilization of GPU cores over time. Red indicates high utilization. |
| SM Utilization Running Jobs | The fraction of time at least one warp was active on a multiprocessor, averaged over all multiprocessors. “Active” does not necessarily mean that a warp is actively computing. For example, warps waiting on memory requests are considered active. The value represents an average over a time interval and is not an instantaneous value. A value of 0.8 or greater is necessary, but not sufficient, for effective use of the GPU. A value less than 0.5 likely indicates ineffective GPU usage. |
| GPU Mem Copy Utilization Running Jobs | Displays the utilization of GPU memory. |
| Tensor Core Utilization Running Jobs | Displays the utilization of Tensor cores over time. |
| VRAM Usage | Plots the amount of VRAM used by the GPU over time. |
| GPUs Temperature | Displays the temperatures of the GPUs over time. |
| GPUs Power Usage | Plots the power usage of the GPUs, in watts. |
GPU Metrics: Color coding
| Color | Meaning |
|---|---|
| Red | High utilization. |
| Orange-Yellow | Medium-low utilization. |
| Green | Low utilization or idle. |
| Black | No job running at this time. |
write operations.
Filesystem
The Filesystem section includes information aboutread and write operations on the Network File System (NFS) and local files.
| Panel | Description |
|---|---|
| Local Max Disk IO Utilization (Min 1m) | The green line indicates write operations and the yellow line indicates read operations. |
| Local Avg Bytes Read / Written Per Node (2m) | The red line indicates write operations and the blue line indicates read operations. |
| Local Total bytes Read / Written (2m) | The red line indicates write operations and the blue line indicates read operations. |
| Local Total Read / Write Rate (2m) | The red line indicates write operations and the blue line indicates read operations. |
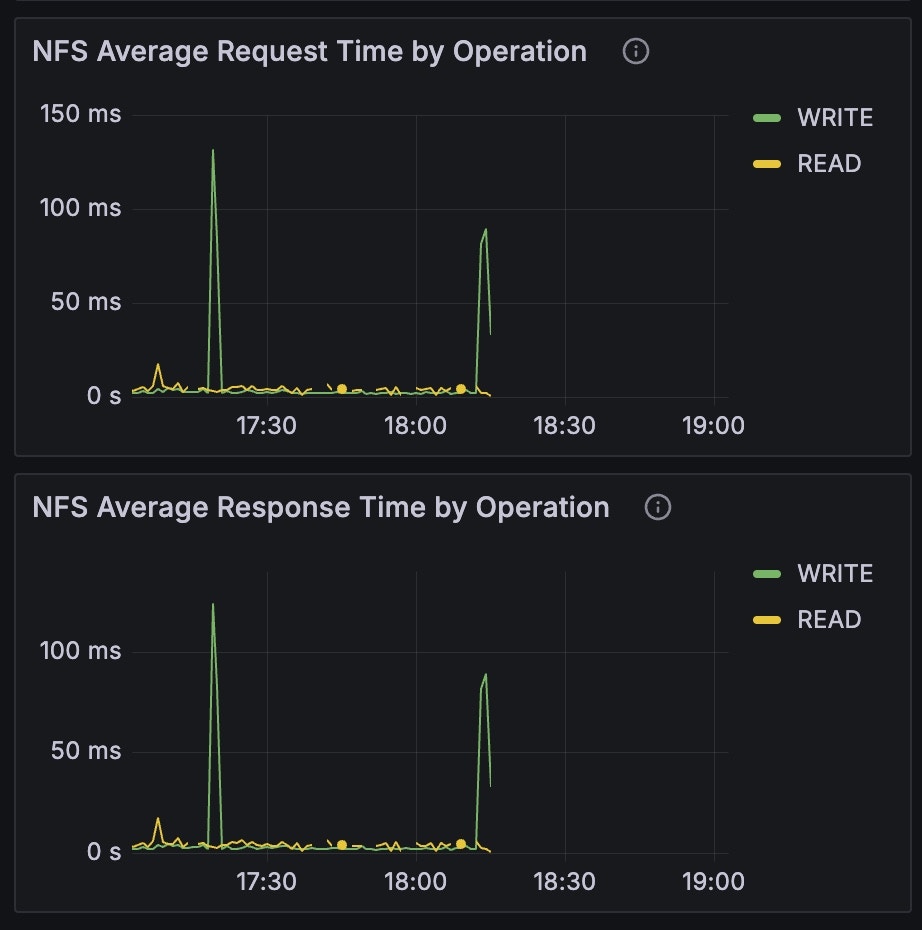
| NFS Average Request Time by Operation | Duration requests took from when a request was enqueued to when it was completely handled for a given operation, in seconds. The green line indicates write operations and the yellow line indicates read operations. |
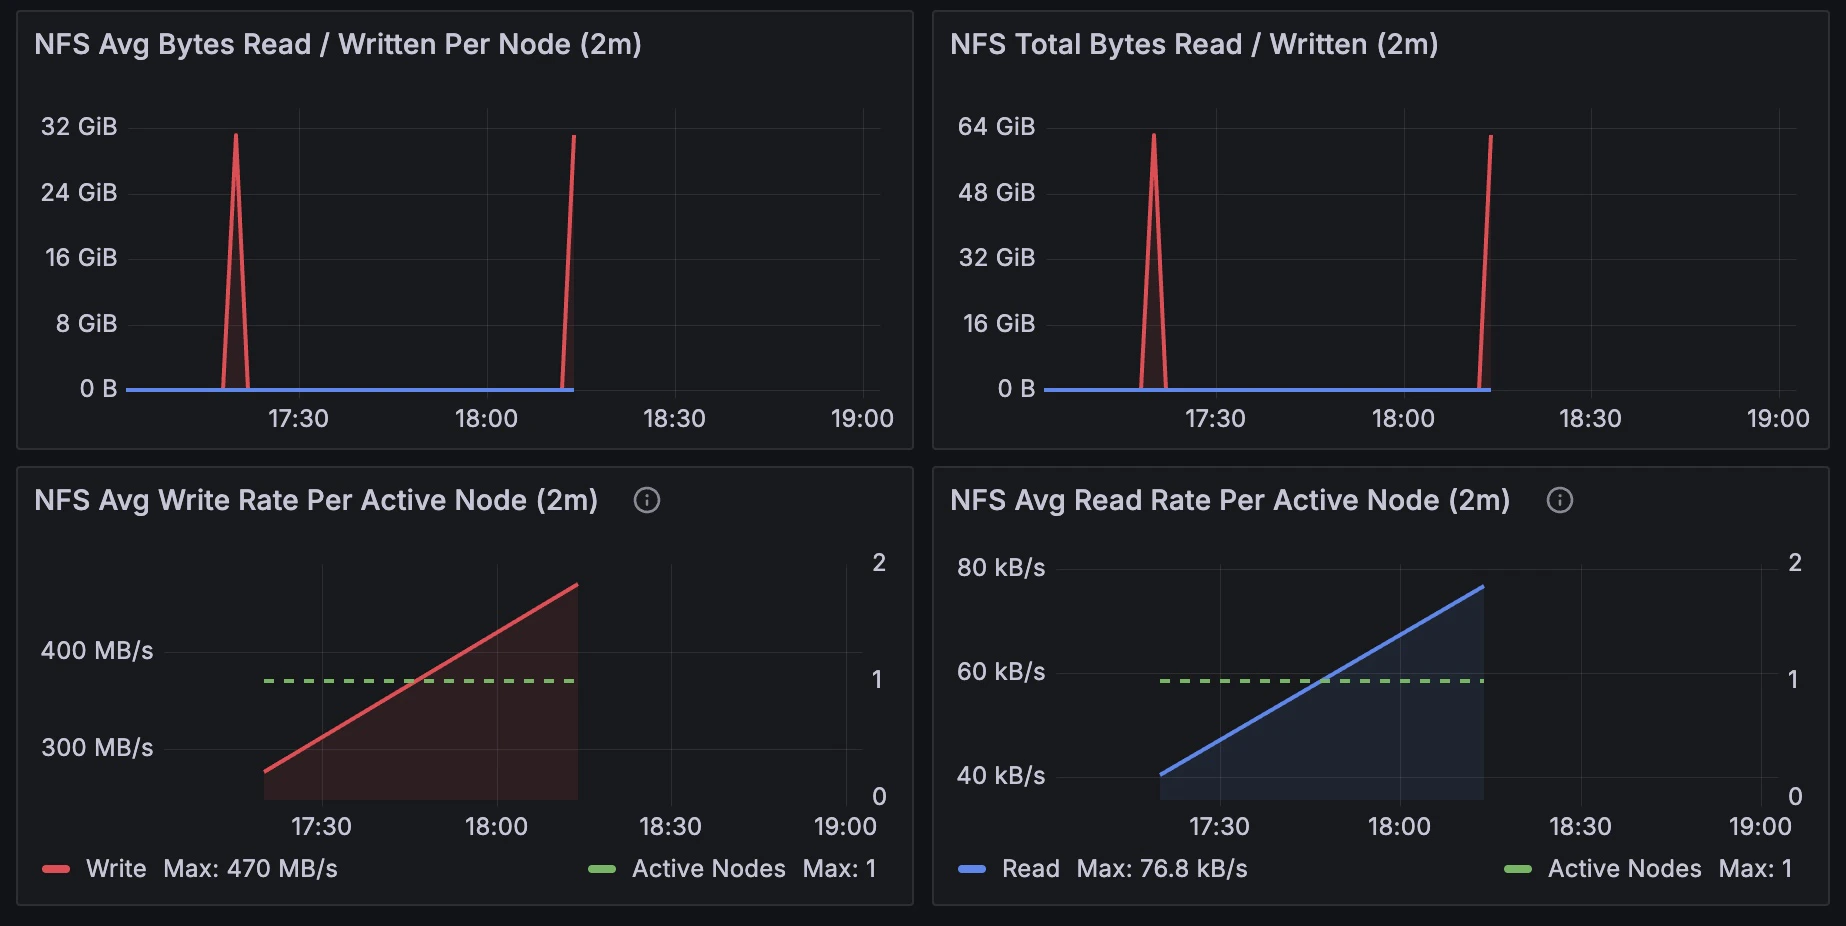
| NFS Avg Bytes Read / Written Per Node (2m) | The red line indicates write operations and the blue line indicates read operations. |
| NFS Total Bytes Read / Written (2m) | The red line indicates write operations and the blue line indicates read operations. |
| NFS Total Read / Write Rate | The red line indicates write operations and the blue line indicates read operations. |
| NFS Average Response Time by Operation | Duration requests took to get a reply back after a request for a given operation was transmitted, in seconds. The green line indicates write operations and the yellow line indicates read operations. |
| NFS Avg Write Rate Per Active Node (2m) | The red line indicates write operations and the dashed green line displays active nodes. Only includes nodes writing over 10 KB/s. |
| NFS Avg Read Rate Per Active Node (2m) | The blue line indicates read operations and the dashed green line displays active nodes. Only includes nodes reading over 10 KB/s. |
| NFS Nodes with Retransmissions | Retransmissions indicate packet loss on the network, either due to congestion or faulty equipment or cabling. |