Distributed File Storage
Monitor Distributed File Storage instances
To view the dashboard, go to the Distributed File Storage dashboard.
Info
For accessing CoreWeave Grafana Dashboards instructions, see Access CoreWeave Grafana Dashboards.
The Distributed File Storage dashboard provides metrics regarding distributed file storage instances.
The dashboard contains the following panels:
| Panel | Description |
|---|---|
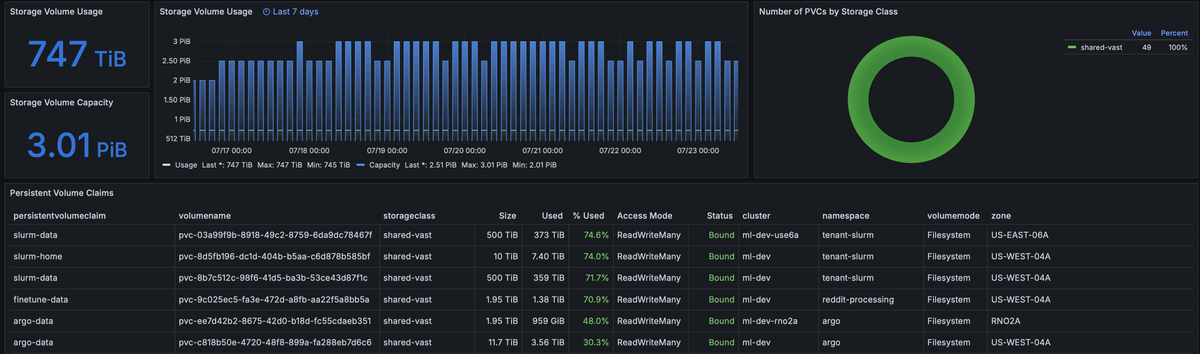
| Storage Volume Usage | Displays the current total storage volume being used. |
| Storage Volume Capacity | Displays the total available storage volume capacity. |
| Storage Volume Usage (Last 7 days) | Shows the storage volume usage over the last 7 days. |
| Number of PVCs by Storage Class | Shows a breakdown of Persistent Volume Claims (PVCs) by their assigned Storage Class. |
| Persistent Volume Claims | Shows Persistent Volume Claims with their size, used space, percentage used, and current status. |