SLURM / Namespace
Monitor all SUNK jobs within your clusters
The SLURM / Namespace dashboard provides an overview of all the SUNK jobs within a specific Namespace. It aggregates metrics by relevant properties, such as job state, resource type, and user, to illustrate trends in jobs.
Customers can use this dashboard to:
- Monitor the resource usage of SUNK jobs across all clusters
- Track the rate of filesystem operations of SUNK jobs across all clusters
- View information about SUNK jobs on a per-user or per-partition basis
Prerequisites
You must be a member of the admin, metrics, or write groups to access Grafana dashboards.
Open the dashboard
- Log in to the CoreWeave Cloud Console.
- In the left navigation, select Grafana to launch your Managed Grafana instance.
- Click Dashboards.
- Expand SUNK, then choose SLURM / Namespace.
- Select from the appropriate filters and parameters at the top of the page.
If you are already logged in to CoreWeave Cloud Console, you can open the Slurm / Namespace dashboard directly from this link.
Filters and parameters
Use these filters at the top of the page to choose the data you want to view:
| Field | Value |
|---|---|
| Data Source | The Prometheus data source selector. |
| Logs Source | The Loki logs source selector. |
| Org | The organization that owns the cluster. |
| Cluster | The specific Kubernetes cluster in the organization to view. |
| Namespace | The Kubernetes namespace where the Slurm cluster is located. |
| slurm_cluster | The Slurm cluster containing the job to view. |
| nodeset | |
| Node Conditions | Toggled on by default. Click to disable. |
| Pending Node Alerts | Toggled off by default. Click to enable. |
| Firing Node Alerts | Toggled off by default. Click to enable. |
| InfiniBand Fabric Flaps | Toggled off by default. Click to enable. |
| MaxJobCount Limit Reached | Toggled on by default. Click to disable. |
The dashboard also includes a button with a link to the SLURM / Job Metrics dashboard.
Set the time range and refresh rate parameters at the top-right of the page. The default time range is 5 minutes, and the default refresh rate is 1 minute.
Panel descriptions
Slurm Jobs
The Slurm Jobs section lists information about the Slurm jobs running in the selected Namespace. It includes panels that display the jobs according to status.
| Panel | Description |
|---|---|
| Running jobs | A sortable table listing all the currrently running Slurm jobs along with quick-reference utilization statistics. |
| Largest Job by Nodes | A pie chart that shows how many nodes each job is using. Clicking on a section of the pie chart will take you to the Slurm / Job Metrics dashboard for that job. |
| Pending jobs | A table that lists jobs currently in the Pending state. |
| Completing/Completed jobs | A table that lists jobs currently in the Completing or Completed state. |
| Failed/Suspended/Cancelled/Pre-empted/Timeout/Node-Fail jobs | A table that lists jobs currently in the following states: Failed, Suspended, Cancelled, Preempted, Timeout, Node-Fail |
| RUNNING/COMPL/PEND Jobs | A graph that plots all jobs in the following states: Completing (green line), Running (yellow line), Pending (blue line), Completed (orange line). |
| FAIL/SUSP/CANC/PREEMPT/TIMEDOUT Jobs | A graph that plots all jobs in the following states: Timed out (dark red), Failed (yellow), Failed due to NodeFail (light blue), Suspended (orange), Preempted (red) |
Slurm Jobs: Running jobs
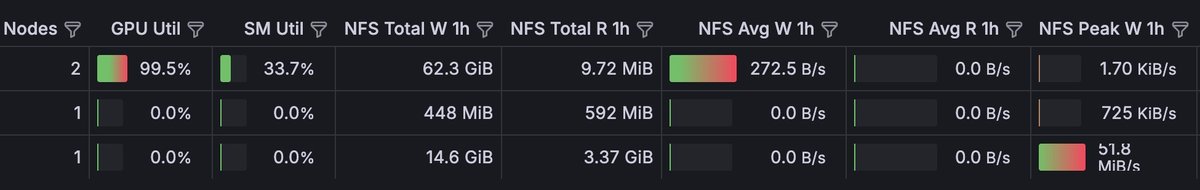
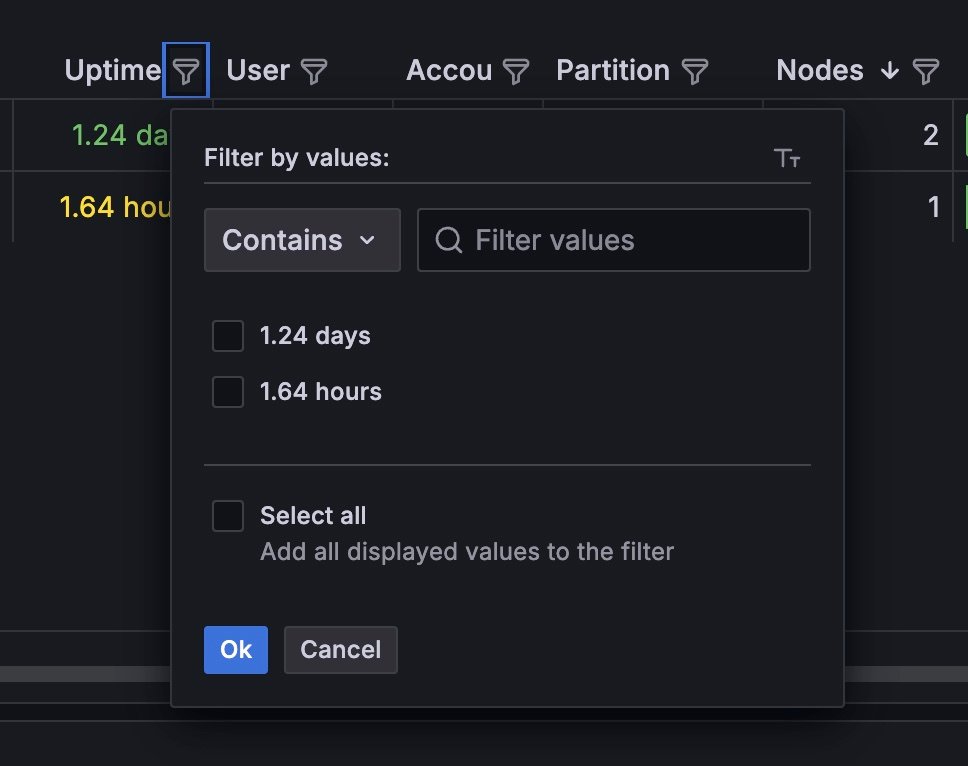
The Running jobs table in the Slurm Jobs section displays all the currently running jobs, along with relevant hardware utilization metrics in a quick-reference format. Click the icon next to the column title to open the Filter by values menu. The data in each column is filterable by the relevant values held within.
You may need to use the horizonal scroll bar to view all the available fields.
| Field | Description |
|---|---|
| Job Id | The Slurm job ID. |
| Job | The name of the Slurm job. |
| Uptime | The Slurm job uptime in seconds. |
| User | The user who created the Slurm job. |
| Account | The user account running the Slurm job. |
| Partition | The partition where the Slurm job is running. |
| Nodes | The amount of nodes allocated to the Slurm job. |
| GPU Util | Measures GPU utilization over a 1 hour period. |
| SM Util | The fraction of time at least one warp was active on a multiprocessor, averaged over all multiprocessors. Note that "active" does not necessarily mean warp is actively computing. For instance, warps waiting on memory requests are considered active. The value represents an average over a time interval and is not an instantaneous value. A value of 0.8 or greater is necessary, but not sufficient, for effective use of the GPU. A value less than 0.5 likely indicates ineffective GPU usage. |
| NFS Total W 1h | The total amount of NFS write operations over a 1 hour period, in bytes. |
| NFS Total R 1h | The total amount of NFS read operations over a 1 hour period, in bytes. |
| NFS Avg W 1h | The average NFS write operations over a 1 hour period, in bytes. |
| NFS Avg R 1h | The average NFS read operations over a 1 hour period, in bytes. |
| NFS Peak W 1h | Maximum NFS write operations during a 1 hour period. |
| NFS Peak R 1h | Maximum NFS read operations during a 1 hour period. |
| NFS Retrans 1h | The number of NFS Retransmissions over a 1 hour period. Retransmissions indicate packet loss on the network, either due to congestion or faulty equipment or cabling. |
At the bottom of the table is the Count field, which displays the total number of running jobs.
Control Plane Health
The Control Plane Health section displays status information about the Control Plane components.
| Panel | Description |
|---|---|
| Control Plane Restart Counters | Counts the number of times the Control Plane has restarted. |
| Control Plane Readiness Timeline | Displays the status of Control Plane components over time. Green indicates that the component is ready. Red indicates that the component is not ready. |
| Control Plane Readiness Timeline (Instant) | Displays the current status of Control Plane components, sorted by Container and Pod. Includes links to the logs for each entry. |
Slurm-Login Info
The Slurm-Login Info section includes 3 panels
| Panel | Description |
|---|---|
| Slurm-Login Pod Status | A table that lists the status of the Slurm-Login pods and a link to the corresponding Loki logs. |
| Slurm-Login SSHD Memory Percentage Usage | A graph that displays memory usage over time relative to pod memory limit, or node memory limit as fallback. |
| Slurm-Login SSHD CPU Percentage Usage | A graph that displays CPU usage over time relative to pod CPU limit, or node CPU limit as fallback. |
Nodeset Status
The Nodeset Status panel displays pods by availability. The graph is color coded with the following scheme:
| Color | Meaning |
|---|---|
| Green | Current. |
| Yellow | Desired. |
| Blue | Feasible. |
| Red | Ready. |
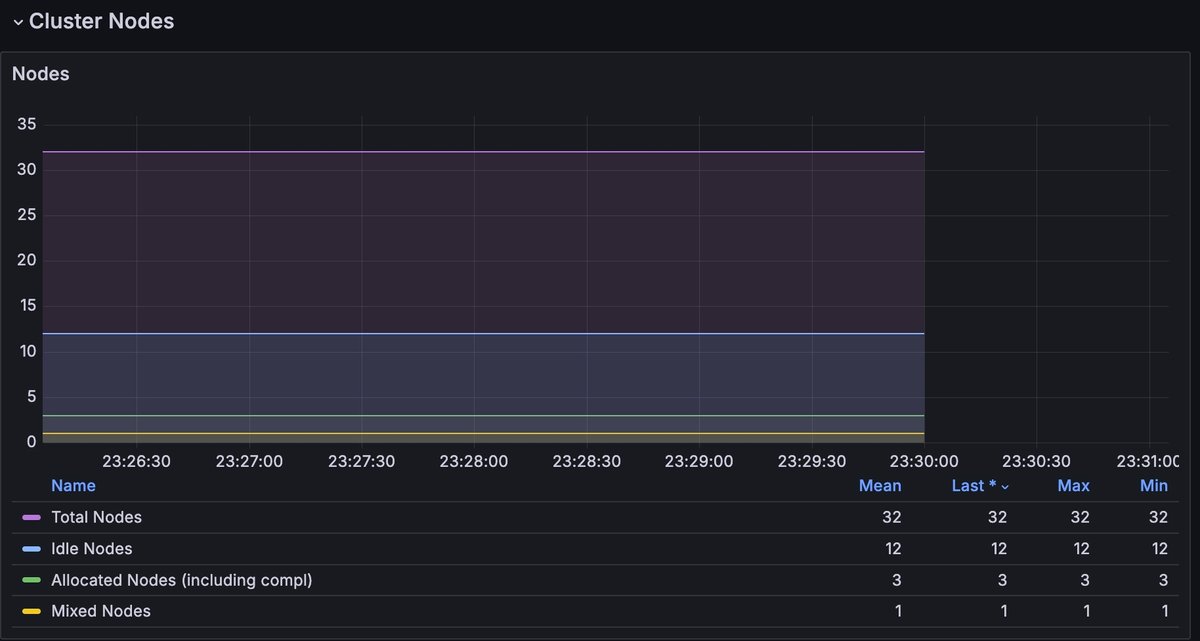
Cluster Nodes
| Panel | Description |
|---|---|
| Nodes | A time-series graph that displays the Total number of nodes in the cluster (purple), along with nodes in the following states: Idle (light blue), Allocated or complete (green), and Mixed (yellow). |
| Fail/Down/Drain/Err Nodes | A time-series graph that displays all nodes in the cluster with the following states: Down (red), Draining (yellow), Error (light blue), and Fail (purple). |
| Drain Reasons (TS) | A time-series graph that displays all node drain events. |
| Drain Reasons | A table showing all the nodes that are in a drain state and the reason for the drain. Alerting reasons are highlighted in red. Timestamp available only on clusters running SUNK v6.2.0 or later. |
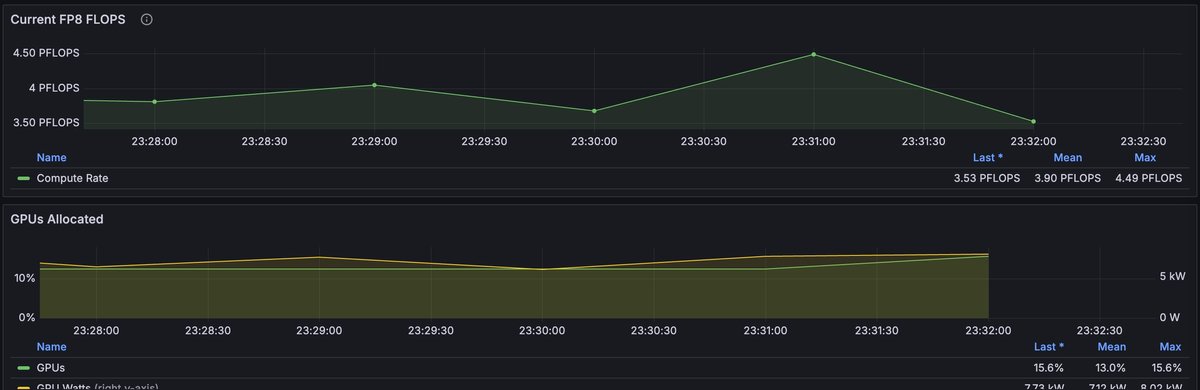
GPU Metrics
The GPU Metrics section has four panels
| Panel | Description |
|---|---|
| Current FP8 FLOPS (Gauge) | This number assumes FP8 training. |
| Current FP8 FLOPS (Graph) | A graph that displays the FP8 FLOPS over time. This number assumes FP8 training. |
| Active GPUs (Gauge) | A gauge that displays the number of active GPUs. |
| GPUs Allocated | A graph that displays GPUs allocated (green line, left y-axis) and GPU Watts (yellow line, right y-axis). |
Filesystem
The Filesystem section includes information about read and write operations on the Network File System (NFS) and local files.
| Panel | Description |
|---|---|
| Local Max Disk IO Utilization (Min 1m) | The green line indicates write operations and the yellow line indicates read operations. |
| Local Avg Bytes Read / Written Per Node (2m) | The red line indicates write operations and the blue line indicates read operations. |
| Local Total bytes Read / Written (2m) | The red line indicates write operations and the blue line indicates read operations. |
| Local Total Read / Write Rate (2m) | The red line indicates write operations and the blue line indicates read operations. |
| NFS Average Request Time by Operation | Duration requests took from when a request was enqueued to when it was completely handled for a given operation, in seconds. The green line indicates write operations and the yellow line indicates read operations. |
| NFS Avg Bytes Read / Written Per Node (2m) | The red line indicates write operations and the blue line indicates read operations. |
| NFS Total Bytes Read / Written (2m) | The red line indicates write operations and the blue line indicates read operations. |
| NFS Total Read / Write Rate | The red line indicates write operations and the blue line indicates read operations. |
| NFS Average Response Time by Operation | Duration requests took to get a reply back after a request for a given operation was transmitted, in seconds. The green line indicates write operations and the yellow line indicates read operations. |
| NFS Avg Write Rate Per Active Node (2m) | The red line indicates write operations and the dashed green line displays active nodes. Only includes nodes writing over 10 KB/s. |
| NFS Avg Read Rate Per Active Node (2m) | The blue line indicates read operations and the dashed green line displays active nodes. Only includes nodes reading over 10 KB/s. |
| NFS Nodes with Retransmissions | Retransmissions indicate packet loss on the network, either due to congestion or faulty equipment or cabling. |
Filesystem: NFS Average Response and Request
The NFS Average Response and Request graphs describe the performance of the filesystem. A slowdown or spike could indicate that the storage is too slow, and that the job might perform better with faster or a different type of storage, such as object storage.
Filesystem: NFS Total Read / Write
The NFS Total Read / Write graphs typically display a large red spike when a job starts, as the model and data are read in. While the job runs, the graph shows smaller write spikes at regular intervals, which occur as the checkpoints are written out. Comparing these graphs with the panels in the GPU Metrics section may help to confirm that running jobs are behaving as expected.
Users and Accounts
The Users and Accounts section contains graphs that display information about Slurm jobs relative to the users, accounts, and partitions they are associated with.
| Panel | Description |
|---|---|
| Pending Jobs per Partition | Displays the number of jobs in the Pending state in a given partition. |
| Running Jobs per Account | Displays the number of jobs in the Running state per Account. |
| Pending Jobs per Account | Displays the number of jobs in the Pending state per Account. |
| Running Jobs per Users | Displays the number of jobs in the Running state per individual user. |
| Pending Jobs per Users | Displays the number of jobs in the Pending state per individual user. |
| Utilized CPUs per Account | Displays the number of CPUs utilized per Account. |
| Utilized CPUs per user | Displays the number of CPUs utilized per individual user. |
CPU cores allocation
The CPU cores allocation section contains graphs that display information about CPU and GPU core allocation, according to status.
| Panel | Description |
|---|---|
| CPU Allocation | Displays the following: Total number of CPU cores (green), Allocated CPU cores (yellow), and Idle CPU cores (light blue). |
| CPUs Allocated per Partition | Displays all CPUs allocated, by partition. |
| CPUs Idle per Partition | Displays all CPU cores in an Idle state, by partition. |
| GPUs Allocated per Partition | Displays all GPUs allocated, by partition. |
| GPUs Idle per Partition | Displays all GPU cores in an Idle state, by partition. |
RPC Traffic
The RPC Traffic section contains graphs that display Remote Procedure Calls (RPC) traffic.
| Panel | Description |
|---|---|
| Request Rate | Displays the rate of RPC requests sent, in requests per sercond. |
| Mean Request Duration | Displays the mean duration of all RPC requests, in milliseconds. |
Total Backfilled Jobs
The Total Backfilled Jobs section has 3 panels
| Panel | Description |
|---|---|
| Total Backfilled Jobs (since last slurm start) | Number of jobs started due to backfilling since last Slurm start. |
| Total Backfilled Jobs (since last stats cycle start) | Number of jobs started due to backfilling since last time stats were reset. |
| Fair Share per Account | NOTE: REST API currently does not expose this information. |
PVC Info
The PVC Info section contains the MySQL PVC Usage graph, which displays the percent of total capacity used over time.
SUNK Info
The SUNK Info section contains details about the versions of SUNK, Ubuntu, and CUDA currently in use.
SUNK Image Info
The SUNK Image Info section contains the SUNK Control Plane, Compute and Login Pod Images panel. This panel lists the images used for the SUNK control plane, Compute, and Login pods, sorted by container.