Slurm Job Metrics
View detailed metrics about a Slurm job with Grafana
To view the dashboard, go to the Slurm Job Metrics dashboard.
For accessing CoreWeave Grafana Dashboards instructions, see Access CoreWeave Grafana Dashboards.
The Slurm Job Metrics dashboard displays detailed information about the performance and hardware utilization of a selected Slurm job.
Customers can use this dashboard to:
- Monitor the GPU and CPU utilization of a given Slurm job
- Track the rate of filesystem operations related to the Slurm job
- View Node conditions and alerts that may impact the performance of the Slurm job
Filters and parameters
Use these filters at the top of the page to choose the data you want to view:
| Field | Value |
|---|---|
| Data Source | The Prometheus data source selector. |
| Logs Source | The Loki logs source selector. |
| Org | The organization that owns the cluster. |
| Cluster | The specific Kubernetes cluster in the organization to view. |
| Namespace | The Kubernetes namespace where the Slurm cluster is located. |
| Slurm Cluster | The Slurm cluster containing the job to view. |
| Job Name | The name of the Slurm job to view. Select "All" to view all the Slurm jobs in the Slurm Cluster. |
| Job ID | The Slurm Job ID to view. Select "All" to view all the Slurm jobs in the Slurm Cluster. |
| Node Conditions | Toggled on by default. Click to disable. |
| Pending Node Alerts | Toggled on by default. Click to disable. |
| Firing Node Alerts | Toggled off by default. Click to enable. |
| InfiniBand Fabric Flaps | Toggled off by default. Click to enable. |
The dashboard also includes buttons with links to the SLURM / Namespace dashboard and slurmctld logs.
Set the time range and refresh rate parameters at the top-right of the page. The default time range is 5 minutes, and the default refresh rate is 1 minute.
Panel descriptions
Job Info
The Job Info section displays identifying information about the selected Slurm job, including:
| Panel | Displays |
|---|---|
| Job Id | The Slurm job ID. |
| Name | The name of the Slurm job. |
| Last State | Displays the most recently reported state of the Slurm job. |
| User | The user who created the Slurm job. |
| Account | The user account running the Slurm job. |
| Nodes | The number of CPUs allocated for the Slurm job. |
| Partition | The partition where the selected job is running. |
| Job State Timeline | A chart that shows the Slurm job's states over time. |
| Uptime | The Slurm job uptime in seconds. |
| Active GPUs | The number of GPUs allocated to the Slurm job that are currently running. |
| Job Efficiency | Indicates how active the GPUs were while working on the selected job. This value is estimated based on idle time, defined as a node with at least 1 GPU under 50% utilization. The estimate excludes restarts and checkpointing. This is not a Model FLOPS (MFU) metric. |
| Current FP8 Flops | Graphs the Compute rate over the job run. The graph typically displays peaks and valleys in a regular pattern. Points with lower Compute values often correspond with loading data or saving checkpoints. This number assumes FP8 training. |
| Node conditions | Lists nodes that have been assigned a condition, along with timestamps indicating when the condition was noticed and addressed. |
| Alerts | Displays all alerts with a severity level higher than Informational, over a 10 minute interval. Alerts may have a PENDING or FIRING state. |
| Nodes (Range) | Lists all nodes along with their state, uptime, and a link to their associated slurmd logs. |
Job Info: Job State Timeline and Last State
The Job Info section contains panels that display information about the state of the selected Slurm job. Last State displays the most recent reported state, while the Job State Timeline displays the job's status over time.
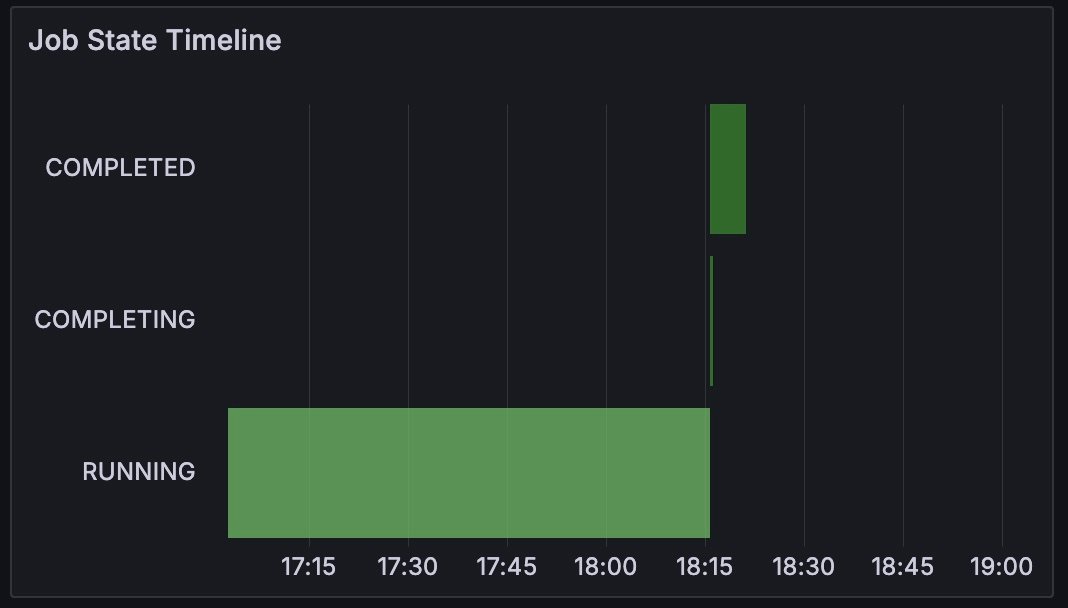
A Slurm job can be in the following states:
| State | Meaning |
|---|---|
RUNNING | Actively executing on allocated resources. |
PENDING | Queued to run when resources are available. |
CANCELLED | Cancelled by a user. |
COMPLETING | Finished or cancelled, and currently performing cleanup tasks, such as an epilog script. |
PREEMPTED | Preempted by another job. |
COMPLETED | Successfully completed execution. |
Job Info: Node alerts
Job alerts in the Slurm Job / Metrics dashboard are generated by CoreWeave's Mission Control, an automated system that continuously monitors and manages the underlying compute infrastructure to maintain high cluster reliability and availability. These alerts target hardware and system-level issues, such as GPU errors, networking failures, and endpoint timeouts - conditions that are not typically observable through application-layer metrics such as training metrics or standard logs.
| Alert Name | Description |
|---|---|
BackendNodeFrameErrorOnLeaf | An error rate between the node and the leaf switch on the backend network can lead to degraded performance. The node will be automatically taken out of service and replaced when free of workloads. |
BackendSlidingWindowBERLeaf | An error rate between the node and the leaf switch on the backend network can lead to degraded performance. The node will be automatically taken out of service and replaced when free of workloads. |
DCGMSRAMThresholdExceeded | This alert indicates that the SRAM threshold has been exceeded on a GPU. This indicates a memory issue and requires investigation by reliability teams. |
DCGMThrottleHWPowerBrake | The GPU is receiving a power throttling signal from the motherboard. Likely a power delivery issue. The node will be taken out of service for investigation after current workloads finish. |
DPUContainerdThreadExhaustion | The DPUContainerdThreadExhaustion alert indicates that the containerd process has run out of threads on the DPU. This requires an update to the dpu-health container to patch. |
DPUContainerdThreadExhaustionCPX | The DPUContainerdThreadExhaustion alert indicates that the containerd process has run out of threads on the DPU. This requires an update to the dpu-health container to patch. |
DPULinkFlappingCPX | The DPULinkFlapping alert indicates that a DPU (Data Processing Unit) link has become unstable. It specifically triggers when a link on a DPU flaps (goes up and down) multiple times within a monitoring period. |
DPUNetworkFrameErrs | The DPUNetworkFrameErrs alert indicates frame errors occurring on DPU (Data Processing Unit) network interfaces. These errors typically indicate a problem with the physical network link. |
DPURouteCountMismatch | The DPURouteCountMismatch alert indicates an inconsistency in routes between what the DPU learns and has installed. A software component on the DPU will need to be restarted. |
DPURouteLoop | The DPURouteLoop alert indicates that a route loop has been detected on the DPU. This can be caused by a miscabling issue in the data center. |
DPURouteLoopCPX | The DPURouteLoop alert indicates that a route loop has been detected on the DPU. This can be caused by a miscabling issue in the data center. |
DPUUnexpectedPuntedRoutes | The DPUUnexpectedPuntedRoutes alert indicates a failure in offloading which can cause connectivity issues for the host. Node will be automatically reset to restore proper connectivity. |
DPUUnexpectedPuntedRoutesCPX | The DPUUnexpectedPuntedRoutes alert indicates a failure in offloading which can cause connectivity issues for the host. The issue typically occurs after a power reset (when the host reboots without the DPU rebooting). |
DPUUnexpectedPuntedRoutesNoReboot | The DPUUnexpectedPuntedRoutesNoReboot alert indicates a failure in offloading which can cause connectivity issues for the host. The node will not be auto-rebooted and will need to be manually investigated. |
ECCDoubleVolatileErrors | ECCDoubleVolatileErrors is an alert that indicates when DCGM double-bit volatile ECC (Error Correction Code) errors are increasing over a 5-minute period on a GPU. |
GPUContainedECCError | GPU Contained ECC Error (Xid 94) indicates a uncorrectable memory error was encountered and contained. Workload has been impacted but the node is generally healthy. No action needed. |
GPUECCUncorrectableErrorUncontained | GPU Uncorrectable Error Uncontained (Xid 95) indicates a uncorrectable memory error was encountered but not successfully contained. Workload has been impacted and the node will be restarted. |
GPUFallenOffBus | GPU Fallen Off The Bus (Xid 79) indicates a fatal hardware error where the GPU shuts down and is completely inaccessible from the system. The node will immediately and automatically be taken out of service. |
GPUFallenOffBusHGX | GPU Fallen Off The Bus (Xid 79) indicates a fatal hardware error where the GPU shuts down and is completely inaccessible from the system. The node will immediately and automatically be taken out of service. |
GPUNVLinkSWDefinedError | NVLink SW Defined Error (Xid 155) indicates link down events which are flagged as intentional will trigger this Xid. Node will be reset. |
GPUPGraphicsEngineError | GPU Graphics Enginer Error (Xid 69) has impacted the workload but the node is generally healthy. No action needed. |
GPURowRemapFailure | GPU Row Remap Failure (Xid 64) is caused by a uncorrectable error resulting in a GPU memory remapping event that failed. The node will immediately and automatically be taken out of service. |
GPUTimeoutError | GPU Timeout Error (Xid 46) indicates GPU stopped processing and the node will be restarted. |
GPUUncorrectableDRAMError | GPU Uncorrectable DRAM Error (Xid 171) provides complementary information to Xid 48. No action is needed. |
GPUUncorrectableSRAMError | GPU Uncorrectable SRAM Error (Xid 172) provides complementary information to Xid 48. No action is needed. |
GPUVeryHot | The GPUVeryHot alert triggers when a GPU's temperature exceeds 90°C. |
GPUXID149LinkIssueHGX | A GPU has experienced a fatal loss of link across the internal NVLink domain. The node will be restarted to recover the GPU. |
KernelDeadlock | A kernel deadlock has been detected on this node. This indicates a severe system issue where processes are hung. |
KernelHardlock | A CPU hard lockup has been detected on this node via the NMI watchdog. |
KubeNodeNotReady | The KubeNodeNotReady alert indicates when a node's status condition is not Ready in a Kubernetes cluster. This alert can be an indicator of critical system health issues. |
KubeNodeNotReadyHGX | The KubeNodeNotReadyHGX alert indicates that a node has been unready or offline for more than 15 minutes. |
ManyUCESingleBankH100 | The ManyUCESingleBankH100 alert triggers when there are two or more DRAM Uncorrectable Errors (UCEs) on the same row remapper bank of an H100 GPU. |
MetalDevRedfishError | The MetalDevRedfishError alert indicates an out-of-band action against a BMC failed. |
NVL72GPUHighFECCKS | The NVL72GPUHighFECCKS alert indicates that a GPU is observing a high rate of forward error correction indicating signal integrity issues. |
NVL72SwitchHighFECCKS | The NVL72SwitchHighFECCKS alert indicates that a NVSwitch is observing a high rate of forward error correction indicating signal integrity issues. |
NVLinkDomainDriverVersionMismatch | Node has an outdated NVIDIA driver major/minor version compared to other nodes in its NVLink domain. The node will be rebooted to upgrade to the latest driver version. |
NVLinkDomainFullyTriaged | NVLinkDomainFullyTriaged indicates rack is entirely triaged. This rack should either be investigated for an unexpected rack level event or returned to fleet. |
NVLinkDomainProductionNodeCountLow | NVLinkDomainDegraded indicates rack has less nodes in a production state than expected. This rack will need manual intervention to either restore capacity or reclaim for further triage. |
NVLinkMaskError | GPUs are reporting link mask errors. This may indicate NVLink connectivity issues that could affect GPU communication. |
NVLinkXIDFatal | A fatal NVSwitch XID error has been detected. XIDs 144-150 indicate NVLink hardware failures that prevent proper GPU communication. |
NodeBackendLinkFault | The NodeBackendLinkFault alert indicates that the backend bandwidth is degraded and the interface may be potentially lost. |
NodeBackendMisconnected | Node-to-leaf ports are either missing or incorrectly connected. |
NodeCPUHZThrottleLong | An extended period of CPU frequency throttling has occured. CPU throttling most often occurs due to power delivery or thermal node level problems. The node will immediately and automatically be taken out of service and the job interrupted. |
NodeGPUNVLBWLossLinkRecovery | Bandwidth degradation detected on NVLink due to frequent recovery events. |
NodeGPUNVLBWLossRetransmitNode | Bandwidth degradation detected on NVLink due to high transmit retry rates. |
NodeGPUNVLBWLossRetransmitSwitch | Bandwidth degradation detected on NVLink due to high transmit retry rates. |
NodeGPUNVLinkDown | The node is experiencing NVLink issues and will be automatically triaged. |
NodeGPUXID149NVSwitch | A GPU has experienced a fatal NVLink error. The node will be restarted to recover the GPU. |
NodeGPUXID149s4aLinkIssueFordPintoRepeated | A GPU has experienced a fatal NVLink error. This is a frequent offender and automation will remove the node from the cluster. |
NodeGPUXID149s4aLinkIssueLamboRepeated | A GPU has experienced a fatal NVLink error. This is a frequent offender and automation will remove the node from the cluster. |
NodeGPUXID149s4aLinkIssueNeedsUpgradeRepeated | A GPU has experienced a fatal NVLink error. This is a frequent offender and automation will remove the node from the cluster. |
NodeGPUXID149s4aLinkIssueRepeatedGB300 | A GPU has experienced a fatal NVLink error. This is a frequent offender and automation will remove the node from the cluster. |
NodeLoadAverageHigh | The NodeLoadAverageHigh alert triggers when a node's load average exceeds 1000 for more than 15 minutes. |
NodeMemoryError | The NodeMemoryError alert indicates that a node has one or more bad DIMM (memory) modules. |
NodeNetworkReceiveErrs | NodeNetworkReceiveErrs alert indicates that a network interface has encountered receive errors exceeding a 1% threshold over a 2-minute period for 1 hour. |
NodePCIErrorH100GPU | The NodePCIErrorH100GPU alert indicates when a GPU is experiencing PCI bus communication errors. |
NodePCIErrorH100PLX | The NodePCIErrorH100PLX alert indicates a high rate of PCIe bus errors occurring on the PLX switch that connects H100 GPUs. |
NodeRepeatUCE | The NodeRepeatUCE alert indicates that a node has experienced frequent GPU Uncorrectable ECC (UCE) errors. |
NodeVerificationFailureNVFabric | The node is experiencing NVLink issues and will be automatically triaged. |
NodeVerificationMegatronDeadlock | HPC-Perftest failed megatron_lm test due to possible deadlock. Node should be triaged. |
PendingStateExtendedTime | The PendingStateExtendedTime alert indicates that a node has been in a pending state for an extended period of time. This alert helps identify nodes that need to be removed from their current state but are stuck for an extended time. |
PendingStateExtendedTimeLowGpuUtil | The PendingStateExtendedTimeLowGpuUtil alert triggers when a node has been in a pending state for more than 10 days and has had less than 1% GPU utilization in the last hour. This alert helps indicate if a node needs to be removed from its current state but has been stuck for an extended time. |
PersistentStorageFault | CephFS quota errors have been detected on this node. This may indicate issues with persistent storage mounts. |
ReadonlyFilesystem | A filesystem on this node has been remounted as read-only. |
Sector0LocalDiskErrors | I/O errors have been detected at sector 0 of the local NVMe storage. |
SuspectedLocalDiskErrors | I/O errors have been detected on local NVMe storage at non-sector-0 locations. This may indicate a failing disk. |
UnknownNVMLErrorOnContainerStart | The UnknownNVMLErrorOnContainerStart alert typically indicates that a GPU has fallen off the bus or is experiencing hardware issues. |
Understanding Node alerts and conditions
The following image shows an interruption caused by a Node alert, namely GPUContainedECCError.
- Blue lines: Indicate Node conditions
- Red lines: Indicate Node alerts
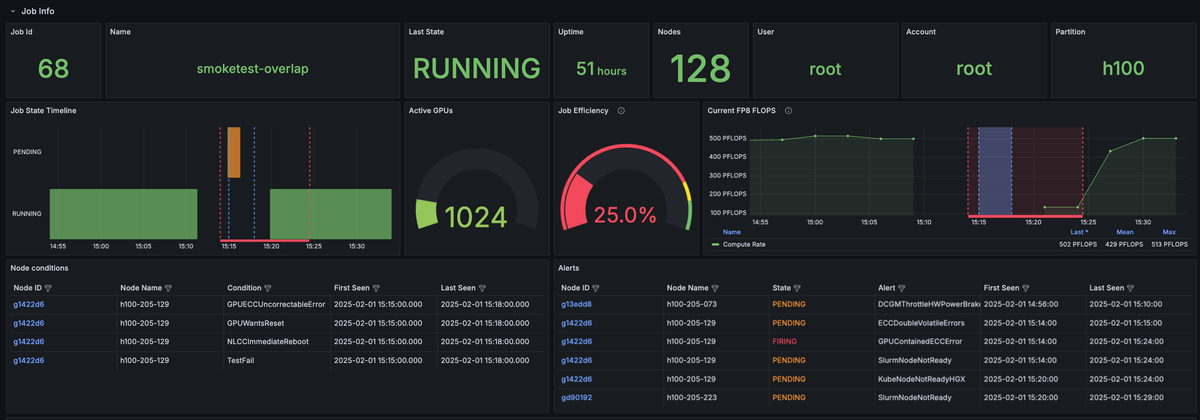
The Node alert indicated by the red line, GPUContainedECCError, appears prior to drop in compute, while the Node conditions indicated by the blue lines delineate the window the drop in compute occurred within.
The image shows that the H100 cluster experienced a hard fault around 15:15. Throughput dropped from 500 PFLOPS to 0 because the Slurm scheduler pulled a Node out of the pool due to a GPUContainedECCError. Understanding how Node alerts and conditions are overlaid on Node metrics can help diagnose and troubleshoot problems.
GPU Metrics
The GPU Metrics section displays detailed information related to hardware utilization. In this section, red lines correspond with higher temperature or utilization of the measured value, while green lines indicate a lower value or idle state. Whether these values suggest "good" or "bad" performance depends on the expected behavior and resource utilization of the job.
| Panel | Description |
|---|---|
| GPU Temperatures Running Jobs | Displays the temperature of the GPUs over time. Generally, an increase in temperature corresponds with a job run, indicating that the GPUs are busy. |
| GPU Core Utilization Running Jobs | Displays the utilization of GPU cores over time. Red indicates high utilization. |
| SM Utilization Running Jobs | The fraction of time at least one warp was active on a multiprocessor, averaged over all multiprocessors. Note that "active" does not necessarily mean warp is actively computing. For instance, warps waiting on memory requests are considered active. The value represents an average over a time interval and is not an instantaneous value. A value of 0.8 or greater is necessary, but not sufficient, for effective use of the GPU. A value less than 0.5 likely indicates ineffective GPU usage. |
| GPU Mem Copy Utilization Running Jobs | Displays the utilization of GPU memory. |
| Tensor Core Utilization Running Jobs | Displays the utilization of Tensor cores over time. |
| VRAM Usage | Plots the amount of VRAM used by the GPU over time. |
| GPUs Temperature | Displays the temperatures of the GPUs over time. |
| GPUs Power Usage | Plots the power usage of the GPUs, in Watts. |
GPU Metrics: Color coding
| Color | Meaning |
|---|---|
| Red | High utilization. |
| Orange-Yellow | Medium-low utilization. |
| Green | Low utlization or idle. |
| Black | No job running at this time. |
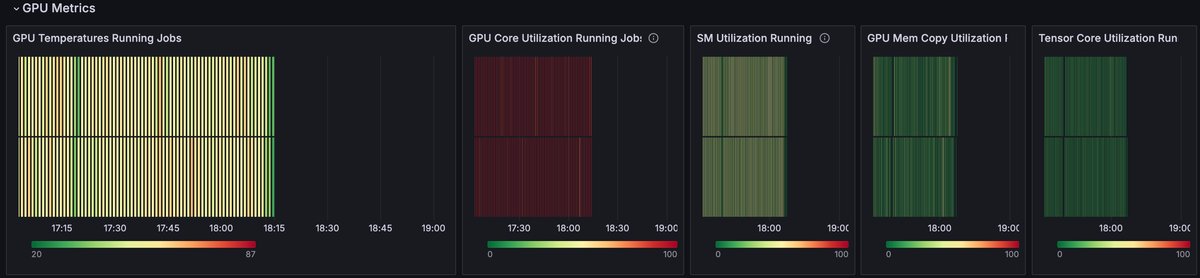
This example shows a high (red) value in the GPU Core Utilization panel, a medium (yellow) value in the GPU Temperatures panel, and low (green) values in the GPU Mem Copy Utilization panel. This indicates that the tracked Slurm job had high utilization of GPU Cores and low utilization of GPU memory, which may be expected for a small model size.
Comparing the fluctuations in GPU Temperature with the charts in the Filesystem section reveals that drops in the GPU temperature may correspond with spikes in NFS write operations.
Filesystem
The Filesystem section includes information about read and write operations on the Network File System (NFS) and local files.
| Panel | Description |
|---|---|
| Local Max Disk IO Utilization (Min 1m) | The green line indicates write operations and the yellow line indicates read operations. |
| Local Avg Bytes Read / Written Per Node (2m) | The red line indicates write operations and the blue line indicates read operations. |
| Local Total bytes Read / Written (2m) | The red line indicates write operations and the blue line indicates read operations. |
| Local Total Read / Write Rate (2m) | The red line indicates write operations and the blue line indicates read operations. |
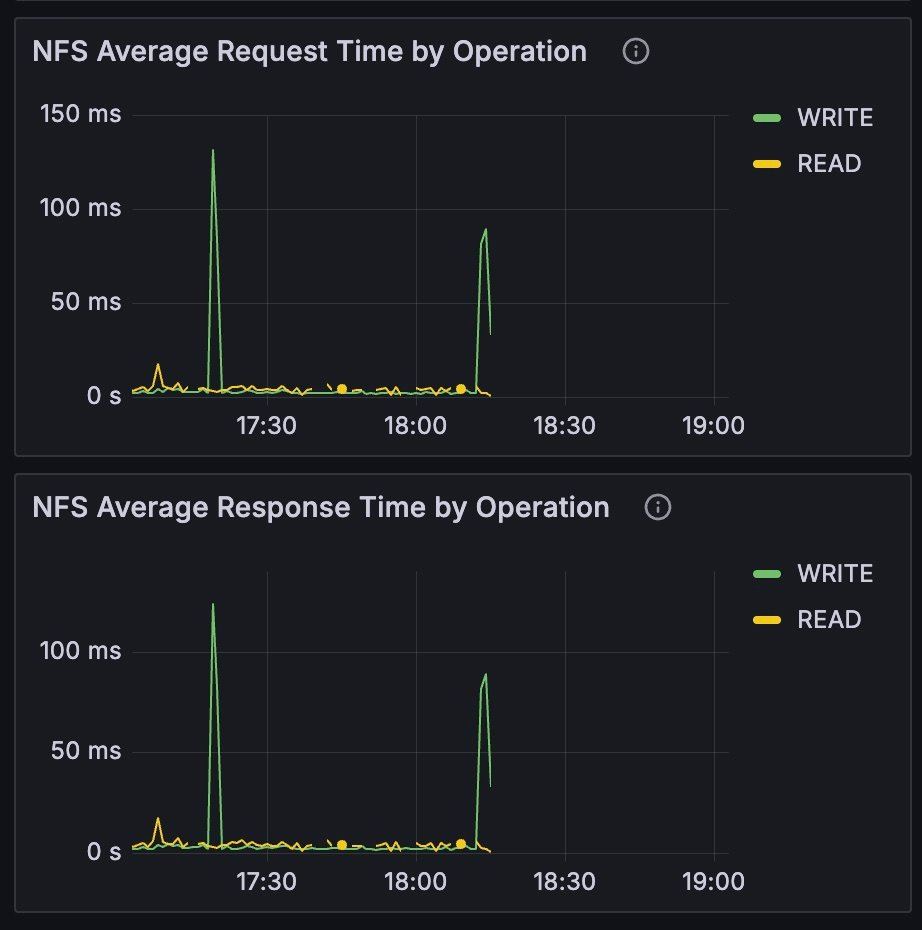
| NFS Average Request Time by Operation | Duration requests took from when a request was enqueued to when it was completely handled for a given operation, in seconds. The green line indicates write operations and the yellow line indicates read operations. |
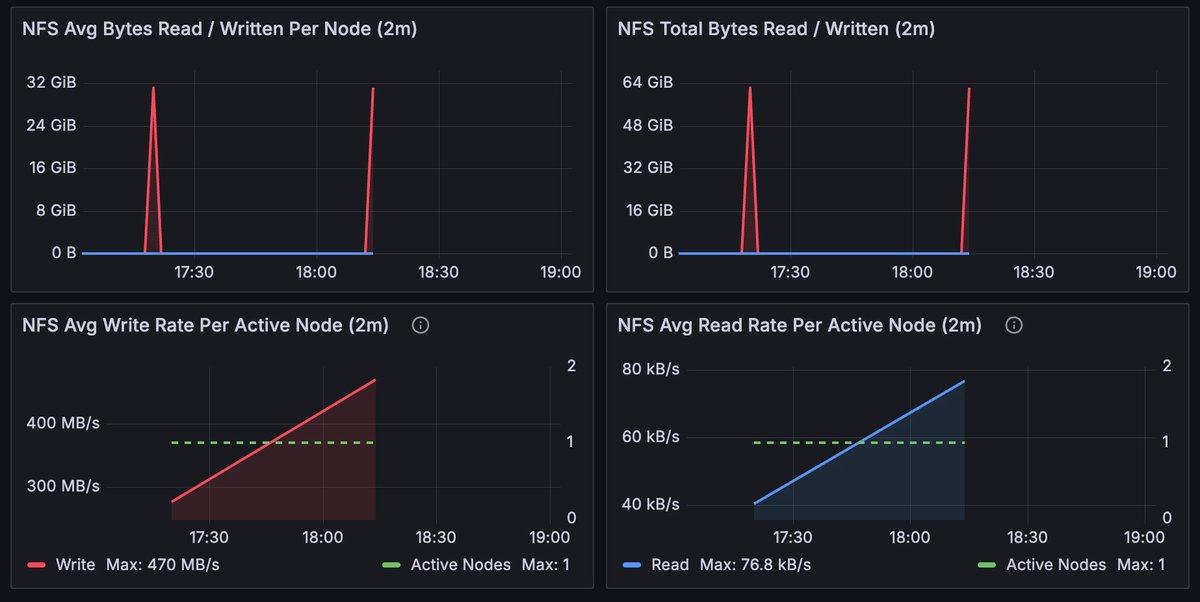
| NFS Avg Bytes Read / Written Per Node (2m) | The red line indicates write operations and the blue line indicates read operations. |
| NFS Total Bytes Read / Written (2m) | The red line indicates write operations and the blue line indicates read operations. |
| NFS Total Read / Write Rate | The red line indicates write operations and the blue line indicates read operations. |
| NFS Average Response Time by Operation | Duration requests took to get a reply back after a request for a given operation was transmitted, in seconds. The green line indicates write operations and the yellow line indicates read operations. |
| NFS Avg Write Rate Per Active Node (2m) | The red line indicates write operations and the dashed green line displays active nodes. Only includes nodes writing over 10 KB/s. |
| NFS Avg Read Rate Per Active Node (2m) | The blue line indicates read operations and the dashed green line displays active nodes. Only includes nodes reading over 10 KB/s. |
| NFS Nodes with Retransmissions | Retransmissions indicate packet loss on the network, either due to congestion or faulty equipment or cabling. |
Filesystem: NFS Average Response and Request
The NFS Average Response and Request graphs describe the performance of the filesystem. A slowdown or spike could indicate that the storage is too slow, and that the job might perform better with faster or a different type of storage, such as object storage.
Filesystem: NFS Total Read / Write
The NFS Total Read / Write graphs typically display a large red spike when a job starts, as the model and data are read in. While the job runs, the graph shows smaller write spikes at regular intervals, which occur as the checkpoints are written out. Comparing these graphs with the panels in the GPU Metrics section may help to confirm that running jobs are behaving as expected.
Node Resources
The Node Resources section includes the CPU Allocation panel, which displays the total number of CPU cores utilized over the job runtime.