Node Wrangler
View aggregated Node information across your clusters
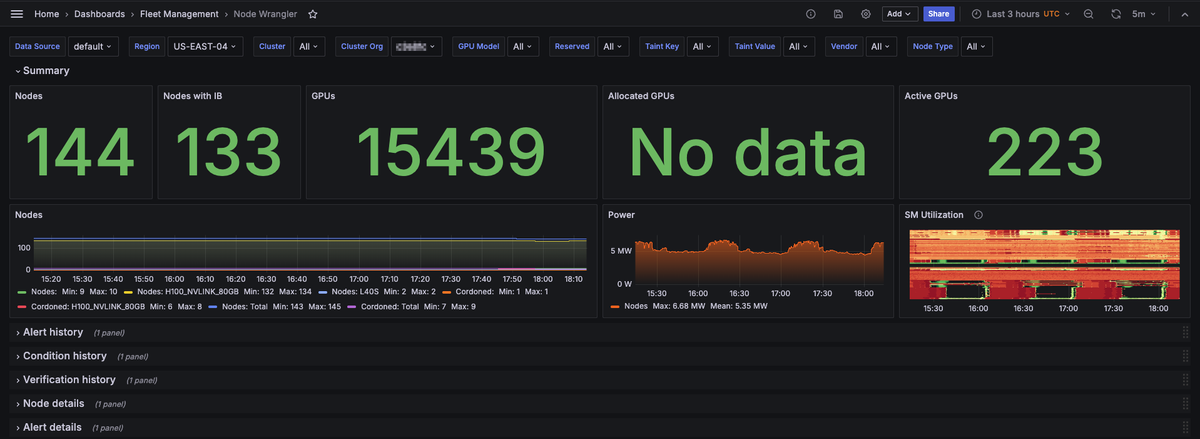
The Node Wrangler dashboard displays aggregated information about the Nodes in your fleet. It provides a summary of Node status, power utilization, and SM utilization over time, as well as detailed information about each Node's condition and alerts. The dashboard is divided into several panel groups, each providing different information about the Nodes in your fleet. You can filter the data displayed in the dashboard by selecting specific data sources, regions, clusters, or organizations.
Prerequisites
You must be a member of the admin, metrics, or write groups to access Grafana dashboards.
Open the dashboard
- Log in to the CoreWeave Cloud Console.
- In the left navigation, select Grafana to launch your Managed Grafana instance.
- Click Dashboards.
- Expand Fleet Management, then choose Node Wrangler.
- Select Data Source, Region, Cluster, Org, or other filters at the top of the page.
If you are already logged in to CoreWeave Cloud Console, you can open the Node Wrangler dashboard directly from this link.
Example view
When the dashboard first loads, the Summary panel group is expanded by default.
Panel groups
The Node Wrangler dashboard is divided into panel groups, each providing different information about the Nodes in your fleet. When viewing the dashboard, click these group headings to collapse or expand that section.
| Section | What you'll find |
|---|---|
| Summary | Overview of Nodes and their status, power utilization and SM utilization over time. |
| Alert History | Nodes alert status over the selected time range. |
| Condition History | Nodes condition status over the selected time range. |
| Verification History | Nodes verification status over the selected time range. |
| Node Details | Detailed table of Node information, including uptime, InfiniBand status, IP addresses, serial numbers, and current verification messages. |
| Alert Details | Detailed table of current alert information, including state, severity, and Node and Pod information. |