Node Details
View health and performance of an individual Node
To view the dashboard, go to the Node Details dashboard.
For accessing CoreWeave Grafana Dashboards instructions, see Access CoreWeave Grafana Dashboards.
The Node Details dashboard is your single-pane view for everything happening on a specific compute Node in your cluster—from kernel-level events and GPU thermals to Slurm queue metrics and Kubernetes Pod allocations. Use it to troubleshoot anomalies, validate hardware, and verify that each Node is meeting workload expectations.
Example view
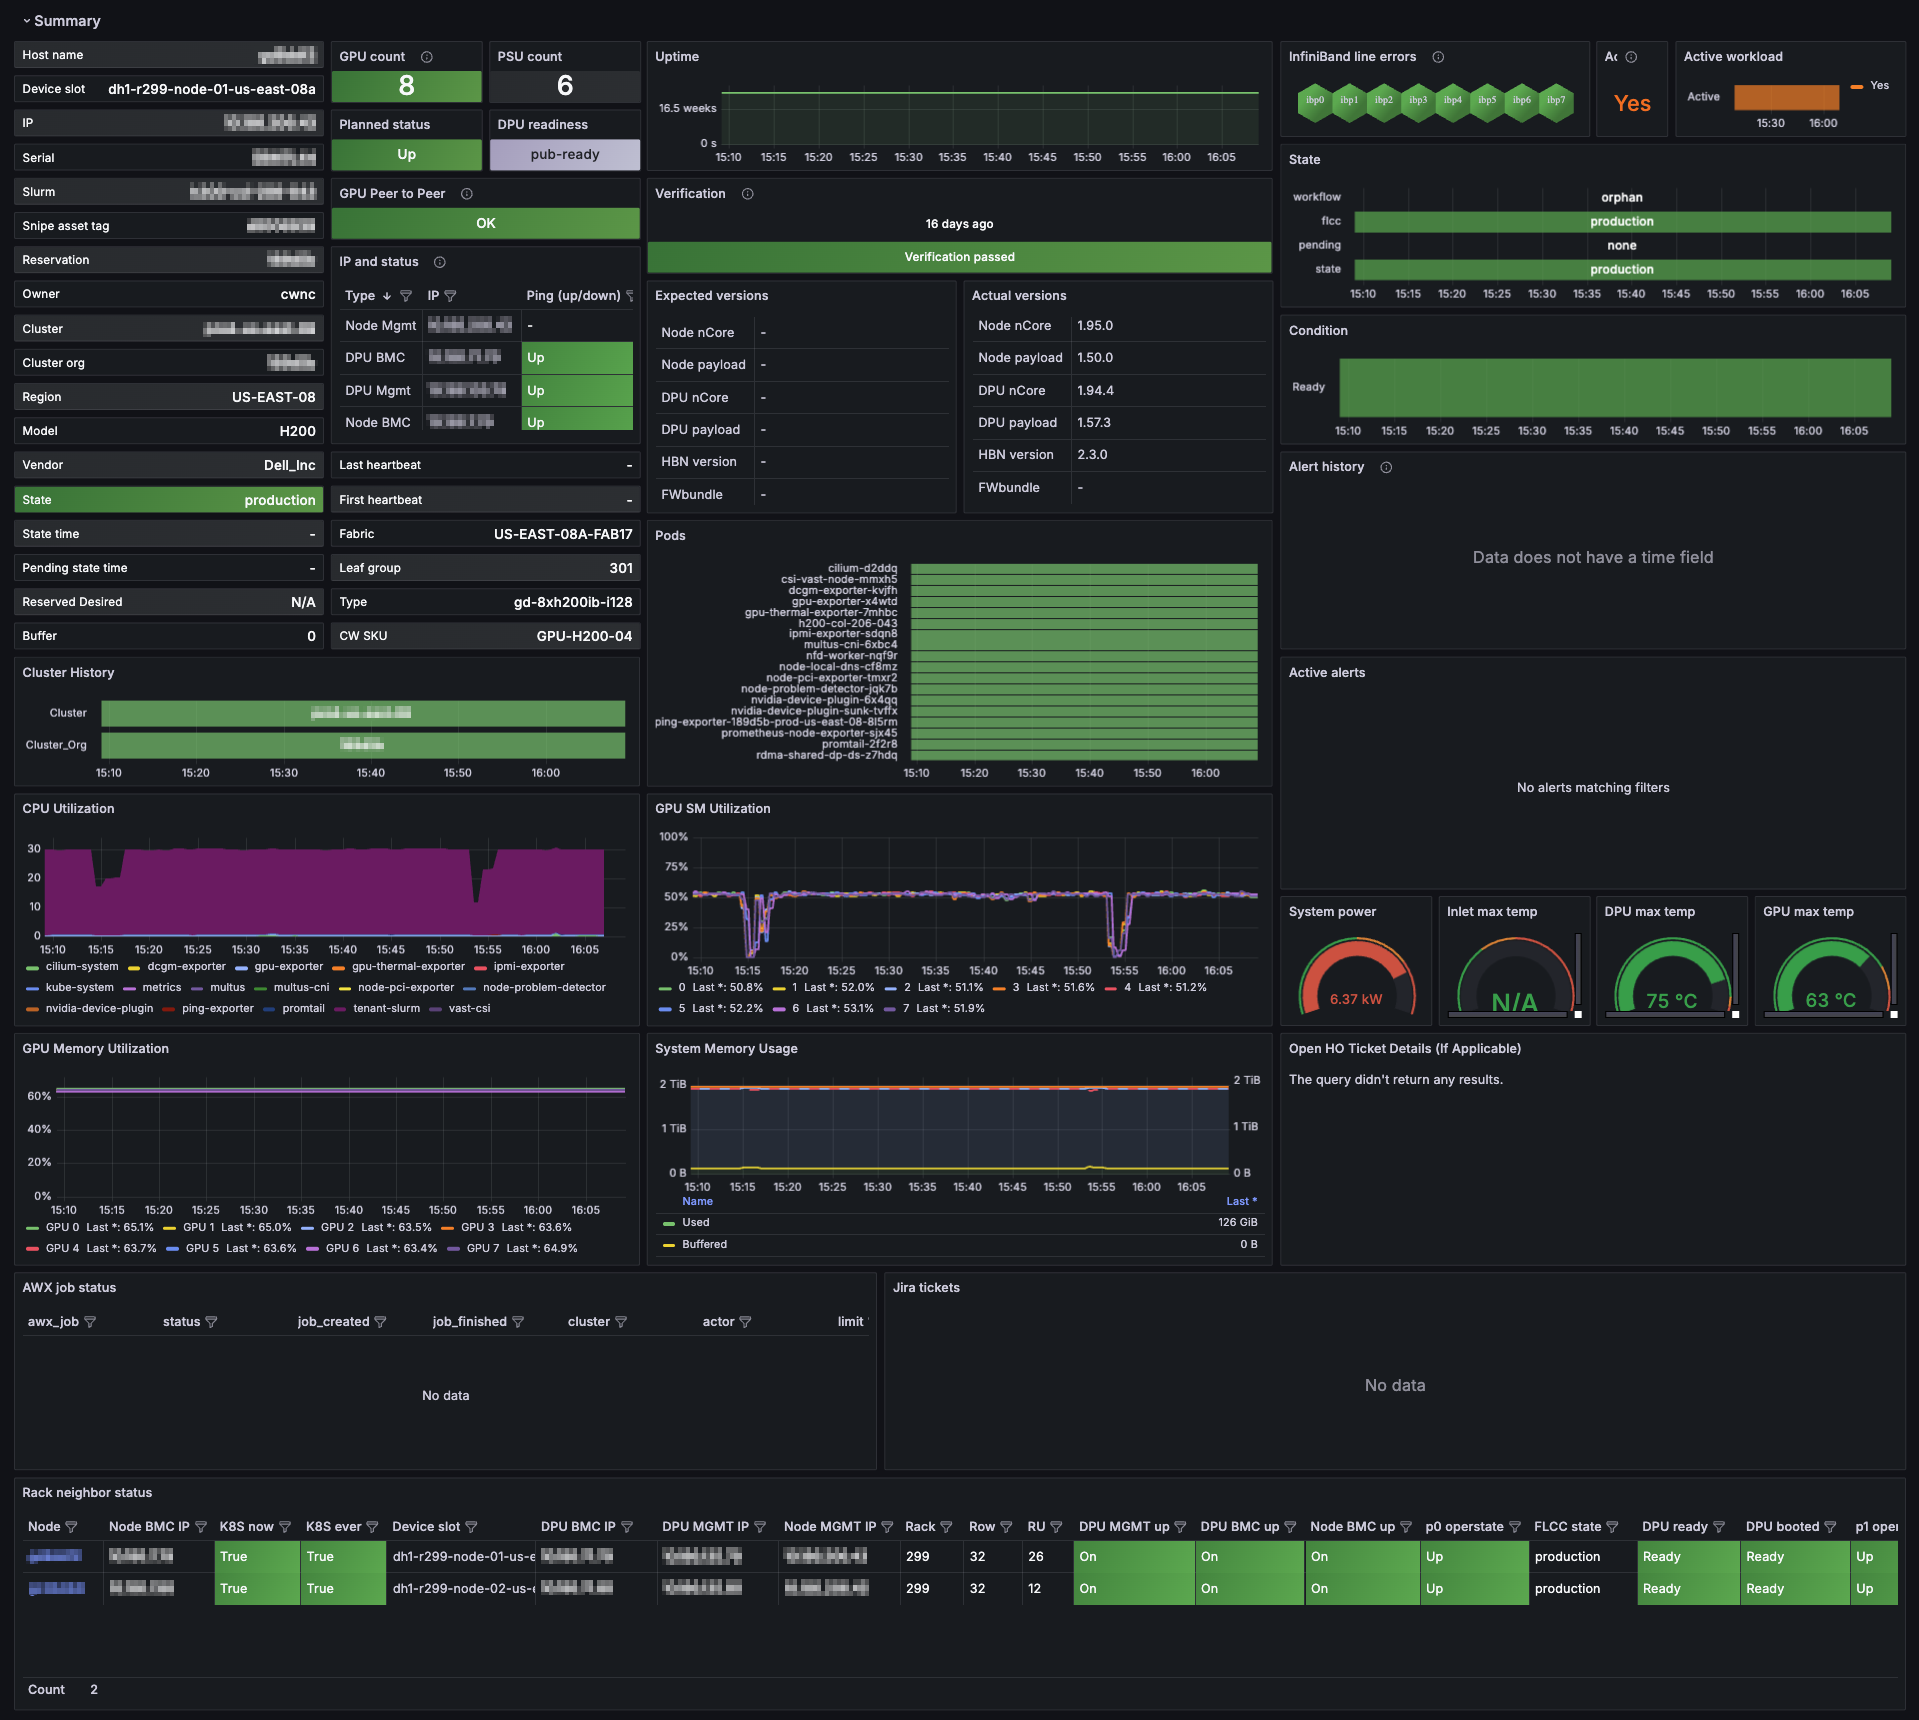
When the dashboard first loads, the Summary panel group is expanded by default. The Summary section is shown in this example.
Click the graphic below to view a larger version in a new tab.
Panel groups
The dashboard has several expandable panel groups. Each focuses on a different aspect of Node telemetry. When viewing the dashboard, click these group headings to collapse or expand that section.
| Section | What you'll find |
|---|---|
| Summary | High-level "at-a-glance" cards for host identity, CPU/GPU utilization, network traffic, current alerts, and HPC verification status. |
| Logs | A rolling log view that merges Kubernetes events, kernel messages, Node Problem Detector findings, and recent alert annotations. Ideal for pinpointing the root cause of spikes or failures. |
| Network | End-to-end connectivity metrics—ICMP loss from the Ping Exporter, conntrack table usage, interface throughput, packet error rates, and more. |
| Resources | Capacity and utilization for CPU, GPU, memory, NFS mounts, and local disk I/O, plus historical usage charts to identify resource pressure. |
| GPUs | Everything GPU-related: ECC errors, power draw, clock speeds, memory usage, thermal headroom, fan RPM, and NVSwitch/NVLink health. |
| Temperatures | Real-time thermal data for GPU cores, HBM memory, motherboard sensors, and per-Pod thermal impact—helpful for identifying cooling hot spots. |
| InfiniBand | Port state, link speed, retransmit counts, and congestion indicators for Nodes equipped with InfiniBand adapters. |
| Slurm Info | Node state within your Slurm cluster (idle, alloc, drain), running jobs, and allocation timelines—useful for mixed Kubernetes-Slurm environments. |
| Kubernetes | Pod allocation breakdowns, taints, reservation status, CPU-hours per job, memory by namespace, and Calico network policy statistics. |
| Verification | Results from the latest HPC verification suite, including GPU compute benchmarks, stress tests, and sanity checks. |
| Hardware | Low-level chassis data: IPMI power readings, fan speeds, serial numbers, PCIe link status, and NVLink bandwidth graphs. |
| Unsorted | Additional metrics that do not yet belong to a dedicated group; check here for new or experimental panels. |
When to use this dashboard
The Node Details dashboard lets you correlate sections quickly. For example, expand multiple groups at a time to observe how a GPU thermal event in Temperatures aligns with throttling in GPUs and corresponding alerts in Logs. In addition, Grafana's time-range controls enable time-shift analysis, allowing you to rewind and inspect historical Node behavior during an incident window.