Usage by Product and Zone
Monitor resource usage by product and zone
View the dashboard: Usage by Product and Zone
For accessing CoreWeave Grafana Dashboards instructions, see Access CoreWeave Grafana Dashboards.
The Usage by Product and Zone dashboard provides a detailed view of resource consumption, categorized by product and zone. It displays key metrics such as GPU and CPU usage, storage consumption, and IP address allocation to help you understand both your measured usage and the net usage that forms the basis for billing.
Consumption metrics are shown in daily aggregates, up to the end of the last full billing day ending at 5 PM US and Canadian Eastern Time. By default, this dashboard is set to show the current billing month to date.
Billing months span from 5 PM US and Canadian Eastern Time the day before the start of a month to 5 PM US and Canadian Eastern Time on the last day of the month. For example, billing for September 2025 spans from August 31, 2025 at 5 PM to September 30, 2025 at 5 PM.
View the dashboard
To view the dashboard, go to the Usage by Product and Zone dashboard in Grafana, or navigate to Dashboards → Cost and Usage → Usage by Product and Zone in Grafana.
For instructions on accessing CoreWeave Grafana dashboards, see Access and Use CoreWeave Grafana Dashboards.
Measured usage vs. net usage
The dashboard shows two sets of cards for each resource type (GPUs, CPUs, Storage, IP Addresses):
- Measured usage (all metered usage): All usage metered by CoreWeave before any exclusions, adjustments, or special programs are applied.
- Net usage (after exclusions): Usage remaining after CoreWeave-level exclusions and adjustments are applied. This net usage is what CoreWeave uses as the basis for your billing, subject to your contract terms (for example, rates, discounts, and credits).
Both measured and net usage are reported in the same units and over the same time window so you can compare them directly.
Panels
The Usage by Product and Zone dashboard contains the following panels:
| Panel | Description |
|---|---|
| GPUs | Displays daily aggregate instance-hours by product and zone. |
| CPUs | Displays daily aggregate instance-hours by product and zone. |
| Storage | Displays daily aggregate GiB-hours for Distributed File Storage (POSIX) |
| IP Addresses | Displays daily aggregate address-hours by IP addresses |
| Summary | Displays the product, its zone, and its aggregate consumption over the full time period |
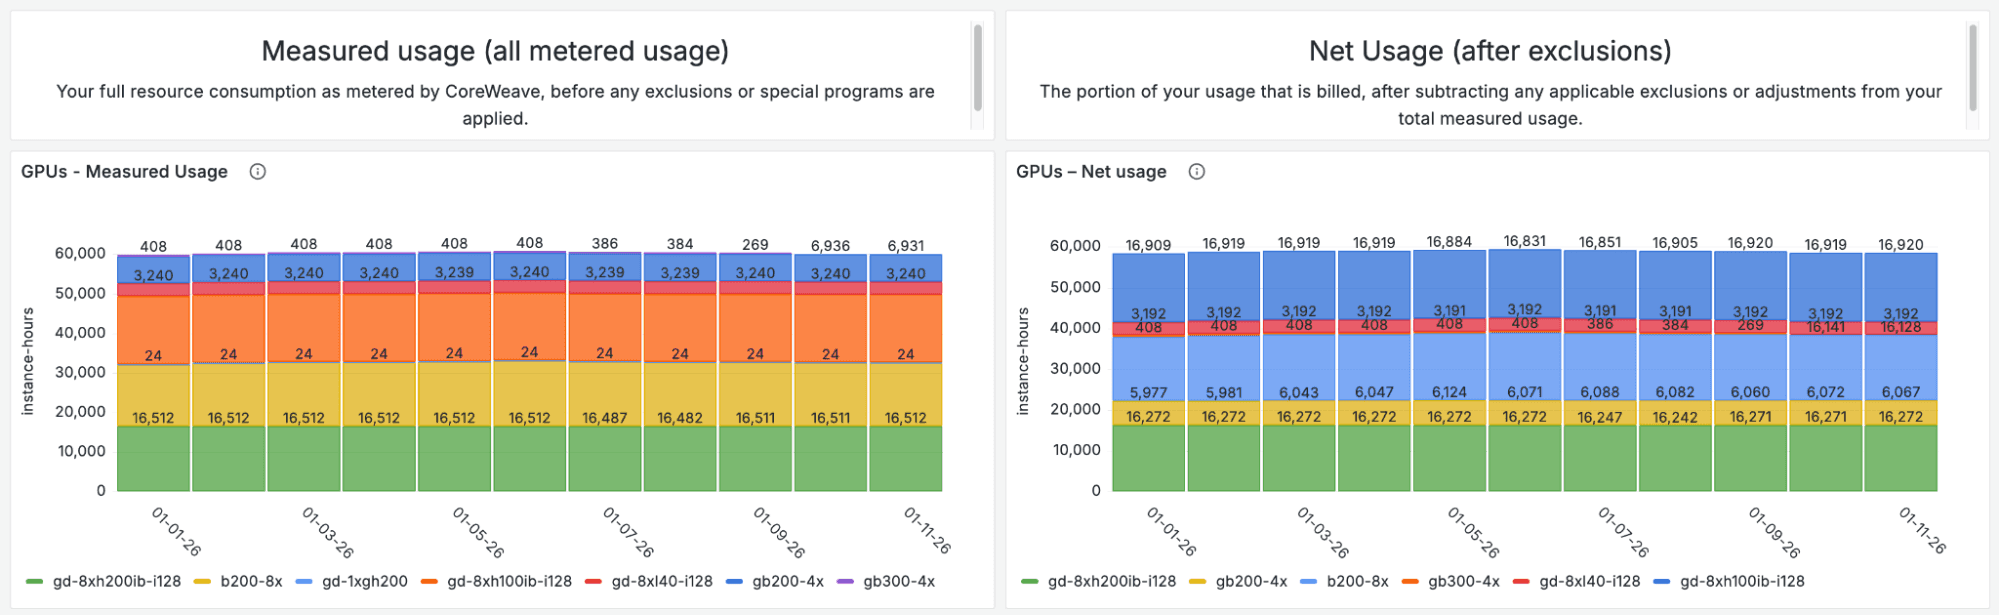
GPUs Panel
The GPUs panel displays daily aggregate instance-hours by product and zone:
- GPUs - Measured usage: Shows all GPU instance-hours metered by CoreWeave, grouped by product and zone, before any exclusions, adjustments, or special programs are applied.
- GPUs - Net usage: Shows GPU instance-hours after CoreWeave-level exclusions and adjustments have been applied. This net usage is used as the basis for your billing, subject to your contract terms.
Both panels use the same daily granularity and time range, allowing you to compare total measured GPU usage against the net amount counted toward billing.
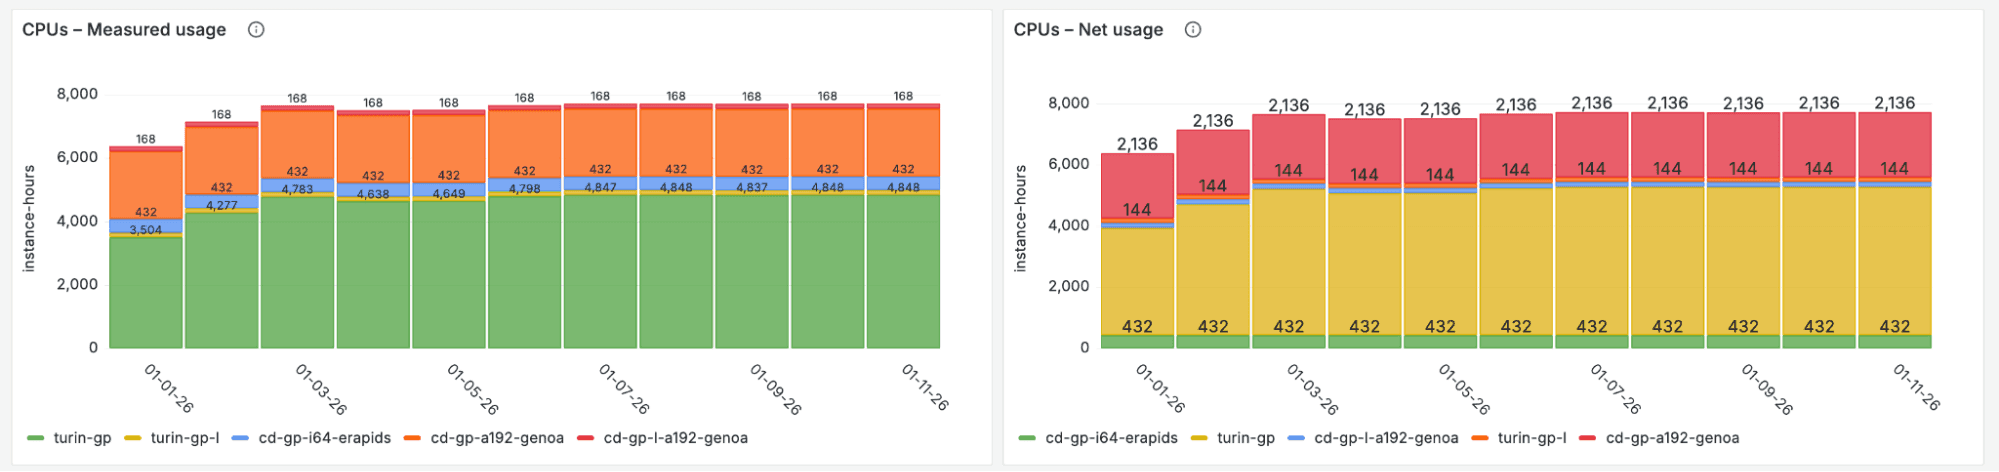
CPUs Panel
The CPUs panel displays daily aggregate instance-hours by product and zone:
- CPUs - Measured usage: Shows all CPU instance-hours metered by CoreWeave, grouped by product and zone, before any exclusions, adjustments, or special programs are applied.
- CPUs - Net usage: Shows CPU instance-hours after CoreWeave-level exclusions and adjustments have been applied. This net usage is used as the basis for your billing, subject to your contract terms.
As with GPUs, both CPU panels are aligned by time range and aggregation so you can see the impact of exclusions over time.
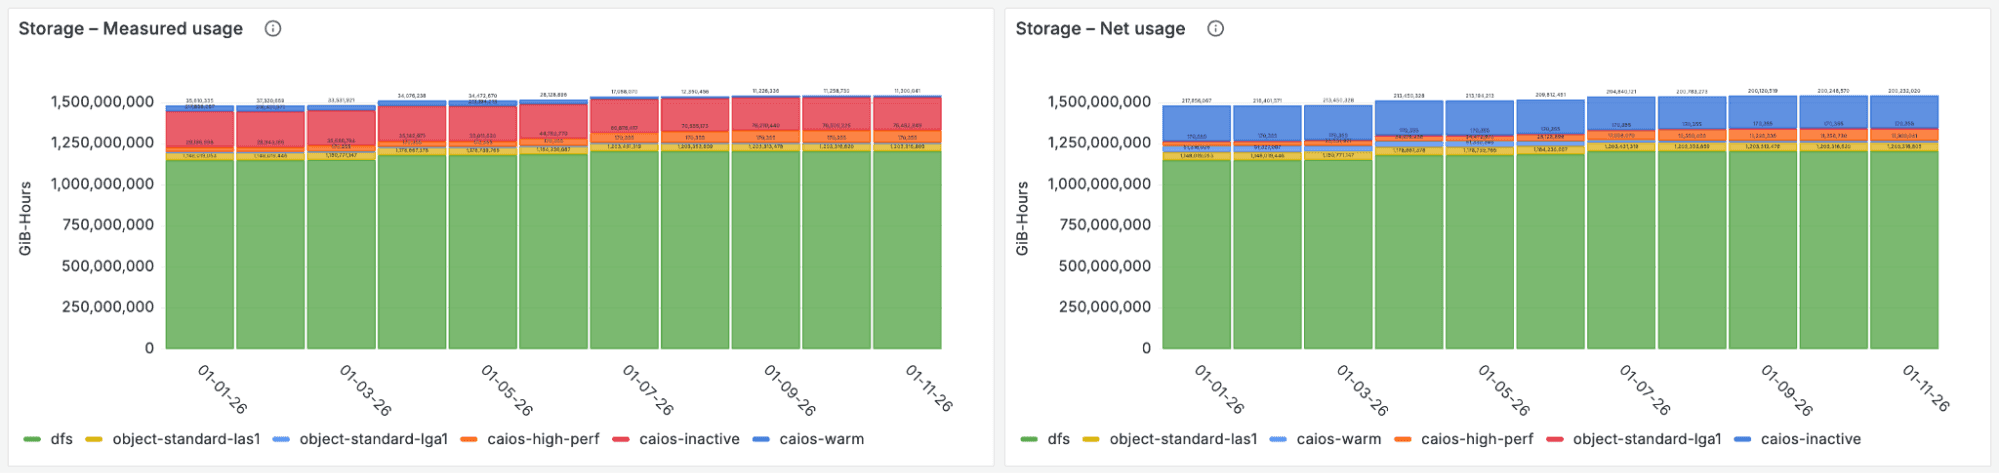
Storage Panel
The Storage section contains two panels that show Distributed File Storage (POSIX) usage by product and zone:
- Storage - Measured usage: Shows daily aggregate GiB-hours of provisioned Distributed File Storage, grouped by product and zone, before any exclusions or adjustments.
- Storage - Net usage: Shows daily aggregate GiB-hours of storage after CoreWeave-level exclusions and adjustments have been applied. This net storage usage is used as part of the basis for your billing, subject to your contract terms.
Use these panels to understand how much storage you have provisioned and how much of that usage is counted toward billing.
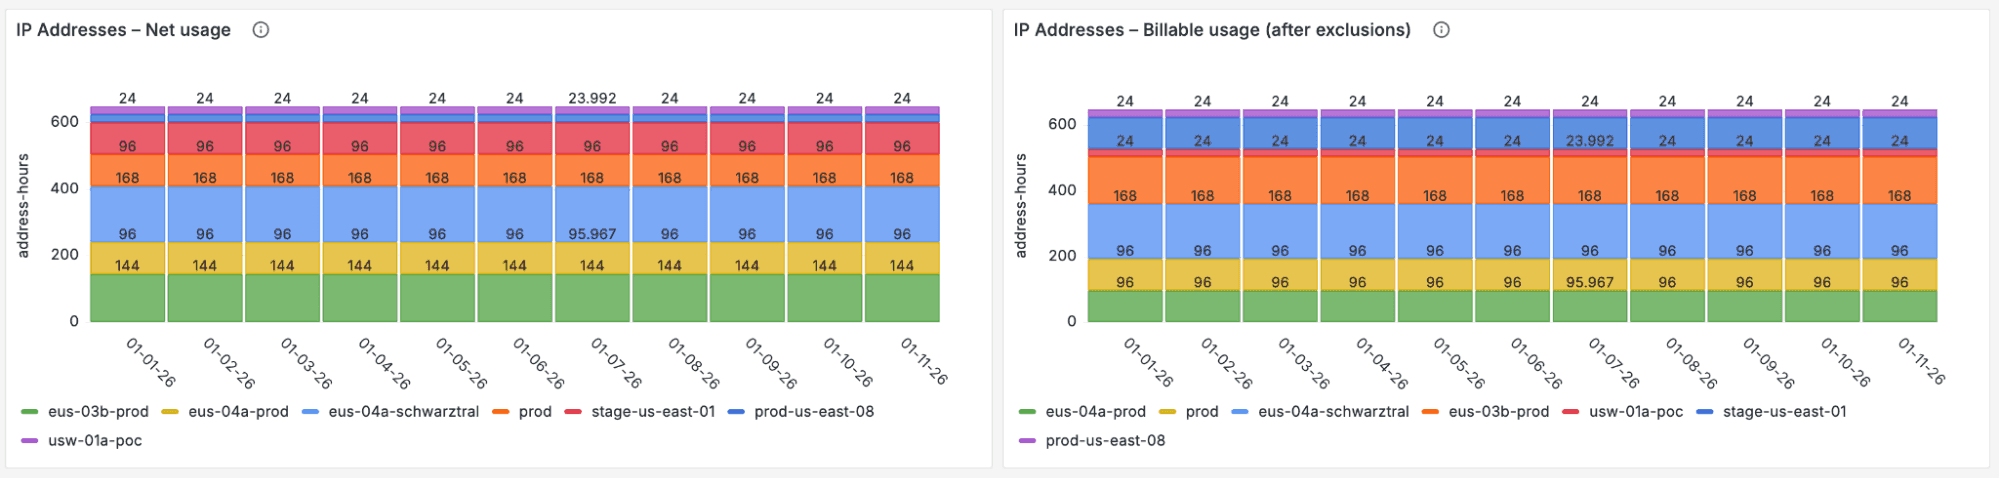
IP Addresses Panel
The IP Addresses section contains two panels that show IP address allocation by product and zone:
- IP Addresses - Measured usage: Shows daily aggregate address-hours allocated, grouped by IP address, product, and zone, before any exclusions or adjustments.
- IP Addresses - Net usage: Shows daily aggregate address-hours after CoreWeave-level exclusions and adjustments have been applied. This net IP usage is used as part of the basis for your billing, subject to your contract terms.
These panels help you see how IP address allocation translates into the usage that is ultimately counted toward billing.